


 |
市場調查報告書
商品編碼
1920851
全球人工光合作用市場(至 2035 年):依技術類型、催化劑類型、應用類型、最終用戶類型、地區、產業趨勢及預測Artificial Photosynthesis Market, Till 2035: Distribution by Type of Technology, Type of Catalyst, Type of Application, Type of End User, and Geographical Regions: Industry Trends and Global Forecasts |
||||||
人工光合作用市場概述
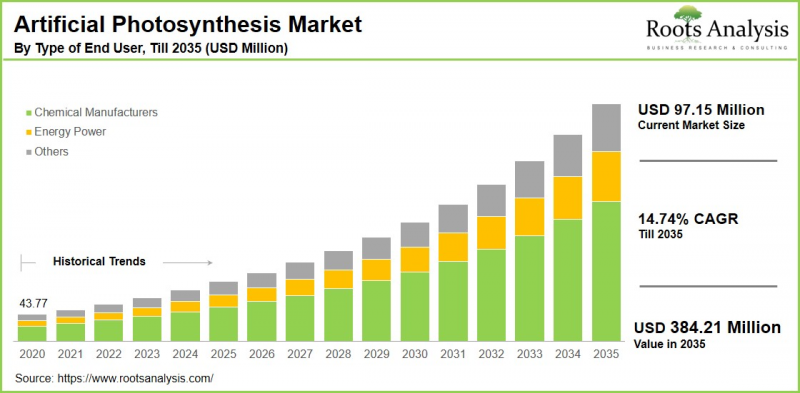
預計到 2035 年,全球人工光合作用市場規模將從目前的 9,700 萬美元增長至 3.84 億美元,預測期內複合年增長率 (CAGR) 為 14.74%。
人工光合作用市場:成長與趨勢
人工光合作用是一種先進的合成方法,它模擬自然界捕獲陽光、水和二氧化碳的能力,從而產生可用的太陽能和可再生能源。透過將太陽能轉化為化學能,人工光合作用提供了一種產生碳中和或負碳能源的方法,並正在成為化石燃料的可持續替代方案和應對氣候變遷的潛在策略。
人工光合作用市場正在清潔太陽能技術和綠色技術進步的交匯點上興起。重要的是,創新不僅限於利用太陽能發電,還包括設計先進的光電化學電池、開發多功能催化劑以及建立適用於工業應用的可擴展系統。隨著研究從早期概念驗證系統轉向更有效率、更穩定、更具商業應用價值的解決方案,投資者對人工光合作用永續燃料領域的興趣正在穩步增長。
在技術進步、對碳中和能源需求不斷增長以及全球對永續能源的大量投資的推動下,人工光合作用技術市場預計將快速擴張。隨著人工光合作用技術從研究階段走向大規模商業部署,它有望成為清潔能源領域的重要組成部分,帶來生態效益和巨大的市場機會。
本報告探討了全球人工光合作用市場,提供了市場規模估算、機會分析、競爭格局和公司概況。
目錄
第一章:專案概述
第二章:研究方法
第三章:市場動態
第四章:宏觀經濟指標
第五章:摘要整理
第六章:引言
第七章:監理環境
第八章:主要公司綜合資料庫
第九章:競爭格局
第十章:市場空白分析
第十一章:公司競爭力分析
第 12 章:新創企業生態系分析
第 13 章:公司簡介
- 章節概述
- 一片葉
- 巴斯夫股份公司
- 柏克萊實驗室
- 贏創工業
- 恩吉
- 富士軟片
- 富士通
- 印度科學研究所
- ICIQ
- 林德
- 三菱化學
- Panasonic
- 西門子能源
- Solaronix
- 太陽氫
- 東芝
- 豐田中央
- 十二(原名 Opus 12)
第十四章 大趨勢分析
第十五章:未滿足的需求分析
第十六章:專利分析
第十七章:最新進展
第十八章:全球人工光合作用市場
第十九章:依技術類型劃分的市場機會
第二十章:以催化劑類型劃分的市場機會
第二十一章:按應用類型劃分的市場機會
第二十二章:依最終使用者類型劃分的市場機會
第二十三章:北美人工光合作用的市場機會
第24章:歐洲人工光合作用的市場機會
第25章:亞太地區人工光合作用的市場機會
第26章:拉丁美洲人工光合作用的市場機會
第27章:中東與非洲人工光合作用的市場機會
第28章:主要公司的市場集中度分析
第29章:鄰近市場分析
第30章:關鍵成功策略
第31章:波特五力分析
第32章:SWOT分析
第33章:價值鍊式分析
第34章:Roots的策略建議
第35章:初步研究結果
第36章:報告結論
第37章:表格資料
第38章:公司與組織清單
Artificial Photosynthesis Market Overview
As per Roots Analysis, the global artificial photosynthesis market size is estimated to grow from USD 97 million in the current year USD 384 million by 2035, at a CAGR of 14.74% during the forecast period, till 2035.
The opportunity for artificial photosynthesis market has been distributed across the following segments:
Type of Technology
- Co-electrolysis
- Nanotechnology
- Photo-electro Catalysis
- Others
Type of Catalyst
- Biomimetic Catalyst
- Hydrogen Catalyst
- Molecular Catalyst
- Semiconductor Catalyst
- Water-Oxidizing Catalyst
Type of Application
- Carbon Dioxide Utilization
- Chemicals Production
- Sustainable Fuel Production
- Hydrocarbon
- Hydrogen
- Water Purification
Type of End User
- Chemical Manufacturer
- Energy Power
- Others
Geographical Regions
- North America
- US
- Canada
- Mexico
- Other North American countries
- Europe
- Austria
- Belgium
- Denmark
- France
- Germany
- Ireland
- Italy
- Netherlands
- Norway
- Russia
- Spain
- Sweden
- Switzerland
- UK
- Other European countries
- Asia
- China
- India
- Japan
- Singapore
- South Korea
- Other Asian countries
- Latin America
- Brazil
- Chile
- Colombia
- Venezuela
- Other Latin American countries
- Middle East and North Africa
- Egypt
- Iran
- Iraq
- Israel
- Kuwait
- Saudi Arabia
- UAE
- Other MENA countries
- Rest of the World
- Australia
- New Zealand
- Other countries
Artificial Photosynthesis Market: Growth and Trends
Artificial photosynthesis represents a sophisticated synthetic method that emulates nature's ability to capture sunlight, water, and carbon dioxide to produce usable solar and renewable energy. By converting solar energy into chemical forms, it provides a way to generate energy that is either carbon-neutral or carbon-negative, establishing itself as a sustainable alternative to fossil fuels and a potential strategy for addressing climate change.
The market for artificial photosynthesis is emerging at the intersection of clean solar energy advancements and green technologies. Importantly, innovation extends beyond just the electricity produced from solar energy, encompassing the design of advanced photoelectrochemical cells, the development of multifunctional catalysts, and the establishment of scalable systems suitable for industrial use. The interest from investors in the sustainable fuel artificial photosynthesis sector is consistently increasing as research shifts from initial proof-of-concept systems to more efficient, steady, and commercially applicable solutions.
The market for artificial photosynthesis technology is poised for rapid expansion, fueled by technological advancements, increasing demand for carbon-neutral energy, and substantial global investment in sustainable options. As it transitions from research to large-scale commercial deployment, it is set to become an essential component of the clean energy landscape, offering both ecological advantages and considerable market opportunities.
Artificial Photosynthesis Market: Key Segments
Market Share by Type of Technology
Based on type of technology, the global artificial photosynthesis market is segmented into, co-electrolysis, nanotechnology, photo-electro catalysis and others. According to our estimates, currently, the co-electrolysis sub-segment captures the majority of the market share. This is due to the promising applications of co-electrolysis technology in generating green hydrogen through photosynthesis, which serves as a clean and sustainable energy carrier, in addition to producing other carbon-based fuels and chemicals.
On the other hand, the photo-electro catalysis sub-segment is projected to experience a relatively higher CAGR during the forecast period. This is due to the continuous advancements in nanotechnology and materials science that is improving the efficiency and longevity of photo-electrocatalytic systems.
Market Share by Type of Catalyst
Based on type of catalyst, the global artificial photosynthesis market is segmented into biomimetic catalyst, hydrogen catalyst, molecular catalyst, semiconductor catalyst and water-oxidizing catalyst. According to our estimates, currently, the semiconductor catalysts sub-segment captures the majority of the market share. This increase can be attributed to their extensive use in numerous energy applications, especially in photocatalysis for water splitting and solar-to-chemical conversion technologies. The increasing need for renewable energy is also driving the market forward.
Market Share by Type of Application
Based on type of application, the global artificial photosynthesis market is segmented into carbon dioxide utilization, chemicals production, sustainable fuel production, hydrocarbon, hydrogen and water purification. According to our estimates, currently, the sustainable fuel artificial photosynthesis sub-segment captures the majority of the market share. This increase is fueled by the rising application of hydrocarbons for heating, electricity generation, and as fuels. The adaptability and high energy density of hydrocarbons render them suitable and practical for numerous end-use applications, such as feedstock for petrochemical facilities, chemicals, and synthetic rubber.
Market Share by Type of End User
Based on type of end user, the global artificial photosynthesis market is segmented into chemical manufacturer, energy power and others. According to our estimates, currently, the chemical manufacturer segment captures the majority of the market share. This growth can be attributed to the increasing demand for advanced solar-to-chemical conversion technologies and a variety of chemicals, including hydrocarbons.
On the other hand, the energy power segment is projected to experience a relatively higher CAGR during the forecast period. This growth can be attributed to technological advancements in catalysts, nanotechnology, and photoelectrochemical systems. Additionally, substantial government funding, increased investments, and the expanding hydrogen economy are driving the rapid expansion of this sub-segment.
Market Share by Geographical Regions
Based on geographical regions, the artificial photosynthesis market is segmented into North America, Europe, Asia, Latin America, Middle East and North Africa, and the rest of the world. According to our estimates, currently North America captures the majority share of the market, owing to the favorable policies and programs implemented by the North American government for long-term modernization and development initiatives. In contrast, the trends in the artificial photosynthesis market for the Asia-Pacific region indicate the highest growth rate during the forecast period.
Example Players in Artificial Photosynthesis Market
- A-LEAF
- BASF
- Berkeley Lab
- Evonik Industries
- Engie
- Fujifilm
- Fujitsu
- Indian Institute of Science
- ICIQ
- Linde
- Mitsubishi Chemical
- Panasonic
- Siemens Energy
- Solaronix
- SunHydrogen
- Toshiba
- Toyota Central
- Twelve (formerly known as Opus 12)
Artificial Photosynthesis Market: Research Coverage
The report on the artificial photosynthesis market features insights on various sections, including:
- Market Sizing and Opportunity Analysis: An in-depth analysis of the artificial photosynthesis market, focusing on key market segments, including [A] type of technology, [B] type of catalyst, [C] type of application, [D] type of end user, and [E] geographical regions.
- Competitive Landscape: A comprehensive analysis of the companies engaged in the artificial photosynthesis market, based on several relevant parameters, such as [A] year of establishment, [B] company size, [C] location of headquarters and [D] ownership structure.
- Company Profiles: Elaborate profiles of prominent players engaged in the artificial photosynthesis market, providing details on [A] location of headquarters, [B] company size, [C] company mission, [D] company footprint, [E] management team, [F] contact details, [G] financial information, [H] operating business segments, [I] portfolio, [J] moat analysis, [K] recent developments, and an informed future outlook.
- Megatrends: An evaluation of ongoing megatrends in the artificial photosynthesis industry.
- Patent Analysis: An insightful analysis of patents filed / granted in the artificial photosynthesis domain, based on relevant parameters, including [A] type of patent, [B] patent publication year, [C] patent age and [D] leading players.
- Recent Developments: An overview of the recent developments made in the artificial photosynthesis market, along with analysis based on relevant parameters, including [A] year of initiative, [B] type of initiative, [C] geographical distribution and [D] most active players.
- Porter's Five Forces Analysis: An analysis of five competitive forces prevailing in the artificial photosynthesis market, including threats of new entrants, bargaining power of buyers, bargaining power of suppliers, threats of substitute products and rivalry among existing competitors.
- SWOT Analysis: An insightful SWOT framework, highlighting the strengths, weaknesses, opportunities and threats in the domain. Additionally, it provides Harvey ball analysis, highlighting the relative impact of each SWOT parameter.
- Value Chain Analysis: A comprehensive analysis of the value chain, providing information on the different phases and stakeholders involved in the artificial photosynthesis market.
Key Questions Answered in this Report
- How many companies are currently engaged in artificial photosynthesis market?
- Which are the leading companies in this market?
- What factors are likely to influence the evolution of this market?
- What is the current and future market size?
- What is the CAGR of this market?
- How is the current and future market opportunity likely to be distributed across key market segments?
Reasons to Buy this Report
- The report provides a comprehensive market analysis, offering detailed revenue projections of the overall market and its specific sub-segments. This information is valuable to both established market leaders and emerging entrants.
- Stakeholders can leverage the report to gain a deeper understanding of the competitive dynamics within the market. By analyzing the competitive landscape, businesses can make informed decisions to optimize their market positioning and develop effective go-to-market strategies.
- The report offers stakeholders a comprehensive overview of the market, including key drivers, barriers, opportunities, and challenges. This information empowers stakeholders to stay abreast of market trends and make data-driven decisions to capitalize on growth prospects.
Additional Benefits
- Complimentary Excel Data Packs for all Analytical Modules in the Report
- 15% Free Content Customization
- Detailed Report Walkthrough Session with Research Team
- Free Updated report if the report is 6-12 months old or older
TABLE OF CONTENTS
1. PROJECT OVERVIEW
- 1.1. Context
- 1.2. Project Objectives
2. RESEARCH METHODOLOGY
- 2.1. Chapter Overview
- 2.2. Research Assumptions
- 2.3. Database Building
- 2.3.1. Data Collection
- 2.3.2. Data Validation
- 2.3.3. Data Analysis
- 2.4. Project Methodology
- 2.4.1. Secondary Research
- 2.4.1.1. Annual Reports
- 2.4.1.2. Academic Research Papers
- 2.4.1.3. Company Websites
- 2.4.1.4. Investor Presentations
- 2.4.1.5. Regulatory Filings
- 2.4.1.6. White Papers
- 2.4.1.7. Industry Publications
- 2.4.1.8. Conferences and Seminars
- 2.4.1.9. Government Portals
- 2.4.1.10. Media and Press Releases
- 2.4.1.11. Newsletters
- 2.4.1.12. Industry Databases
- 2.4.1.13. Roots Proprietary Databases
- 2.4.1.14. Paid Databases and Sources
- 2.4.1.15. Social Media Portals
- 2.4.1.16. Other Secondary Sources
- 2.4.2. Primary Research
- 2.4.2.1. Introduction
- 2.4.2.2. Types
- 2.4.2.2.1. Qualitative
- 2.4.2.2.2. Quantitative
- 2.4.2.3. Advantages
- 2.4.2.4. Techniques
- 2.4.2.4.1. Interviews
- 2.4.2.4.2. Surveys
- 2.4.2.4.3. Focus Groups
- 2.4.2.4.4. Observational Research
- 2.4.2.4.5. Social Media Interactions
- 2.4.2.5. Stakeholders
- 2.4.2.5.1. Company Executives (CXOs)
- 2.4.2.5.2. Board of Directors
- 2.4.2.5.3. Company Presidents and Vice Presidents
- 2.4.2.5.4. Key Opinion Leaders
- 2.4.2.5.5. Research and Development Heads
- 2.4.2.5.6. Technical Experts
- 2.4.2.5.7. Subject Matter Experts
- 2.4.2.5.8. Scientists
- 2.4.2.5.9. Doctors and Other Healthcare Providers
- 2.4.2.6. Ethics and Integrity
- 2.4.2.6.1. Research Ethics
- 2.4.2.6.2. Data Integrity
- 2.4.3. Analytical Tools and Databases
- 2.4.1. Secondary Research
3. MARKET DYNAMICS
- 3.1. Forecast Methodology
- 3.1.1. Top-Down Approach
- 3.1.2. Bottom-Up Approach
- 3.1.3. Hybrid Approach
- 3.2. Market Assessment Framework
- 3.2.1. Total Addressable Market (TAM)
- 3.2.2. Serviceable Addressable Market (SAM)
- 3.2.3. Serviceable Obtainable Market (SOM)
- 3.2.4. Currently Acquired Market (CAM)
- 3.3. Forecasting Tools and Techniques
- 3.3.1. Qualitative Forecasting
- 3.3.2. Correlation
- 3.3.3. Regression
- 3.3.4. Time Series Analysis
- 3.3.5. Extrapolation
- 3.3.6. Convergence
- 3.3.7. Forecast Error Analysis
- 3.3.8. Data Visualization
- 3.3.9. Scenario Planning
- 3.3.10. Sensitivity Analysis
- 3.4. Key Considerations
- 3.4.1. Demographics
- 3.4.2. Market Access
- 3.4.3. Reimbursement Scenarios
- 3.4.4. Industry Consolidation
- 3.5. Robust Quality Control
- 3.6. Key Market Segmentations
- 3.7. Limitations
4. MACRO-ECONOMIC INDICATORS
- 4.1. Chapter Overview
- 4.2. Market Dynamics
- 4.2.1. Time Period
- 4.2.1.1. Historical Trends
- 4.2.1.2. Current and Forecasted Estimates
- 4.2.2. Currency Coverage
- 4.2.2.1. Overview of Major Currencies Affecting the Market
- 4.2.2.2. Impact of Currency Fluctuations on the Industry
- 4.2.3. Foreign Exchange Impact
- 4.2.3.1. Evaluation of Foreign Exchange Rates and Their Impact on Market
- 4.2.3.2. Strategies for Mitigating Foreign Exchange Risk
- 4.2.4. Recession
- 4.2.4.1. Historical Analysis of Past Recessions and Lessons Learnt
- 4.2.4.2. Assessment of Current Economic Conditions and Potential Impact on the Market
- 4.2.5. Inflation
- 4.2.5.1. Measurement and Analysis of Inflationary Pressures in the Economy
- 4.2.5.2. Potential Impact of Inflation on the Market Evolution
- 4.2.6. Interest Rates
- 4.2.6.1. Overview of Interest Rates and Their Impact on the Market
- 4.2.6.2. Strategies for Managing Interest Rate Risk
- 4.2.7. Commodity Flow Analysis
- 4.2.7.1. Type of Commodity
- 4.2.7.2. Origins and Destinations
- 4.2.7.3. Values and Weights
- 4.2.7.4. Modes of Transportation
- 4.2.8. Global Trade Dynamics
- 4.2.8.1. Import Scenario
- 4.2.8.2. Export Scenario
- 4.2.9. War Impact Analysis
- 4.2.9.1. Russian-Ukraine War
- 4.2.9.2. Israel-Hamas War
- 4.2.10. COVID Impact / Related Factors
- 4.2.10.1. Global Economic Impact
- 4.2.10.2. Industry-specific Impact
- 4.2.10.3. Government Response and Stimulus Measures
- 4.2.10.4. Future Outlook and Adaptation Strategies
- 4.2.11. Other Indicators
- 4.2.11.1. Fiscal Policy
- 4.2.11.2. Consumer Spending
- 4.2.11.3. Gross Domestic Product (GDP)
- 4.2.11.4. Employment
- 4.2.11.5. Taxes
- 4.2.11.6. R&D Innovation
- 4.2.11.7. Stock Market Performance
- 4.2.11.8. Supply Chain
- 4.2.11.9. Cross-Border Dynamics
- 4.2.1. Time Period
- 4.3. Concluding Remarks
5. EXECUTIVE SUMMARY
6. INTRODUCTION
- 6.1. Overview of Artificial Photosynthesis Market
- 6.2. Applications for Artificial Photosynthesis Solutions
- 6.3. Advantages of Artificial Photosynthesis
- 6.4. Challenges with Artificial Photosynthesis
- 6.5. Future Perspective
7. REGULATORY SCENARIO
8. COMPREHENSIVE DATABASE OF LEADING PLAYERS
9. COMPETITIVE MARKET LANDSCAPE
- 9.1. Chapter Overview
- 9.2. Artificial Photosynthesis Market: Overall Market Landscape
- 9.2.1. Analysis by Year of Establishment
- 9.2.2. Analysis by Company Size
- 9.2.3. Analysis by Location of Headquarters
- 9.2.4. Analysis by Type of Company
- 9.3. Key Findings
10. WHITE SPACE ANALYSIS
11. COMPANY COMPETITIVENESS ANALYSIS
12. STARTUP ECOSYSTEM ANALYSIS
- 12.1. Artificial Photosynthesis Market: Startup Ecosystem Analysis
- 12.1.1. Analysis by Year of Establishment
- 12.1.2. Analysis by Company Size
- 12.1.3. Analysis by Location of Headquarters
- 12.1.4. Analysis by Ownership Type
- 12.2. Key Findings
13. COMPANY PROFILES
- 13.1. Chapter Overview
- 13.2. A-LEAF*
- 13.2.1. Company Overview
- 13.2.2. Company Mission
- 13.2.3. Company Footprint
- 13.2.4. Management Team
- 13.2.5. Contact Details
- 13.2.6. Financial Performance
- 13.2.7. Operating Business Segments
- 13.2.8. Service / Product Portfolio (project specific)
- 13.2.9. MOAT Analysis
- 13.2.10. Recent Developments and Future Outlook
- similar details are presented for other below mentioned companies based on information in the public domain
- 13.3. BASF SE
- 13.4. Berkeley Lab
- 13.5. Evonik Industries
- 13.6. Engie
- 13.7. Fujifilm
- 13.8. Fujitsu
- 13.9. Indian Institute of Science
- 13.10. ICIQ
- 13.11. Linde
- 13.12. Mitsubishi Chemical
- 13.13. Panasonic
- 13.14. Siemens Energy
- 13.15. Solaronix
- 13.16. SunHydrogen
- 13.17. Toshiba
- 13.18. Toyota Central
- 13.19. Twelve (formerly known as Opus 12)
14. MEGA TRENDS ANALYSIS
15. UNMET NEED ANALYSIS
16. PATENT ANALYSIS
17. RECENT DEVELOPMENTS
- 17.1. Chapter Overview
- 17.2. Recent Funding
- 17.3. Recent Partnerships
- 17.4. Other Recent Initiatives
18. GLOBAL ARTIFICIAL PHOTOSYNTHESIS MARKET
- 18.1. Chapter Overview
- 18.2. Key Assumptions and Methodology
- 18.3. Trends Disruption Impacting Market
- 18.4. Demand Side Trends
- 18.5. Supply Side Trends
- 18.6. Global Artificial Photosynthesis Market, Historical Trends (Since 2020) and Forecasted Estimates (Till 2035)
- 18.7. Multivariate Scenario Analysis
- 18.7.1. Conservative Scenario
- 18.7.2. Optimistic Scenario
- 18.8. Investment Feasibility Index
- 18.9. Key Market Segmentations
19. MARKET OPPORTUNITIES BASED ON TYPE OF TECHNOLOGY
- 19.1. Chapter Overview
- 19.2. Key Assumptions and Methodology
- 19.3. Revenue Shift Analysis
- 19.4. Market Movement Analysis
- 19.5. Penetration-Growth (P-G) Matrix
- 19.6. Artificial Photosynthesis Market for Co-electrolysis: Historical Trends (Since 2020) and Forecasted Estimates (Till 2035)
- 19.7. Artificial Photosynthesis Market for Nanotechnology: Historical Trends (Since 2020) and Forecasted Estimates (Till 2035)
- 19.8. Artificial Photosynthesis Market for Photo-electro Catalysis: Historical Trends (Since 2020) and Forecasted Estimates (Till 2035)
- 19.9. Artificial Photosynthesis Market for Others: Historical Trends (Since 2020) and Forecasted Estimates (Till 2035)
- 19.10. Data Triangulation and Validation
- 19.10.1. Secondary Sources
- 19.10.2. Primary Sources
- 19.10.3. Statistical Modeling
20. MARKET OPPORTUNITIES BASED ON TYPE OF CATALYST
- 20.1. Chapter Overview
- 20.2. Key Assumptions and Methodology
- 20.3. Revenue Shift Analysis
- 20.4. Market Movement Analysis
- 20.5. Penetration-Growth (P-G) Matrix
- 20.6. Artificial Photosynthesis Market for Biomimetic Catalyst: Historical Trends (Since 2020) and Forecasted Estimates (Till 2035)
- 20.7. Artificial Photosynthesis Market for Hydrogen Catalyst: Historical Trends (Since 2020) and Forecasted Estimates (Till 2035)
- 20.8. Artificial Photosynthesis Market for Molecular Catalyst: Historical Trends (Since 2020) and Forecasted Estimates (Till 2035)
- 20.9. Artificial Photosynthesis Market for Semiconductor Catalyst: Historical Trends (Since 2020) and Forecasted Estimates (Till 2035)
- 20.10. Artificial Photosynthesis Market for Water-Oxidizing Catalyst: Historical Trends (Since 2020) and Forecasted Estimates (Till 2035)
- 20.11. Data Triangulation and Validation
- 20.11.1. Secondary Sources
- 20.11.2. Primary Sources
- 20.11.3. Statistical Modeling
21. MARKET OPPORTUNITIES BASED ON TYPE OF APPLICATION
- 21.1. Chapter Overview
- 21.2. Key Assumptions and Methodology
- 21.3. Revenue Shift Analysis
- 21.4. Market Movement Analysis
- 21.5. Penetration-Growth (P-G) Matrix
- 21.6. Artificial Photosynthesis Market for Carbon Dioxide Utilization: Historical Trends (Since 2020) and Forecasted Estimates (Till 2035)
- 21.7. Artificial Photosynthesis Market for Chemicals Production: Historical Trends (Since 2020) and Forecasted Estimates (Till 2035)
- 21.8. Artificial Photosynthesis Market for Sustainable Fuel Production: Historical Trends (Since 2020) and Forecasted Estimates (Till 2035)
- 21.8.1. Artificial Photosynthesis Sustainable Fuel Production Market for Hydrocarbon: Historical Trends (Since 2020) and Forecasted Estimates (Till 2035)
- 21.8.2. Artificial Photosynthesis Sustainable Fuel Production Market for Hydrogen: Historical Trends (Since 2020) and Forecasted Estimates (Till 2035)
- 21.9. Artificial Photosynthesis Market for Water Purification: Historical Trends (Since 2020) and Forecasted Estimates (Till 2035)
- 21.10. Data Triangulation and Validation
- 21.10.1. Secondary Sources
- 21.10.2. Primary Sources
- 21.10.3. Statistical Modeling
22. MARKET OPPORTUNITIES BASED ON TYPE OF END USER
- 22.1. Chapter Overview
- 22.2. Key Assumptions and Methodology
- 22.3. Revenue Shift Analysis
- 22.4. Market Movement Analysis
- 22.5. Penetration-Growth (P-G) Matrix
- 22.6. Artificial Photosynthesis Market for Chemical Manufacturer: Historical Trends (Since 2020) and Forecasted Estimates (Till 2035)
- 22.7. Artificial Photosynthesis Market for Energy Power: Historical Trends (Since 2020) and Forecasted Estimates (Till 2035)
- 22.8. Artificial Photosynthesis Market for Others: Historical Trends (Since 2020) and Forecasted Estimates (Till 2035)
- 22.9. Data Triangulation and Validation
- 22.9.1. Secondary Sources
- 22.9.2. Primary Sources
- 22.9.3. Statistical Modeling
23. MARKET OPPORTUNITIES FOR ARTIFICIAL PHOTOSYNTHESIS IN NORTH AMERICA
- 23.1. Chapter Overview
- 23.2. Key Assumptions and Methodology
- 23.3. Revenue Shift Analysis
- 23.4. Market Movement Analysis
- 23.5. Penetration-Growth (P-G) Matrix
- 23.6. Artificial Photosynthesis Market in North America: Historical Trends (Since 2020) and Forecasted Estimates (Till 2035)
- 23.6.1. Artificial Photosynthesis Market in the US: Historical Trends (Since 2020) and Forecasted Estimates (Till 2035)
- 23.6.2. Artificial Photosynthesis Market in Canada: Historical Trends (Since 2020) and Forecasted Estimates (Till 2035)
- 23.7. Data Triangulation and Validation
24. MARKET OPPORTUNITIES FOR ARTIFICIAL PHOTOSYNTHESIS IN EUROPE
- 24.1. Chapter Overview
- 24.2. Key Assumptions and Methodology
- 24.3. Revenue Shift Analysis
- 24.4. Market Movement Analysis
- 24.5. Penetration-Growth (P-G) Matrix
- 24.6. Artificial Photosynthesis Market in Europe: Historical Trends (Since 2020) and Forecasted Estimates (Till 2035)
- 24.6.1. Artificial Photosynthesis Market in Austria: Historical Trends (Since 2020) and Forecasted Estimates (Till 2035)
- 24.6.2. Artificial Photosynthesis Market in Belgium: Historical Trends (Since 2020) and Forecasted Estimates (Till 2035)
- 24.6.3. Artificial Photosynthesis Market in Denmark: Historical Trends (Since 2020) and Forecasted Estimates (Till 2035)
- 24.6.4. Artificial Photosynthesis Market in France: Historical Trends (Since 2020) and Forecasted Estimates (Till 2035)
- 24.6.5. Artificial Photosynthesis Market in Germany: Historical Trends (Since 2020) and Forecasted Estimates (Till 2035)
- 24.6.6. Artificial Photosynthesis Market in Ireland: Historical Trends (Since 2020) and Forecasted Estimates (Till 2035)
- 24.6.7. Artificial Photosynthesis Market in Italy: Historical Trends (Since 2020) and Forecasted Estimates (Till 2035)
- 24.6.8. Artificial Photosynthesis Market in Netherlands: Historical Trends (Since 2020) and Forecasted Estimates (Till 2035)
- 24.6.9. Artificial Photosynthesis Market in Norway: Historical Trends (Since 2020) and Forecasted Estimates (Till 2035)
- 24.6.10. Artificial Photosynthesis Market in Russia: Historical Trends (Since 2020) and Forecasted Estimates (Till 2035)
- 24.6.11. Artificial Photosynthesis Market in Spain: Historical Trends (Since 2020) and Forecasted Estimates (Till 2035)
- 24.6.12. Artificial Photosynthesis Market in Sweden: Historical Trends (Since 2020) and Forecasted Estimates (Till 2035)
- 24.6.13. Artificial Photosynthesis Market in Switzerland: Historical Trends (Since 2020) and Forecasted Estimates (Till 2035)
- 24.6.14. Artificial Photosynthesis Market in the UK: Historical Trends (Since 2020) and Forecasted Estimates (Till 2035)
- 24.6.15. Artificial Photosynthesis Market in Rest of Europe: Historical Trends (Since 2020) and Forecasted Estimates (Till 2035)
- 24.7. Data Triangulation and Validation
25. MARKET OPPORTUNITIES FOR ARTIFICIAL PHOTOSYNTHESIS IN ASIA-PACIFIC
- 25.1. Chapter Overview
- 25.2. Key Assumptions and Methodology
- 25.3. Revenue Shift Analysis
- 25.4. Market Movement Analysis
- 25.5. Penetration-Growth (P-G) Matrix
- 25.6. Artificial Photosynthesis Market in Asia-Pacific: Historical Trends (Since 2020) and Forecasted Estimates (Till 2035)
- 25.6.1. Artificial Photosynthesis Market in Australia: Historical Trends (Since 2020) and Forecasted Estimates (Till 2035)
- 25.6.2. Artificial Photosynthesis Market in China: Historical Trends (Since 2020) and Forecasted Estimates (Till 2035)
- 25.6.3. Artificial Photosynthesis Market in India: Historical Trends (Since 2020) and Forecasted Estimates (Till 2035)
- 25.6.4. Artificial Photosynthesis Market in Japan: Historical Trends (Since 2020) and Forecasted Estimates (Till 2035)
- 25.6.5. Artificial Photosynthesis Market in New Zealand: Historical Trends (Since 2020) and Forecasted Estimates (Till 2035)
- 25.6.6. Artificial Photosynthesis Market in Singapore: Historical Trends (Since 2020) and Forecasted Estimates (Till 2035)
- 25.6.7. Artificial Photosynthesis Market in South Korea: Historical Trends (Since 2020) and Forecasted Estimates (Till 2035)
- 25.6.8. Artificial Photosynthesis Market in Rest of Asia Pacific: Historical Trends (Since 2020) and Forecasted Estimates (Till 2035)
- 25.7. Data Triangulation and Validation
26. MARKET OPPORTUNITIES FOR ARTIFICIAL PHOTOSYNTHESIS IN LATIN AMERICA
- 26.1. Chapter Overview
- 26.2. Key Assumptions and Methodology
- 26.3. Revenue Shift Analysis
- 26.4. Market Movement Analysis
- 26.5. Penetration-Growth (P-G) Matrix
- 26.6. Artificial Photosynthesis Market in Latin America: Historical Trends (Since 2020) and Forecasted Estimates (Till 2035)
- 26.6.1. Artificial Photosynthesis Market in Argentina: Historical Trends (Since 2020) and Forecasted Estimates (Till 2035)
- 26.6.2. Artificial Photosynthesis Market in Brazil: Historical Trends (Since 2020) and Forecasted Estimates (Till 2035)
- 26.6.3. Artificial Photosynthesis Market in Chile: Historical Trends (Since 2020) and Forecasted Estimates (Till 2035)
- 26.6.4. Artificial Photosynthesis Market in Colombia Historical Trends (Since 2020) and Forecasted Estimates (Till 2035)
- 26.6.5. Artificial Photosynthesis Market in Venezuela: Historical Trends (Since 2020) and Forecasted Estimates (Till 2035)
- 26.6.6. Artificial Photosynthesis Market in Rest of Latin America: Historical Trends (Since 2020) and Forecasted Estimates (Till 2035)
- 26.7. Data Triangulation and Validation
27. MARKET OPPORTUNITIES FOR ARTIFICIAL PHOTOSYNTHESIS IN THE MIDDLE EAST AND AFRICA (MEA)
- 27.1. Chapter Overview
- 27.2. Key Assumptions and Methodology
- 27.3. Revenue Shift Analysis
- 27.4. Market Movement Analysis
- 27.5. Penetration-Growth (P-G) Matrix
- 27.6. Artificial Photosynthesis Market in Middle East and Africa (MEA): Historical Trends (Since 2020) and Forecasted Estimates (Till 2035)
- 27.6.1. Artificial Photosynthesis Market in Australia: Historical Trends (Since 2020) and Forecasted Estimates (Till 205)
- 27.6.2. Artificial Photosynthesis Market in Egypt: Historical Trends (Since 2020) and Forecasted Estimates (Till 205)
- 27.6.3. Artificial Photosynthesis Market in Iran: Historical Trends (Since 2020) and Forecasted Estimates (Till 2035)
- 27.6.4. Artificial Photosynthesis Market in Iraq: Historical Trends (Since 2020) and Forecasted Estimates (Till 2035)
- 27.6.5. Artificial Photosynthesis Market in Israel: Historical Trends (Since 2020) and Forecasted Estimates (Till 2035)
- 27.6.6. Artificial Photosynthesis Market in Kuwait: Historical Trends (Since 2020) and Forecasted Estimates (Till 2035)
- 27.6.7. Artificial Photosynthesis Market in New Zealand: Historical Trends (Since 2020) and Forecasted Estimates (Till 205)
- 27.6.8. Artificial Photosynthesis Market in Saudi Arabia: Historical Trends (Since 2020) and Forecasted Estimates (Till 2035)
- 27.6.9. Artificial Photosynthesis Market in United Arab Emirates (UAE): Historical Trends (Since 2020) and Forecasted Estimates (Till 2035)
- 27.6.10. Artificial Photosynthesis Market in Rest of MEA: Historical Trends (Since 2020) and Forecasted Estimates (Till 2035)
- 27.7. Data Triangulation and Validation
28. MARKET CONCENTRATION ANALYSIS: DISTRIBUTION BY LEADING PLAYERS
- 28.1. Leading Player 1
- 28.2. Leading Player 2
- 28.3. Leading Player 3
- 28.4. Leading Player 4
- 28.5. Leading Player 5
- 28.6. Leading Player 6
- 28.7. Leading Player 7
- 28.8. Leading Player 8
29. ADJACENT MARKET ANALYSIS
30. KEY WINNING STRATEGIES
31. PORTER'S FIVE FORCES ANALYSIS
32. SWOT ANALYSIS
33. VALUE CHAIN ANALYSIS
34. ROOTS STRATEGIC RECOMMENDATIONS
- 34.1. Chapter Overview
- 34.2. Key Business-related Strategies
- 34.2.1. Research & Development
- 34.2.2. Product Manufacturing
- 34.2.3. Commercialization / Go-to-Market
- 34.2.4. Sales and Marketing
- 34.3. Key Operations-related Strategies
- 34.3.1. Risk Management
- 34.3.2. Workforce
- 34.3.3. Finance
- 34.3.4. Others
35. INSIGHTS FROM PRIMARY RESEARCH
36. REPORT CONCLUSION
37. TABULATED DATA
38. LIST OF COMPANIES AND ORGANIZATIONS
 全球人工光合作用市場規模、佔有率、趨勢和成長分析報告(2026-2034年)
 人工光合作用市場按技術類型、應用、最終用戶、催化劑材料、反應器類型和運作模式分類-全球預測,2025-2032年
 2032年人工光合作用催化劑市場預測:按催化劑類型、技術、應用、最終用戶和地區的全球分析
 全球人工光合作用市場
 全球人工光合作用市場規模研究與預測,按應用(碳氫化合物、氫氣、化學品)按技術(共電解、光電催化、奈米技術、混合製程)分類,以及 2025 年至 2035 年區域預測
 人工光合作用市場規模、佔有率、趨勢分析報告:按技術、按應用、按地區、細分市場預測,2024-2030人工光合作用市場:2024-2034