


 |
市場調查報告書
商品編碼
1883292
太陽能汽車市場:產業趨勢及全球預測(至 2035 年)-依車輛類型、電池類型、電動車類型、太陽能板類型、公司類型和地區劃分Solar Vehicle Market, Till 2035: Distribution by Type of Vehicle, Type of Battery, Type of Electronic Vehicle, Type of Solar Panel, Type of Enterprise, and Geographical Regions: Industry Trends and Global Forecasts |
||||||
太陽能汽車市場概述
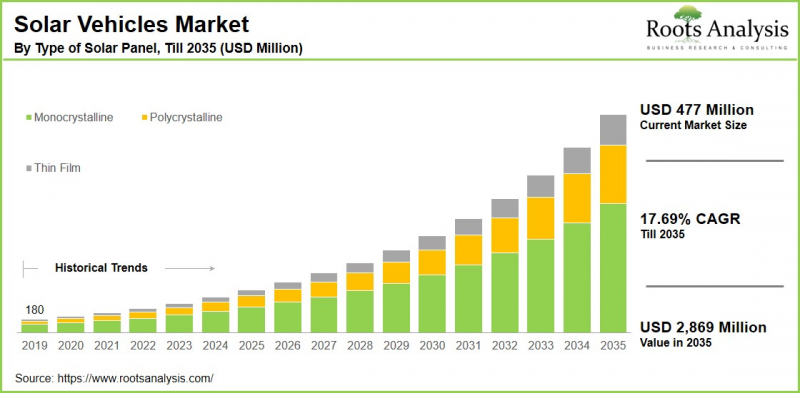
根據 Roots Analysis 的一項研究,全球太陽能汽車市場預計將從目前的 4.77 億美元增長到 2035 年的 28.69 億美元,預測期內(至 2035 年)的複合年增長率 (CAGR) 為 17.69%。
太陽能汽車市場機會可區隔為以下幾個部分:
車輛類型
- 商用車輛
- 搭乘車
電池型
- 鉛酸電池
- 鋰離子電池
- 鎳鎘電池
- 其他
電動車類型
- 純電動車
- 油電混合車
太陽能板類型
- 單晶矽
- 多晶矽
- 薄膜太陽能板
公司類型
- 大型公司
- 中小企業
地理區域
- 北美洲
- 美國
- 加拿大
- 墨西哥
- 其他北美洲國家國家/地區
- 歐洲
- 奧地利
- 比利時
- 丹麥
- 法國
- 德國
- 愛爾蘭
- 義大利
- 荷蘭
- 挪威
- 俄羅斯
- 西班牙
- 瑞典
- 瑞士
- 英國
- 其他歐洲國家
- 亞洲
- 中國
- 印度
- 日本
- 新加坡
- 韓國
- 其他亞洲國家
- 拉丁美洲
- 巴西
- 智利
- 哥倫比亞
- 委內瑞拉
- 其他拉丁美洲國家
- 中東和北非非洲
- 埃及
- 伊朗
- 伊拉克
- 以色列
- 科威特
- 沙烏地阿拉伯
- 阿拉伯聯合大公國
- 其他中東和北非國家
- 世界其他地區
- 澳大利亞
- 紐西蘭
- 其他國家
太陽能汽車市場:成長與趨勢
一輛普通乘用車平均每年排放超過4.5噸二氧化碳。這項數據凸顯了太陽能汽車的重要性,而太陽能汽車則利用太陽能為電動馬達供電。太陽能汽車使用光伏電池(PV電池)將陽光轉化為電能。這些電能可以直接用於驅動車輛,也可以儲存在電池中。重要的是,太陽能汽車之所以受到青睞,是因為其輕質材料、高效能轉換系統以及對環境影響極小的特性。此外,對環保汽油動力汽車替代品的需求日益增長,也推動了太陽能汽車市場的成長趨勢。
旨在促進汽車產業永續發展的嚴格法規預計將在預測期內顯著推動太陽能汽車市場的成長。關鍵技術創新包括最大功率點追蹤 (MPPT) 電路的開發,該電路可優化太陽能電池板的能量輸出。此外,其他製造方面的進步包括電池性能的提升和混合動力技術。重要的是,與溫室氣體排放相關的日益增長的環境問題正促使各國政府和監管機構在確保道路安全的同時,推廣使用環保汽車。
太陽能汽車市場:主要區隔市場
依車輛類型劃分的市佔率
依車輛類型劃分,全球太陽能車市場分為商用車和乘用車。據我們估計,乘用車區隔市場目前佔大部分市場佔有率。此外,預計該區隔市場在不久的將來將以更高的複合年增長率 (CAGR) 成長。這一增長與消費者環保意識的增強、太陽能技術的進步以及政府的利好政策密切相關。
以電池類型劃分的市佔率
依電池類型劃分,全球太陽能車市場可分為鉛酸電池、鋰離子電池、鎳鎘電池和其他電池。據我們估計,鋰離子電池目前佔了大部分市場佔有率。此外,預計該區隔市場在預測期內將以相對較高的複合年增長率成長。這一增長歸功於鋰離子電池優異的能量密度,使其能夠在緊湊的體積內實現大容量儲能,同時其長循環壽命也提供了長期的耐用性和成本效益。
以電動車類型劃分的市佔率
依電動車類型劃分,全球太陽能車市場可分為純電動車和混合動力電動車。據我們估計,混合動力太陽能車目前佔了大部分市場佔有率。此外,預計該區隔市場在預測期內將保持較高的複合年增長率 (CAGR)。這一增長主要得益於政府對太陽能汽車的激勵措施以及嚴格的排放法規,這些因素使得太陽能汽車更具成本效益。
以太陽能板類型劃分的市佔率
依太陽能板類型劃分,全球太陽能車市場可分為單晶矽、多晶矽及其他類型。據我們估計,單晶矽目前佔了大部分市場佔有率。這主要歸功於太陽能汽車的高能源效率,使其能夠在更小的空間內產生更多電力。
同時,多晶矽區隔市場預計在預測期內將以更快的速度成長。這主要得益於其價格優勢和易於製造,多晶矽電池板的成本通常比單晶矽電池板低約 20%。這使得多晶矽電池闆對尋求經濟實惠的太陽能解決方案的消費者和製造商都極具吸引力。
依公司規模劃分的市佔率
依公司規模劃分,全球太陽能汽車市場分為大型企業及中小企業。據我們估計,大型企業目前佔大部分市場佔有率。這一成長歸功於它們有能力投資太陽能汽車技術、利用豐富的資源、實現規模經濟並推動業務擴張。
依地區劃分的市佔率
依地理地區劃分,太陽能汽車市場分為北美、歐洲、亞洲、拉丁美洲、中東和北非以及世界其他地區。據我們估計,北美目前佔大部分市場佔有率。這得益於政府的大力支持、人們對太陽能汽車環境效益的認識不斷提高以及太陽能交通技術的顯著進步。
因此,預計亞洲在預測期內將實現最高的複合年增長率。推動這一增長的關鍵因素包括太陽能汽車充電基礎設施的快速發展以及消費者對永續交通解決方案日益增長的需求。
太陽能汽車市場代表性公司
- Aptera
- BMW
- 戴姆勒
- 菲亞特克萊斯勒
- 菲亞特克萊斯勒
- Fisker
- 福特
- 現代汽車
- Lightyear
- 馬恆達
- 日產
- Sono Motors
- 塔塔汽車
- 特斯拉
- 豐田
- 大眾
太陽能汽車市場:範圍
本報告在以下幾個部分對太陽能汽車市場進行了詳細分析:
- 市場規模與機會分析:對太陽能汽車市場的詳細分析。 本報告重點關注以下關鍵市場區隔:[A] 車輛類型,[B] 電池類型,[C] 電動車類型,[D] 太陽能板類型,[E] 公司類型,以及 [F] 地理區域。
- 競爭格局:基於多個相關參數對太陽能汽車市場中的公司進行全面分析,包括 [A] 成立年份,[B] 公司規模,[C] 總部所在地,以及 [D] 所有權結構。
- 公司簡介:詳細介紹參與太陽能汽車市場的主要公司,包括 [A] 總部所在地,[B] 公司規模,[C] 公司使命宣言,[D] 地理位置,[E] 管理團隊,[F] 聯繫方式,[G] 財務信息,[H] 業務板塊,[I] 產品組合,[J] 競爭優勢分析,以及未來 [K]。
- 宏觀趨勢:評估太陽能汽車產業目前的宏觀趨勢。
- 專利分析:深入分析太陽能汽車領域已申請和已獲授權的專利。相關參數包括[A]專利類型、[B]專利公開年份、[C]專利時間長度和[D]主要參與者。
- 近期發展:概述太陽能汽車市場近期發展情況,並基於相關參數進行分析,例如[A]舉措年份、[B]舉措類型、[C]地理分佈和[D]最活躍的參與者。
- 波特五力分析:分析太陽能汽車市場中存在的五種競爭力量(新進入者的威脅、買方的議價能力、供應商的議價能力、替代品的威脅以及現有競爭對手之間的競爭)。
- SWOT分析:一個深入的SWOT框架,突顯了該產業的優勢、劣勢、機會和威脅。它還提供了哈維鮑爾分析,突出了每個SWOT參數的相對影響。
- 價值鏈分析:對價值鏈進行全面分析,提供有關太陽能汽車市場各個階段和利害關係人的資訊。
目錄
第一部分:報告概述
第一章:引言
第二章:研究方法
第三章:市場動態
第四章:宏觀經濟指標
第二部分:質性分析
第五章:摘要整理
第六章:引言
第七章:監理環境
第三部分:市場概覽
第八章:主要加入企業整體性資料庫
第九章:競爭格局
第十章:空白市場分析
第十一章:競爭分析
第十二章:太陽能汽車市場的新創企業生態系
第四部分:公司簡介
第十三章:公司簡介
- 章節概述
- Aptera
- BMW
- 戴姆勒
- 菲亞特克萊斯勒
- 菲亞特在克萊斯勒
- 菲斯克
- 福特
- 現代汽車
- 光年
- 馬恆達與馬恆達
- 日產
- 索諾汽車
- 塔塔汽車
- 特斯拉
- 豐田
- 福斯汽車
第五部分:市場趨勢
第 14 章:大趨勢分析
第 15 章:未滿足的需求分析
第 16 章:專利分析
第 17 章:最新進展
第六節:市場機會分析
第18章:全球太陽能汽車市場
第19章:依車輛類型劃分的市場機會
第20章:以電池類型劃分的市場機會
第21章:以電動車類型劃分的市場機會
第22章:以太陽能板類型劃分的市場機會
第23章:依公司類型劃分的市場機會
第24章:北美太陽能車市場機會
第25章:歐洲太陽能汽車市場機會
第26章:亞洲太陽能車市場
第27章 中東和北非(MENA)太陽能汽車市場機會
第28章 拉丁美洲太陽能汽車市場機會
第29章 其他地區太陽能車市場機會
第30章 市場集中度分析:主要參與者的分佈
第31章 鄰近市場分析
第七部分:策略工具
第32章 關鍵制勝策略
第33章 波特五力分析
章節34. SWOT 分析
第 35 章 價值鏈分析
第 36 章 ROOTS 策略建議
第八部分:其他獨家見解
第 37 章:來自一手研究的見解
第 38 章:報告結論
第九部分:附錄
第 39 章:表格資料
第 40 章:公司與組織清單
第 41 章:客製化機會
第 42 章:ROOTS 訂閱服務
第 43 章:作者資訊
Solar Vehicle Market Overview
As per Roots Analysis, the global solar vehicle market size is estimated to grow from USD 477 million in the current year USD 2,869 million by 2035, at a CAGR of 17.69% during the forecast period, till 2035.
The opportunity for solar vehicle market has been distributed across the following segments:
Type of Vehicle
- Commercial Vehicles
- Passenger Vehicles
Type of Battery
- Lead Acid
- Lithium Ion
- Nickel Cadmium
- Others
Type of Electronic Vehicle
- Battery Electric Vehicle
- Hybrid Electric Vehicle
Type of Solar Panel
- Monocrystalline
- Polycrystalline
- Thin Film
Type of Enterprise
- Large
- Small and Medium Enterprise
Geographical Regions
- North America
- US
- Canada
- Mexico
- Other North American countries
- Europe
- Austria
- Belgium
- Denmark
- France
- Germany
- Ireland
- Italy
- Netherlands
- Norway
- Russia
- Spain
- Sweden
- Switzerland
- UK
- Other European countries
- Asia
- China
- India
- Japan
- Singapore
- South Korea
- Other Asian countries
- Latin America
- Brazil
- Chile
- Colombia
- Venezuela
- Other Latin American countries
- Middle East and North Africa
- Egypt
- Iran
- Iraq
- Israel
- Kuwait
- Saudi Arabia
- UAE
- Other MENA countries
- Rest of the World
- Australia
- New Zealand
- Other countries
Solar Vehicle Market: Growth and Trends
On average, a standard passenger vehicle produces over 4.5 metric tons of carbon dioxide annually. This statistic highlights the importance of solar vehicles, which utilize sunlight to drive electric motors. Solar cars operate using photovoltaic (PV) cells that transform sunlight into electricity, either for immediate use in powering the vehicle or for storage in batteries. It is important to note that solar vehicles are preferred for their advancements in lightweight materials, effective energy conversion systems, and their capacity to function with minimal environmental impact. Moreover, the growth trend in the solar vehicle market is driven by increasing demand for eco-friendly alternatives to gasoline-powered cars.
The solar vehicle market is anticipated to grow substantially over the forecast period, due to strict regulations aimed at promoting sustainability within the automotive sector. A significant innovation is the development of maximum power point tracking (MPPT) circuits, which have optimized energy production from solar panels. Additionally, other advancements in manufacturing encompass enhanced battery performance and hybrid-electric technology. Importantly, rising environmental concerns related to greenhouse gas emissions have prompted authorities and regulatory organizations in various countries to promote the use of eco-friendly vehicles while ensuring road safety.
Solar Vehicle Market: Key Segments
Market Share by Type of Vehicle
Based on type of vehicle, the global solar vehicle market is segmented into commercial vehicles and passenger vehicles. According to our estimates, currently, the passenger vehicles segment captures the majority of the market share. Additionally, this segment is expected to expand at a notably higher CAGR in the near future. This growth can be linked to increasing consumer awareness regarding environmental concerns, advancements in solar technology, and favorable government initiatives.
Market Share by Type of Battery
Based on type of battery, the global solar vehicle market is segmented into lead acid, lithium ion, nickel cadmium and others. According to our estimates, currently, the lithium-ion segment captures the majority of the market share. Additionally, this segment is projected to experience a relatively higher CAGR during the forecast period. This growth can be linked to their superior energy density, enabling more energy storage in a compact size, along with their extended cycle life, ensuring long-term durability and cost-effectiveness.
Market Share by Type of Electronic Vehicle
Based on type of electronic vehicle, the global solar vehicle market is segmented into battery electric vehicle and hybrid electric vehicle. According to our estimates, currently, the hybrid solar vehicle segment captures the majority of the market share. Additionally, this segment is expected to experience a comparatively higher compound annual growth rate during the forecast period. This growth is driven by government incentives for solar vehicles and strict emission regulations that improve their cost-effectiveness.
Market Share by Type of Solar Panel
Based on type of solar panel, the global solar vehicle market is segmented into monocrystalline, polycrystalline and others. According to our estimates, currently, the monocrystalline segment captures the majority of the market share. This is due to the high energy efficiency in solar cars, enabling more electricity generation in smaller spaces.
Conversely, the polycrystalline segment is expected to experience a faster growth rate during the forecast period. This can be attributed to their affordability and ease of manufacturing, as polycrystalline panels are generally about 20% cheaper, making them an appealing choice for both consumers and manufacturers looking for cost-effective solar options.
Market Share by Type of Enterprise
Based on type of enterprise, the global solar vehicle market is segmented into large and small and medium enterprise. According to our estimates, currently, the large enterprise segment captures the majority of the market share. This growth can be attributed to their ability to invest in solar vehicle technologies, take advantage of considerable resources, achieve economies of scale, and promote business expansion.
Market Share by Geographical Regions
Based on geographical regions, the solar vehicle market is segmented into North America, Europe, Asia, Latin America, Middle East and North Africa, and the rest of the world. According to our estimates, currently North America captures the majority share of the market, owing to strong governmental backing, growing awareness of the environmental advantages of solar vehicles, and notable advancements in solar technology for transportation.
Consequently, Asia is projected to experience the highest compound annual growth rate (CAGR) during the forecast period. Key factors driving this growth include the rapid development of solar vehicle charging infrastructure and an increasing consumer demand for sustainable transportation solutions.
Example Players in Solar Vehicle Market
- Aptera
- BMW
- Daimler
- Fiat Chrysler
- Fiat Chrysler
- Fisker
- Ford
- Hyundai Motor
- Lightyear
- Mahindra & Mahindra
- Nissan
- Sono Motors
- Tata Motors
- Tesla
- Toyota
- Volkswagen
Solar Vehicle Market: Research Coverage
The report on the solar vehicle market features insights on various sections, including:
- Market Sizing and Opportunity Analysis: An in-depth analysis of the solar vehicle market, focusing on key market segments, including [A] type of vehicle, [B] type of battery, [C] type of electronic vehicle, [D] type of solar panel, [E] type of enterprise, and [F] geographical regions.
- Competitive Landscape: A comprehensive analysis of the companies engaged in the solar vehicle market, based on several relevant parameters, such as [A] year of establishment, [B] company size, [C] location of headquarters and [D] ownership structure.
- Company Profiles: Elaborate profiles of prominent players engaged in the solar vehicle market, providing details on [A] location of headquarters, [B] company size, [C] company mission, [D] company footprint, [E] management team, [F] contact details, [G] financial information, [H] operating business segments, [I] portfolio, [J] moat analysis, [K] recent developments, and an informed future outlook.
- Megatrends: An evaluation of ongoing megatrends in the solar vehicle industry.
- Patent Analysis: An insightful analysis of patents filed / granted in the solar vehicle domain, based on relevant parameters, including [A] type of patent, [B] patent publication year, [C] patent age and [D] leading players.
- Recent Developments: An overview of the recent developments made in the solar vehicle market, along with analysis based on relevant parameters, including [A] year of initiative, [B] type of initiative, [C] geographical distribution and [D] most active players.
- Porter's Five Forces Analysis: An analysis of five competitive forces prevailing in the solar vehicle market, including threats of new entrants, bargaining power of buyers, bargaining power of suppliers, threats of substitute products and rivalry among existing competitors.
- SWOT Analysis: An insightful SWOT framework, highlighting the strengths, weaknesses, opportunities and threats in the domain. Additionally, it provides Harvey ball analysis, highlighting the relative impact of each SWOT parameter.
- Value Chain Analysis: A comprehensive analysis of the value chain, providing information on the different phases and stakeholders involved in the solar vehicle market.
Key Questions Answered in this Report
- How many companies are currently engaged in solar vehicle market?
- Which are the leading companies in this market?
- What factors are likely to influence the evolution of this market?
- What is the current and future market size?
- What is the CAGR of this market?
- How is the current and future market opportunity likely to be distributed across key market segments?
Reasons to Buy this Report
- The report provides a comprehensive market analysis, offering detailed revenue projections of the overall market and its specific sub-segments. This information is valuable to both established market leaders and emerging entrants.
- Stakeholders can leverage the report to gain a deeper understanding of the competitive dynamics within the market. By analyzing the competitive landscape, businesses can make informed decisions to optimize their market positioning and develop effective go-to-market strategies.
- The report offers stakeholders a comprehensive overview of the market, including key drivers, barriers, opportunities, and challenges. This information empowers stakeholders to stay abreast of market trends and make data-driven decisions to capitalize on growth prospects.
Additional Benefits
- Complimentary Excel Data Packs for all Analytical Modules in the Report
- 15% Free Content Customization
- Detailed Report Walkthrough Session with Research Team
- Free Updated report if the report is 6-12 months old or older
TABLE OF CONTENTS
SECTION I: REPORT OVERVIEW
1. PREFACE
- 1.1. Introduction
- 1.2. Market Share Insights
- 1.3. Key Market Insights
- 1.4. Report Coverage
- 1.5. Key Questions Answered
- 1.6. Chapter Outlines
2. RESEARCH METHODOLOGY
- 2.1. Chapter Overview
- 2.2. Research Assumptions
- 2.3. Database Building
- 2.3.1. Data Collection
- 2.3.2. Data Validation
- 2.3.3. Data Analysis
- 2.4. Project Methodology
- 2.4.1. Secondary Research
- 2.4.1.1. Annual Reports
- 2.4.1.2. Academic Research Papers
- 2.4.1.3. Company Websites
- 2.4.1.4. Investor Presentations
- 2.4.1.5. Regulatory Filings
- 2.4.1.6. White Papers
- 2.4.1.7. Industry Publications
- 2.4.1.8. Conferences and Seminars
- 2.4.1.9. Government Portals
- 2.4.1.10. Media and Press Releases
- 2.4.1.11. Newsletters
- 2.4.1.12. Industry Databases
- 2.4.1.13. Roots Proprietary Databases
- 2.4.1.14. Paid Databases and Sources
- 2.4.1.15. Social Media Portals
- 2.4.1.16. Other Secondary Sources
- 2.4.2. Primary Research
- 2.4.2.1. Introduction
- 2.4.2.2. Types
- 2.4.2.2.1. Qualitative
- 2.4.2.2.2. Quantitative
- 2.4.2.3. Advantages
- 2.4.2.4. Techniques
- 2.4.2.4.1. Interviews
- 2.4.2.4.2. Surveys
- 2.4.2.4.3. Focus Groups
- 2.4.2.4.4. Observational Research
- 2.4.2.4.5. Social Media Interactions
- 2.4.2.5. Stakeholders
- 2.4.2.5.1. Company Executives (CXOs)
- 2.4.2.5.2. Board of Directors
- 2.4.2.5.3. Company Presidents and Vice Presidents
- 2.4.2.5.4. Key Opinion Leaders
- 2.4.2.5.5. Research and Development Heads
- 2.4.2.5.6. Technical Experts
- 2.4.2.5.7. Subject Matter Experts
- 2.4.2.5.8. Scientists
- 2.4.2.5.9. Doctors and Other Healthcare Providers
- 2.4.2.6. Ethics and Integrity
- 2.4.2.6.1. Research Ethics
- 2.4.2.6.2. Data Integrity
- 2.4.3. Analytical Tools and Databases
- 2.4.1. Secondary Research
3. MARKET DYNAMICS
- 3.1. Forecast Methodology
- 3.1.1. Top-Down Approach
- 3.1.2. Bottom-Up Approach
- 3.1.3. Hybrid Approach
- 3.2. Market Assessment Framework
- 3.2.1. Total Addressable Market (TAM)
- 3.2.2. Serviceable Addressable Market (SAM)
- 3.2.3. Serviceable Obtainable Market (SOM)
- 3.2.4. Currently Acquired Market (CAM)
- 3.3. Forecasting Tools and Techniques
- 3.3.1. Qualitative Forecasting
- 3.3.2. Correlation
- 3.3.3. Regression
- 3.3.4. Time Series Analysis
- 3.3.5. Extrapolation
- 3.3.6. Convergence
- 3.3.7. Forecast Error Analysis
- 3.3.8. Data Visualization
- 3.3.9. Scenario Planning
- 3.3.10. Sensitivity Analysis
- 3.4. Key Considerations
- 3.4.1. Demographics
- 3.4.2. Market Access
- 3.4.3. Reimbursement Scenarios
- 3.4.4. Industry Consolidation
- 3.5. Robust Quality Control
- 3.6. Key Market Segmentations
- 3.7. Limitations
4. MACRO-ECONOMIC INDICATORS
- 4.1. Chapter Overview
- 4.2. Market Dynamics
- 4.2.1. Time Period
- 4.2.1.1. Historical Trends
- 4.2.1.2. Current and Forecasted Estimates
- 4.2.2. Currency Coverage
- 4.2.2.1. Overview of Major Currencies Affecting the Market
- 4.2.2.2. Impact of Currency Fluctuations on the Industry
- 4.2.3. Foreign Exchange Impact
- 4.2.3.1. Evaluation of Foreign Exchange Rates and Their Impact on Market
- 4.2.3.2. Strategies for Mitigating Foreign Exchange Risk
- 4.2.4. Recession
- 4.2.4.1. Historical Analysis of Past Recessions and Lessons Learnt
- 4.2.4.2. Assessment of Current Economic Conditions and Potential Impact on the Market
- 4.2.5. Inflation
- 4.2.5.1. Measurement and Analysis of Inflationary Pressures in the Economy
- 4.2.5.2. Potential Impact of Inflation on the Market Evolution
- 4.2.6. Interest Rates
- 4.2.6.1. Overview of Interest Rates and Their Impact on the Market
- 4.2.6.2. Strategies for Managing Interest Rate Risk
- 4.2.7. Commodity Flow Analysis
- 4.2.7.1. Type of Commodity
- 4.2.7.2. Origins and Destinations
- 4.2.7.3. Values and Weights
- 4.2.7.4. Modes of Transportation
- 4.2.8. Global Trade Dynamics
- 4.2.8.1. Import Scenario
- 4.2.8.2. Export Scenario
- 4.2.9. War Impact Analysis
- 4.2.9.1. Russian-Ukraine War
- 4.2.9.2. Israel-Hamas War
- 4.2.10. COVID Impact / Related Factors
- 4.2.10.1. Global Economic Impact
- 4.2.10.2. Industry-specific Impact
- 4.2.10.3. Government Response and Stimulus Measures
- 4.2.10.4. Future Outlook and Adaptation Strategies
- 4.2.11. Other Indicators
- 4.2.11.1. Fiscal Policy
- 4.2.11.2. Consumer Spending
- 4.2.11.3. Gross Domestic Product (GDP)
- 4.2.11.4. Employment
- 4.2.11.5. Taxes
- 4.2.11.6. R&D Innovation
- 4.2.11.7. Stock Market Performance
- 4.2.11.8. Supply Chain
- 4.2.11.9. Cross-Border Dynamics
- 4.2.1. Time Period
SECTION II: QUALITATIVE INSIGHTS
5. EXECUTIVE SUMMARY
6. INTRODUCTION
- 6.1. Chapter Overview
- 6.2. Overview of Solar Vehicle Market
- 6.2.1. Type of Vehicle
- 6.2.2. Type of Battery
- 6.2.3. Type of Electronic Vehicle
- 6.2.4. Type of Solar Panel
- 6.2.5. Type of Enterprise
- 6.3. Future Perspective
7. REGULATORY SCENARIO
SECTION III: MARKET OVERVIEW
8. COMPREHENSIVE DATABASE OF LEADING PLAYERS
9. COMPETITIVE LANDSCAPE
- 9.1. Chapter Overview
- 9.2. Solar Vehicle: Overall Market Landscape
- 9.2.1. Analysis by Year of Establishment
- 9.2.2. Analysis by Company Size
- 9.2.3. Analysis by Location of Headquarters
- 9.2.4. Analysis by Ownership Structure
10. WHITE SPACE ANALYSIS
11. COMPANY COMPETITIVENESS ANALYSIS
12. STARTUP ECOSYSTEM IN THE SOLAR VEHICLE MARKET
- 12.1. Solar Vehicle Market: Market Landscape of Startups
- 12.1.1. Analysis by Year of Establishment
- 12.1.2. Analysis by Company Size
- 12.1.3. Analysis by Company Size and Year of Establishment
- 12.1.4. Analysis by Location of Headquarters
- 12.1.5. Analysis by Company Size and Location of Headquarters
- 12.1.6. Analysis by Ownership Structure
- 12.2. Key Findings
SECTION IV: COMPANY PROFILES
13. COMPANY PROFILES
- 13.1. Chapter Overview
- 13.2. Aptera*
- 13.2.1. Company Overview
- 13.2.2. Company Mission
- 13.2.3. Company Footprint
- 13.2.4. Management Team
- 13.2.5. Contact Details
- 13.2.6. Financial Performance
- 13.2.7. Operating Business Segments
- 13.2.8. Service / Product Portfolio (project specific)
- 13.2.9. MOAT Analysis
- 13.2.10. Recent Developments and Future Outlook
- 13.3. BMW
- 13.4. Daimler
- 13.5. Fiat Chrysler
- 13.6. Fiat Chrysler
- 13.7. Fisker
- 13.8. Ford
- 13.9. Hyundai Motor
- 13.10. Lightyear
- 13.11. Mahindra & Mahindra
- 13.12. Nissan
- 13.13. Sono Motors
- 13.14. Tata Motors
- 13.15. Tesla
- 13.16. Toyota
- 13.17. Volkswagen
SECTION V: MARKET TRENDS
14. MEGA TRENDS ANALYSIS
15. UNMET NEED ANALYSIS
16. PATENT ANALYSIS
17. RECENT DEVELOPMENTS
- 17.1. Chapter Overview
- 17.2. Recent Funding
- 17.3. Recent Partnerships
- 17.4. Other Recent Initiatives
SECTION VI: MARKET OPPORTUNITY ANALYSIS
18. GLOBAL SOLAR VEHICLE MARKET
- 18.1. Chapter Overview
- 18.2. Key Assumptions and Methodology
- 18.3. Trends Disruption Impacting Market
- 18.4. Demand Side Trends
- 18.5. Supply Side Trends
- 18.6. Global Solar Vehicle Market, Historical Trends (Since 2019) and Forecasted Estimates (Till 2035)
- 18.7. Multivariate Scenario Analysis
- 18.7.1. Conservative Scenario
- 18.7.2. Optimistic Scenario
- 18.8. Investment Feasibility Index
- 18.9. Key Market Segmentations
19. MARKET OPPORTUNITIES BASED ON TYPE OF VEHICLE
- 19.1. Chapter Overview
- 19.2. Key Assumptions and Methodology
- 19.3. Revenue Shift Analysis
- 19.4. Market Movement Analysis
- 19.5. Penetration-Growth (P-G) Matrix
- 19.6. Solar Vehicle Market for Commercial Vehicles: Historical Trends (Since 2019) and Forecasted Estimates (Till 2035)
- 19.7. Solar Vehicle Market for Passenger Vehicles: Historical Trends (Since 2019) and Forecasted Estimates (Till 2035)
- 19.8. Data Triangulation and Validation
- 19.8.1. Secondary Sources
- 19.8.2. Primary Sources
- 19.8.3. Statistical Modeling
20. MARKET OPPORTUNITIES BASED ON TYPE OF BATTERY
- 20.1. Chapter Overview
- 20.2. Key Assumptions and Methodology
- 20.3. Revenue Shift Analysis
- 20.4. Market Movement Analysis
- 20.5. Penetration-Growth (P-G) Matrix
- 20.6. Solar Vehicle Market for Lead Acid: Historical Trends (Since 2019) and Forecasted Estimates (Till 2035)
- 20.7. Solar Vehicle Market for Lithium Ion: Historical Trends (Since 2019) and Forecasted Estimates (Till 2035)
- 20.8. Solar Vehicle Market for Nickel Cadmium: Historical Trends (Since 2019) and Forecasted Estimates (Till 2035)
- 20.9. Solar Vehicle Market for Others: Historical Trends (Since 2019) and Forecasted Estimates (Till 2035)
- 20.10. Data Triangulation and Validation
- 20.10.1. Secondary Sources
- 20.10.2. Primary Sources
- 20.10.3. Statistical Modeling
21. MARKET OPPORTUNITIES BASED ON TYPE OF ELECTRONIC VEHICLE
- 21.1. Chapter Overview
- 21.2. Key Assumptions and Methodology
- 21.3. Revenue Shift Analysis
- 21.4. Market Movement Analysis
- 21.5. Penetration-Growth (P-G) Matrix
- 21.6. Solar Vehicle Market for Battery Electric Vehicle: Historical Trends (Since 2019) and Forecasted Estimates (Till 2035)
- 21.7. Solar Vehicle Market for Hybrid Electric Vehicle: Historical Trends (Since 2019) and Forecasted Estimates (Till 2035)
- 21.8. Data Triangulation and Validation
- 21.8.1. Secondary Sources
- 21.8.2. Primary Sources
- 21.8.3. Statistical Modeling
22. MARKET OPPORTUNITIES BASED ON TYPE OF SOLAR PANEL
- 22.1. Chapter Overview
- 22.2. Key Assumptions and Methodology
- 22.3. Revenue Shift Analysis
- 22.4. Market Movement Analysis
- 22.5. Penetration-Growth (P-G) Matrix
- 22.6. Solar Vehicle Market for Monocrystalline: Historical Trends (Since 2019) and Forecasted Estimates (Till 2035)
- 22.7. Solar Vehicle Market for Polycrystalline: Historical Trends (Since 2019) and Forecasted Estimates (Till 2035)
- 22.8. Solar Vehicle Market for Thin Film: Historical Trends (Since 2019) and Forecasted Estimates (Till 2035)
- 22.9. Data Triangulation and Validation
- 22.9.1. Secondary Sources
- 22.9.2. Primary Sources
- 22.9.3. Statistical Modeling
23. MARKET OPPORTUNITIES BASED ON TYPE OF ENTERPRISE
- 23.1. Chapter Overview
- 23.2. Key Assumptions and Methodology
- 23.3. Revenue Shift Analysis
- 23.4. Market Movement Analysis
- 23.5. Penetration-Growth (P-G) Matrix
- 23.6. Solar Vehicle Market for Large: Historical Trends (Since 2019) and Forecasted Estimates (Till 2035)
- 23.7. Solar Vehicle Market for Small and Medium Enterprise: Historical Trends (Since 2019) and Forecasted Estimates (Till 2035)
- 23.8. Data Triangulation and Validation
- 23.8.1. Secondary Sources
- 23.8.2. Primary Sources
- 23.8.3. Statistical Modeling
24. MARKET OPPORTUNITIES FOR SOLAR VEHICLE IN NORTH AMERICA
- 24.1. Chapter Overview
- 24.2. Key Assumptions and Methodology
- 24.3. Revenue Shift Analysis
- 24.4. Market Movement Analysis
- 24.5. Penetration-Growth (P-G) Matrix
- 24.6. Solar Vehicle Market in North America: Historical Trends (Since 2019) and Forecasted Estimates (Till 2035)
- 24.6.1. Solar Vehicle Market in the US: Historical Trends (Since 2019) and Forecasted Estimates (Till 2035)
- 24.6.2. Solar Vehicle Market in Canada: Historical Trends (Since 2019) and Forecasted Estimates (Till 2035)
- 24.6.3. Solar Vehicle Market in Mexico: Historical Trends (Since 2019) and Forecasted Estimates (Till 2035)
- 24.6.4. Solar Vehicle Market in Other North American Countries: Historical Trends (Since 2019) and Forecasted Estimates (Till 2035)
- 24.7. Data Triangulation and Validation
25. MARKET OPPORTUNITIES FOR SOLAR VEHICLE IN EUROPE
- 25.1. Chapter Overview
- 25.2. Key Assumptions and Methodology
- 25.3. Revenue Shift Analysis
- 25.4. Market Movement Analysis
- 25.5. Penetration-Growth (P-G) Matrix
- 25.6. Solar Vehicle Market in Europe: Historical Trends (Since 2019) and Forecasted Estimates (Till 2035)
- 25.6.1. Solar Vehicle Market in Austria: Historical Trends (Since 2019) and Forecasted Estimates (Till 2035)
- 25.6.2. Solar Vehicle Market in Belgium: Historical Trends (Since 2019) and Forecasted Estimates (Till 2035)
- 25.6.3. Solar Vehicle Market in Denmark: Historical Trends (Since 2019) and Forecasted Estimates (Till 2035)
- 25.6.4. Solar Vehicle Market in France: Historical Trends (Since 2019) and Forecasted Estimates (Till 2035)
- 25.6.5. Solar Vehicle Market in Germany: Historical Trends (Since 2019) and Forecasted Estimates (Till 2035)
- 25.6.6. Solar Vehicle Market in Ireland: Historical Trends (Since 2019) and Forecasted Estimates (Till 2035)
- 25.6.7. Solar Vehicle Market in Italy: Historical Trends (Since 2019) and Forecasted Estimates (Till 2035)
- 25.6.8. Solar Vehicle Market in Netherlands: Historical Trends (Since 2019) and Forecasted Estimates (Till 2035)
- 25.6.9. Solar Vehicle Market in Norway: Historical Trends (Since 2019) and Forecasted Estimates (Till 2035)
- 25.6.10. Solar Vehicle Market in Russia: Historical Trends (Since 2019) and Forecasted Estimates (Till 2035)
- 25.6.11. Solar Vehicle Market in Spain: Historical Trends (Since 2019) and Forecasted Estimates (Till 2035)
- 25.6.12. Solar Vehicle Market in Sweden: Historical Trends (Since 2019) and Forecasted Estimates (Till 2035)
- 25.6.13. Solar Vehicle Market in Switzerland: Historical Trends (Since 2019) and Forecasted Estimates (Till 2035)
- 25.6.14. Solar Vehicle Market in the UK: Historical Trends (Since 2019) and Forecasted Estimates (Till 2035)
- 25.6.15. Solar Vehicle Market in Other European Countries: Historical Trends (Since 2019) and Forecasted Estimates (Till 2035)
- 25.7. Data Triangulation and Validation
26. MARKET OPPORTUNITIES FOR SOLAR VEHICLE IN ASIA
- 26.1. Chapter Overview
- 26.2. Key Assumptions and Methodology
- 26.3. Revenue Shift Analysis
- 26.4. Market Movement Analysis
- 26.5. Penetration-Growth (P-G) Matrix
- 26.6. Solar Vehicle Market in Asia: Historical Trends (Since 2019) and Forecasted Estimates (Till 2035)
- 26.6.1. Solar Vehicle Market in China: Historical Trends (Since 2019) and Forecasted Estimates (Till 2035)
- 26.6.2. Solar Vehicle Market in India: Historical Trends (Since 2019) and Forecasted Estimates (Till 2035)
- 26.6.3. Solar Vehicle Market in Japan: Historical Trends (Since 2019) and Forecasted Estimates (Till 2035)
- 26.6.4. Solar Vehicle Market in Singapore: Historical Trends (Since 2019) and Forecasted Estimates (Till 2035)
- 26.6.5. Solar Vehicle Market in South Korea: Historical Trends (Since 2019) and Forecasted Estimates (Till 2035)
- 26.6.6. Solar Vehicle Market in Other Asian Countries: Historical Trends (Since 2019) and Forecasted Estimates (Till 2035)
- 26.7. Data Triangulation and Validation
27. MARKET OPPORTUNITIES FOR SOLAR VEHICLE IN MIDDLE EAST AND NORTH AFRICA (MENA)
- 27.1. Chapter Overview
- 27.2. Key Assumptions and Methodology
- 27.3. Revenue Shift Analysis
- 27.4. Market Movement Analysis
- 27.5. Penetration-Growth (P-G) Matrix
- 27.6. Solar Vehicle Market in Middle East and North Africa (MENA): Historical Trends (Since 2019) and Forecasted Estimates (Till 2035)
- 27.6.1. Solar Vehicle Market in Egypt: Historical Trends (Since 2019) and Forecasted Estimates (Till 205)
- 27.6.2. Solar Vehicle Market in Iran: Historical Trends (Since 2019) and Forecasted Estimates (Till 2035)
- 27.6.3. Solar Vehicle Market in Iraq: Historical Trends (Since 2019) and Forecasted Estimates (Till 2035)
- 27.6.4. Solar Vehicle Market in Israel: Historical Trends (Since 2019) and Forecasted Estimates (Till 2035)
- 27.6.5. Solar Vehicle Market in Kuwait: Historical Trends (Since 2019) and Forecasted Estimates (Till 2035)
- 27.6.6. Solar Vehicle Market in Saudi Arabia: Historical Trends (Since 2019) and Forecasted Estimates (Till 2035)
- 27.6.7. Solar Vehicle Market in United Arab Emirates (UAE): Historical Trends (Since 2019) and Forecasted Estimates (Till 2035)
- 27.6.8. Solar Vehicle Market in Other MENA Countries: Historical Trends (Since 2019) and Forecasted Estimates (Till 2035)
- 27.7. Data Triangulation and Validation
28. MARKET OPPORTUNITIES FOR SOLAR VEHICLE IN LATIN AMERICA
- 28.1. Chapter Overview
- 28.2. Key Assumptions and Methodology
- 28.3. Revenue Shift Analysis
- 28.4. Market Movement Analysis
- 28.5. Penetration-Growth (P-G) Matrix
- 28.6. Solar Vehicle Market in Latin America: Historical Trends (Since 2019) and Forecasted Estimates (Till 2035)
- 28.6.1. Solar Vehicle Market in Argentina: Historical Trends (Since 2019) and Forecasted Estimates (Till 2035)
- 28.6.2. Solar Vehicle Market in Brazil: Historical Trends (Since 2019) and Forecasted Estimates (Till 2035)
- 28.6.3. Solar Vehicle Market in Chile: Historical Trends (Since 2019) and Forecasted Estimates (Till 2035)
- 28.6.4. Solar Vehicle Market in Colombia Historical Trends (Since 2019) and Forecasted Estimates (Till 2035)
- 28.6.5. Solar Vehicle Market in Venezuela: Historical Trends (Since 2019) and Forecasted Estimates (Till 2035)
- 28.6.6. Solar Vehicle Market in Other Latin American Countries: Historical Trends (Since 2019) and Forecasted Estimates (Till 2035)
- 28.7. Data Triangulation and Validation
29. MARKET OPPORTUNITIES FOR SOLAR VEHICLE IN REST OF THE WORLD
- 29.1. Chapter Overview
- 29.2. Key Assumptions and Methodology
- 29.3. Revenue Shift Analysis
- 29.4. Market Movement Analysis
- 29.5. Penetration-Growth (P-G) Matrix
- 29.6. Solar Vehicle Market in Rest of the World: Historical Trends (Since 2019) and Forecasted Estimates (Till 2035)
- 29.6.1. Solar Vehicle Market in Australia: Historical Trends (Since 2019) and Forecasted Estimates (Till 2035)
- 29.6.2. Solar Vehicle Market in New Zealand: Historical Trends (Since 2019) and Forecasted Estimates (Till 2035)
- 29.6.3. Solar Vehicle Market in Other Countries
- 29.7. Data Triangulation and Validation
30. MARKET CONCENTRATION ANALYSIS: DISTRIBUTION BY LEADING PLAYERS
- 30.1. Leading Player 1
- 30.2. Leading Player 2
- 30.3. Leading Player 3
- 30.4. Leading Player 4
- 30.5. Leading Player 5
- 30.6. Leading Player 6
- 30.7. Leading Player 7
- 30.8. Leading Player 8
31. ADJACENT MARKET ANALYSIS
SECTION VII: STRATEGIC TOOLS
32. KEY WINNING STRATEGIES
33. PORTER'S FIVE FORCES ANALYSIS
34. SWOT ANALYSIS
35. VALUE CHAIN ANALYSIS
36. ROOTS STRATEGIC RECOMMENDATIONS
- 36.1. Chapter Overview
- 36.2. Key Business-related Strategies
- 36.2.1. Research & Development
- 36.2.2. Product Manufacturing
- 36.2.3. Commercialization / Go-to-Market
- 36.2.4. Sales and Marketing
- 36.3. Key Operations-related Strategies
- 36.3.1. Risk Management
- 36.3.2. Workforce
- 36.3.3. Finance
- 36.3.4. Others
SECTION VIII: OTHER EXCLUSIVE INSIGHTS
37. INSIGHTS FROM PRIMARY RESEARCH
38. REPORT CONCLUSION
SECTION IX: APPENDIX
39. TABULATED DATA
40. LIST OF COMPANIES AND ORGANIZATIONS
41. CUSTOMIZATION OPPORTUNITIES
42. ROOTS SUBSCRIPTION SERVICES
43. AUTHOR DETAILS
 太陽能汽車市場:2026-2032年全球市場預測(按車輛類型、續航里程、自動化程度和最終用戶分類)
 2026年全球太陽能汽車市場報告
 全球太陽能汽車市場規模、佔有率、趨勢和成長分析報告(2026-2034年)卡車和火車地磅市場:按地磅類型、技術、安裝類型、量程範圍、材質、最終用途行業和銷售管道分類 - 全球預測 2026-2032
 太陽能汽車市場規模、佔有率和成長分析(按車輛類型、電動車類型、電池類型、太陽能板類型、組件類型、充電類型和地區分類)—2026-2033年產業預測
 太陽能汽車市場-全球產業規模、佔有率、趨勢、機會和預測,按太陽能板、電池類型、動力系統、地區和競爭格局分類,2020-2030年預測
 全球太陽能汽車市場全球太陽能汽車市場
 2025 年至 2033 年太陽能汽車市場報告(按推進類型、車輛類型、電池類型、太陽能板類型、充電類型和地區分類)太陽能電梯市場-全球產業規模、佔有率、趨勢、機會和預測(按類型、載重量、應用、地區和競爭細分,2020-2030 年)