


 |
市場調查報告書
商品編碼
1851857
太陽能汽車:市場佔有率分析、行業趨勢、統計數據和成長預測(2025-2030 年)Solar Vehicle - Market Share Analysis, Industry Trends & Statistics, Growth Forecasts (2025 - 2030) |
||||||
※ 本網頁內容可能與最新版本有所差異。詳細情況請與我們聯繫。
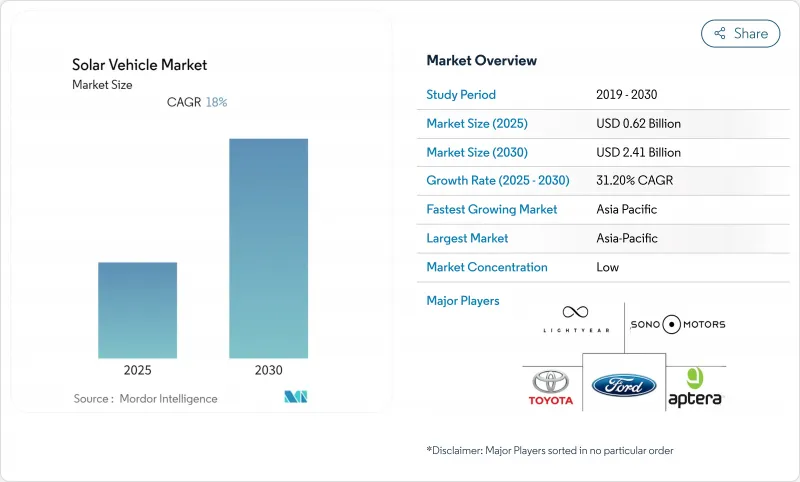
太陽能汽車市場預計在 2025 年創造 6.2 億美元的產值,並在 2030 年達到 24.1 億美元。
光電發電成本已大幅下降,目前在主要電動車市場已低於電網電價,使得車載太陽能系統在經濟上可行,再加上新興的固態電池,更是如此。歐盟的「Fit-For-55」計畫和加州的「先進清潔卡車」法規等零排放車輛強制令,正使早期採用者受益,並為原始設備製造商(OEM)提供穩定的訂單來源。隨著傳統汽車製造商加快推進太陽能車頂計劃,而專業製造商則不斷改進輕量化底盤以最大限度地增加光伏面板的安裝面積,市場競爭日益激烈。此外,雙向Vehicle-to-Grid模式的需求也在不斷成長,這種模式可以在用電高峰期將汽車和卡車轉變為行動電源。
全球太陽能汽車市場趨勢與洞察
在主要電動車市場,太陽能平準化度電成本低於電網電力成本
在電動車普及的關鍵地區,太陽能發電的平準化成本正逐漸接近市電平價,從根本上改變了車載太陽能發電系統的經濟效益。弗勞恩霍夫太陽能系統研究所 (Fraunhofer ISE) 2024 年的一項分析顯示,加州、德國和中國東部的太陽能+儲能系統目前的供電成本比傳統電網電價低 20% 至 30%。這項成本優勢為太陽能汽車車主帶來了極具吸引力的價值提案,他們既可以實現能源獨立,又能降低營運成本。隨著全球公用事業規模的太陽能發電裝置容量在 2025 年達到 1.8兆瓦,這一趨勢將加速發展,規模經濟效應將進一步降低成本。擁有大面積車頂的商用車輛可以產生足夠的電力來抵消其大部分能源消耗,使車隊營運商能夠從中受益。這種經濟優勢在電費高、太陽輻射充足的地區最為顯著,這些地區也因此成為太陽能汽車普及的熱點。
政府零排放車隊強制令推動商業性應用
主要汽車市場的法規結構正日益強制要求在商用車隊中引入零排放車輛,從而催生了對太陽能增強電動車的可預見需求。歐盟的「Fit For 55」計畫規定,到2025年,30%的新城市公車必須為零排放車輛,到2030年這一比例將提高到65%。加州的「先進清潔卡車」法規規定,到2030年,40%的卡車銷售必須為零排放車輛。這些法規尤其有利於商用太陽能車,因為更長的續航里程和對充電基礎設施更少的依賴性能夠帶來營運優勢。車隊營運商認知到,在最佳條件下,整合式太陽能可以將車輛的續航里程延長20-30%,從而減少充電頻率並提高路線靈活性。監管的推動力為開發太陽能商用車的製造商提供了先發優勢,因為飛機採購週期通常為五到七年,而儘早合規有利於簽訂長期合約。政府透過稅額扣抵和加速零排放商用車折舊計畫等獎勵,降低了零排放商用車的總擁有成本,進一步推動了零排放商用車的普及。
光電整合車身面板的高昂初始投資成本
車載整合式太陽能發電系統的製造成本仍遠高於傳統汽車零件,這構成了限制其大眾市場普及的價格障礙。專為汽車設計的專用太陽能電池需要客製化的製造程序,無法像固定式太陽能發電設備那樣實現規模經濟,導致其每瓦成本比標準太陽能組件高出三到四倍。整合的複雜性不僅限於太陽能電池本身,還包括專用線束、電源管理電子設備以及為容納太陽能組件而進行的結構改造,同時還要滿足碰撞安全標準。 Opes Solar Mobility公司位於德國的新工廠計劃於2024年投產,旨在實現車載太陽能組件的規模化生產。然而,與傳統汽車零件相比,其生產成本仍然很高。對於大眾市場汽車而言,成本溢價尤其具有挑戰性,因為價格敏感的製造商難以承受額外的零件成本。不過,光伏電池材料成本的下降和產量的增加表明,隨著市場的成熟和規模的擴大,成本障礙將會降低。
細分市場分析
到2024年,乘用車將佔據太陽能汽車市場98.78%的佔有率,而商用車將呈現最快的成長軌跡,2025年至2030年的複合年成長率將達到55.39%。卡車、巴士和送貨車輛的大面積車頂允許安裝更大的太陽能發電裝置,預計這將對能源消耗做出更顯著的貢獻。同時,可預測的行車路線模式也使車隊營運商能夠最佳化其太陽能充電策略。乘用車將受益於高階定位和能源自主品牌,尤其是在豪華車領域,消費者更重視環保差異化而非單純的經濟回報。
商用車的發展動能得益於車隊營運商對最佳化總擁有成本和遵守零排放規定的重視。 Flixbus 在其城際巴士上部署太陽能電池板,顯示私人營運商正在利用太陽能技術降低燃料成本並延長遠距線路的續航里程。集中維護能力和專業駕駛員也為車隊應用帶來益處,他們可以透過路線規劃和停車策略來最佳化太陽能充電。商用車領域的成長軌跡表明,車隊應用將推動生產規模的擴大和成本的降低,最終惠及乘用車應用。
到2024年,混合動力汽車將佔據太陽能汽車市場99.38%的佔有率,因為製造商將太陽能系統整合到現有的混合動力平台中,以最大限度地降低開發複雜性和監管風險。然而,隨著固體電池技術能夠更有效率地儲存和利用太陽能,純電動車的年複合成長率將達到60.83%(2025-2030年)。豐田計劃在四年內推出的固態電池藍圖預計將純電動車的續航里程提高一倍,同時降低20-40%的成本,從而為太陽能整合創造一個極具吸引力的平台。插電式混合動力車則佔據了中間位置,既具備太陽能充電功能,又能為從傳統動力傳動系統過渡的消費者提供靈活性。
向純電動車的轉變反映了這樣一個事實:儲能效率的提高和電池成本的下降使得純電動動力傳動系統在太陽能應用中更具可行性。 Stellantis與CEA在下一代電池技術方面的夥伴關係,展現了製造商如何致力於開發能夠最佳化太陽能利用的先進化學解決方案。不斷擴展的充電基礎設施也將促進這一轉變,從而緩解里程焦慮,並使太陽能汽車能夠作為電網充電的補充而非替代。隨著電池能量密度的提高和成本的下降,動力傳動系統得以簡化,能源管理系統也得到最佳化,這使得純電動車平台對太陽能整合越來越有吸引力。
區域分析
到2024年,亞太地區將佔據太陽能汽車市場最大佔有率,達到56.79%。這主要得益於中國光伏組件90%的全球產量以及日本在高效能電池研發的強大實力。中國的「中國製造2025」計畫和日本新能源產業技術綜合開發機構(NEDO)的補貼等政府項目,提升了本地零件採購優勢,降低了材料成本。比亞迪跨境日本市場的舉措,顯示中國有意將其製造業規模經濟效益拓展至高階出口市場。豐田和夏普正在聯合開發串聯電池,以保持國內競爭力。
北美是成長速度第二快的地區,這主要得益於加州的零排放政策以及《控制通貨膨脹法案》對國產太陽能產品的生產稅減免。皮卡和SUV在該地區佔據主導地位,為光伏陣列提供了大量的車頂空間。 Rivian正在其位於伊利諾州的工廠試點一項社區太陽能項目,將多餘的電力輸送到充電樁,展現了工廠到車隊循環利用的潛力。
在歐洲,各國獎勵五花八門,並由歐盟統一的「Fit-For-55」目標提供支持。儘管歐盟層級的監管具有確定性,但增值稅豁免和基礎設施密度各不相同,導致需求模式差異顯著。 Lightyear在獲得2024年1000萬歐元的投資後,轉型供應嵌入式光伏套件,這表明歐洲對整車生產的資本密集型模式以及模組化供應鏈的作用持開放態度。 Opes Solar Mobility在德國的工廠在一定程度上緩解了歐盟對亞洲組件製造商的依賴,支持了整車製造商的本地化戰略,從而降低了對地緣政治進口的依賴。
其他福利:
- Excel格式的市場預測(ME)表
- 3個月的分析師支持
目錄
第1章 引言
- 研究假設和市場定義
- 調查範圍
第2章調查方法
第3章執行摘要
第4章 市場情勢
- 市場概覽
- 市場促進因素
- 在主要電動車市場,太陽能光電發電的平準化電成本低於電網供電成本。
- 政府對零排放車輛的強制規定(例如,歐盟Fit-For-55標準、加州ACT標準)
- 面向車隊所有者的新型雙向V2G收入模式(報告不足)
- 整合式光伏面板可提高電池到車輪的效率
- 高階OEM品牌憑藉「能源自主」徽章獲得品牌優勢
- 固態電池領域一項鮮為人知的突破,使得超輕量太陽能底盤成為可能。
- 市場限制
- 光電整合車身面板的高昂初始投資成本
- 缺乏統一的道路合法太陽能屋頂認證標準
- 光伏複合材料的回收基礎設施有限。
- 間歇性功率輸出使標準化充電整合變得複雜。
- 監管環境
- 技術展望
- 波特五力模型
- 新進入者的威脅
- 買方/消費者的議價能力
- 供應商的議價能力
- 替代品的威脅
- 競爭對手之間的競爭
第5章 市場規模與成長預測
- 車輛類型
- 搭乘用車
- 商用車輛
- 電動驅動系統類型
- 電池電動車(BEV)
- 混合動力電動車(HEV)
- 插電式混合動力汽車(PHEV)
- 電池化學
- 鋰離子電池(NMC/LFP)
- 固體鋰金屬
- 鉛酸
- 太陽能板技術
- 單晶矽
- 多晶
- 薄膜(CIGS/鈣鈦礦)
- 充電架構
- 僅車載太陽能
- 太陽能+插電式混合動力充電
- 地區
- 北美洲
- 美國
- 加拿大
- 北美其他地區
- 南美洲
- 巴西
- 阿根廷
- 其他南美洲國家
- 歐洲
- 德國
- 英國
- 法國
- 西班牙
- 義大利
- 俄羅斯
- 其他歐洲地區
- 亞太地區
- 中國
- 日本
- 印度
- 韓國
- 亞太其他地區
- 中東和非洲
- 沙烏地阿拉伯
- 阿拉伯聯合大公國
- 埃及
- 土耳其
- 南非
- 其他中東和非洲地區
- 北美洲
第6章 競爭情勢
- 市場集中度
- 策略趨勢
- 市佔率分析
- 公司簡介
- Lightyear Technologies BV
- Sono Motors GmbH
- Toyota Motor Corporation
- Ford Motor Company
- Cruise Car Inc.
- Stellantis NV(incl. FCA brands)
- Tesla Inc.
- Hanergy Mobile Energy
- Venturi Automobiles
- Aptera Motors Corp.
- Squad Mobility
- Sunreef Yachts Eco-Cars Division
- Mitsubishi Motors Corporation
- Nissan Motor Co.
- EdisonFuture(SPI Energy)
第7章 市場機會與未來展望
The solar vehicle market generated USD 0.62 billion in 2025 and is on track to reach USD 2.41 billion by 2030, advancing at a 31.20% CAGR and underscoring the rapid transition from experimental prototypes to early-stage commercial fleets.
Declining photovoltaic (PV) costs, now below prevailing grid electricity prices in major electric-vehicle regions, combine with emerging solid-state batteries to make vehicle-integrated solar systems economically viable. Early adopters gain from zero-emission fleet mandates such as the EU Fit-For-55 package and California's Advanced Clean Trucks regulation, underpinning reliable order pipelines for OEMs. Competitive intensity rises as legacy automakers accelerate solar-roof programs while specialists refine lightweight chassis that maximize surface area for PV skins. Demand also reflects rising interest in bidirectional vehicle-to-grid models that transform cars and trucks into mobile power assets during peak electricity demand.
Global Solar Vehicle Market Trends and Insights
Declining Solar-PV LCOE Below Grid Electricity in Major EV Markets
Solar photovoltaic levelized cost of electricity has achieved grid parity across key electric vehicle adoption regions, fundamentally altering the economic calculus for vehicle-integrated solar systems. Fraunhofer ISE's 2024 analysis demonstrates that solar-plus-battery storage configurations now deliver electricity at costs 20-30% below conventional grid rates in California, Germany, and eastern China. This cost advantage creates a compelling value proposition for solar vehicle owners who can achieve energy independence while reducing operational expenses. The trend accelerates as utility-scale solar manufacturing capacity reaches 1.8 terawatts globally by 2025, driving further cost reductions through economies of scale. Fleet operators benefit from this dynamic, as commercial vehicles with larger roof surfaces can generate sufficient electricity to offset significant portions of their energy consumption. The economic advantage becomes more pronounced in regions with high electricity tariffs and abundant solar irradiation, creating geographic hotspots for solar vehicle adoption.
Government Zero-Emission Fleet Mandates Drive Commercial Adoption
Regulatory frameworks across major automotive markets increasingly mandate zero-emission vehicle adoption in commercial fleets, creating predictable demand for solar-enhanced electric vehicles. The EU's Fit-For-55 package requires 30% of new urban buses to be zero-emission by 2025, rising to 65% by 2030. California's Advanced Clean Trucks regulation mandates that 40% of truck sales be zero-emission by 2030. These mandates particularly favor solar vehicles in commercial applications where extended range and reduced charging infrastructure dependence provide operational advantages. Fleet operators recognize that solar integration can extend vehicle range by 20-30% under optimal conditions, reducing charging frequency and improving route flexibility. The regulatory momentum creates a first-mover advantage for manufacturers developing solar commercial vehicles, as fleet procurement cycles typically span 5-7 years and early compliance positions companies favorably for long-term contracts. Government incentives further amplify adoption by reducing total cost of ownership through tax credits and accelerated depreciation schedules for zero-emission commercial vehicles.
High Capital Cost of PV-Embedded Body Panels
Manufacturing costs for vehicle-integrated photovoltaic systems remain substantially higher than those of conventional automotive components, creating price barriers that limit mass market adoption. Specialized solar cells designed for automotive applications require custom manufacturing processes that lack the economies of scale achieved in stationary solar installations, resulting in costs 3-4 times higher per watt than standard photovoltaic modules. The integration complexity extends beyond solar cells, including specialized wiring harnesses, power management electronics, and structural modifications that accommodate photovoltaic components while maintaining crash safety standards. Opes Solar Mobility's new factory in Germany, which began production in 2024, represents efforts to achieve manufacturing scale for vehicle-specific photovoltaic modules. However, production costs remain elevated compared to conventional automotive components. The cost premium becomes particularly challenging for mass market vehicles where price sensitivity limits manufacturers' ability to absorb additional component expenses. However, declining photovoltaic material costs and increasing manufacturing volumes suggest that cost barriers will diminish as the market matures and achieves greater scale.
Other drivers and restraints analyzed in the detailed report include:
- Battery-to-Wheel Efficiency Gains From Integrated PV Skins
- Premium-Segment OEM Branding Advantages From Energy-Autonomous Positioning
- Lack of Unified Homologation Standards for Road-Legal PV Roofs
For complete list of drivers and restraints, kindly check the Table Of Contents.
Segment Analysis
Passenger cars commanded 98.78% of the solar vehicle market share in 2024, while commercial vehicles demonstrate the fastest growth trajectory at 55.39% CAGR (2025-2030), reflecting the superior economics of solar integration in fleet applications. Large roof surfaces on trucks, buses, and delivery vehicles enable more extensive photovoltaic installations that generate meaningful energy contributions. At the same time, predictable route patterns allow fleet operators to optimize solar charging strategies. Passenger cars benefit from premium positioning and energy-autonomous branding, particularly in luxury segments where consumers value environmental differentiation over pure economic returns.
The commercial vehicle momentum builds on fleet operators' focus on total cost of ownership optimization and regulatory compliance with zero-emission mandates. Flixbus's deployment of solar panels on intercity coaches demonstrates how commercial operators leverage solar technology to reduce fuel costs and extend electric range on long-distance routes. Fleet applications also benefit from centralized maintenance capabilities and professional drivers who can optimize solar charging through route planning and parking strategies. The commercial segment's growth trajectory suggests that fleet adoption will drive manufacturing scale and cost reductions that eventually benefit passenger car applications.
Hybrid electric vehicles captured 99.38% of the solar vehicle market share in 2024 as manufacturers initially integrated solar systems into existing hybrid platforms to minimize development complexity and regulatory risk. However, battery electric vehicles accelerate at 60.83% CAGR (2025-2030) as solid-state battery technology enables more efficient solar energy storage and utilization. Toyota's roadmap for solid-state batteries, expected to launch within four years, promises to double electric range while reducing costs by 20-40%, creating compelling platforms for solar integration. Plug-in hybrid electric vehicles occupy a middle position, offering flexibility for consumers transitioning from conventional powertrains while incorporating solar charging capabilities.
The shift toward battery electric vehicles reflects improving energy storage efficiency and declining battery costs that make pure electric powertrains more viable for solar applications. Stellantis's partnership with CEA on next-generation battery cell technology demonstrates how manufacturers pursue advanced chemistry solutions that optimize solar energy utilization. The transition also benefits from expanding charging infrastructure that reduces range anxiety and enables solar vehicles to supplement rather than replace grid charging. As battery energy density improves and costs decline, pure electric platforms become increasingly attractive for solar integration due to their simplified powertrains and optimized energy management systems.
The Solar Vehicle Market Report is Segmented by Vehicle Type (Passenger Cars and Commercial Vehicles), Electric-Drivetrain Type (BEV, HEV, and More), Battery Chemistry (Lithium-Ion, Solid-State Lithium-Metal, and More), Solar-Panel Technology (Monocrystalline Silicon, Thin-Film, and More), Charging Architecture (On-Board Solar-Only, and More), and Geography. The Market Forecasts are Provided in Terms of Value (USD).
Geography Analysis
Asia-Pacific accounted for the largest regional slice of the solar vehicle market, reaching 56.79% of the solar vehicle market in 2024 on the back of China's 90% global PV module output and Japan's deep R&D bench in high-efficiency cells. Government programs such as China's "Made in China 2025" and Japan's NEDO grants fuel local component sourcing advantages that compress bill-of-materials costs. BYD's cross-border push into Japan illustrates China's intent to extend manufacturing scale benefits into premium export markets. Toyota and Sharp co-develop tandem cells that maintain domestic competitive parity.
North America traced the second-fastest growth path due to California's zero-emission mandates and the Inflation Reduction Act's production tax credits for domestically manufactured solar cells. Pickup trucks and SUVs dominate the region's vehicle mix, presenting expansive roof real estate for PV arrays. Rivian is piloting community solar programs that feed excess electricity into chargers at its Illinois plant, illustrating potential factory-to-fleet circularity.
Europe offers a mosaic of national incentives underpinned by the EU-wide Fit-For-55 targets. While regulatory certainty exists at the bloc level, divergent VAT breaks and infrastructure density create a patchwork demand profile. Lightyear's pivot to supplying embedded PV kits after securing EUR 10 million in 2024 demonstrates the capital intensity of full-vehicle production and Europe's openness to modular supply-chain roles. Germany's Opes Solar Mobility facility partially derisks EU exposure to Asian module suppliers and supports OEM localization strategies to reduce geopolitical import dependencies.
- Lightyear Technologies B.V.
- Sono Motors GmbH
- Toyota Motor Corporation
- Ford Motor Company
- Cruise Car Inc.
- Stellantis N.V. (incl. FCA brands)
- Tesla Inc.
- Hanergy Mobile Energy
- Venturi Automobiles
- Aptera Motors Corp.
- Squad Mobility
- Sunreef Yachts Eco-Cars Division
- Mitsubishi Motors Corporation
- Nissan Motor Co.
- EdisonFuture (SPI Energy)
Additional Benefits:
- The market estimate (ME) sheet in Excel format
- 3 months of analyst support
TABLE OF CONTENTS
1 Introduction
- 1.1 Study Assumptions and Market Definition
- 1.2 Scope of the Study
2 Research Methodology
3 Executive Summary
4 Market Landscape
- 4.1 Market Overview
- 4.2 Market Drivers
- 4.2.1 Declining solar-PV LCOE below grid electricity in major EV markets
- 4.2.2 Government zero-emission fleet mandates (EU Fit-For-55, California ACT, etc.)
- 4.2.3 Emerging bidirectional V2G revenue models for fleet owners (under-reported)
- 4.2.4 Battery-to-wheel efficiency gains from integrated PV skins
- 4.2.5 Premium-segment OEM branding advantages from "energy-autonomous" badges
- 4.2.6 Solid-state battery breakthroughs enabling ultra-light solar chassis (under-reported)
- 4.3 Market Restraints
- 4.3.1 High capital cost of PV-embedded body panels
- 4.3.2 Lack of unified homologation standards for road-legal PV roofs
- 4.3.3 Limited Recycling Infrastructure for Composite PV-Integrated Materials
- 4.3.4 Intermittent Power Output Complicating Standardized Charging Integration
- 4.4 Regulatory Landscape
- 4.5 Technological Outlook
- 4.6 Porter's Five Forces
- 4.6.1 Threat of New Entrants
- 4.6.2 Bargaining Power of Buyers/Consumers
- 4.6.3 Bargaining Power of Suppliers
- 4.6.4 Threat of Substitute Products
- 4.6.5 Intensity of Competitive Rivalry
5 Market Size and Growth Forecasts (Value (USD))
- 5.1 Vehicle Type
- 5.1.1 Passenger Cars
- 5.1.2 Commercial Vehicles
- 5.2 Electric-Drivetrain Type
- 5.2.1 Battery Electric Vehicle (BEV)
- 5.2.2 Hybrid Electric Vehicle (HEV)
- 5.2.3 Plug-in Hybrid Electric Vehicle (PHEV)
- 5.3 Battery Chemistry
- 5.3.1 Lithium-ion (NMC/LFP)
- 5.3.2 Solid-state Lithium-metal
- 5.3.3 Lead Acid
- 5.4 Solar-Panel Technology
- 5.4.1 Monocrystalline Silicon
- 5.4.2 Polycrystalline Silicon
- 5.4.3 Thin-film (CIGS/perovskite)
- 5.5 Charging Architecture
- 5.5.1 On-board Solar-only
- 5.5.2 Solar + Plug-in Hybrid Charging
- 5.6 Geography
- 5.6.1 North America
- 5.6.1.1 United States
- 5.6.1.2 Canada
- 5.6.1.3 Rest of North America
- 5.6.2 South America
- 5.6.2.1 Brazil
- 5.6.2.2 Argentina
- 5.6.2.3 Rest of South America
- 5.6.3 Europe
- 5.6.3.1 Germany
- 5.6.3.2 United Kingdom
- 5.6.3.3 France
- 5.6.3.4 Spain
- 5.6.3.5 Italy
- 5.6.3.6 Russia
- 5.6.3.7 Rest of Europe
- 5.6.4 Asia-Pacific
- 5.6.4.1 China
- 5.6.4.2 Japan
- 5.6.4.3 India
- 5.6.4.4 South Korea
- 5.6.4.5 Rest of Asia-Pacific
- 5.6.5 Middle East and Africa
- 5.6.5.1 Saudi Arabia
- 5.6.5.2 United Arab Emirates
- 5.6.5.3 Egypt
- 5.6.5.4 Turkey
- 5.6.5.5 South Africa
- 5.6.5.6 Rest of Middle East and Africa
- 5.6.1 North America
6 Competitive Landscape
- 6.1 Market Concentration
- 6.2 Strategic Moves
- 6.3 Market Share Analysis
- 6.4 Company Profiles (includes Global level Overview, Market level overview, Core Segments, Financials as available, Strategic Information, Market Rank/Share for key companies, Products and Services, and Recent Developments)
- 6.4.1 Lightyear Technologies B.V.
- 6.4.2 Sono Motors GmbH
- 6.4.3 Toyota Motor Corporation
- 6.4.4 Ford Motor Company
- 6.4.5 Cruise Car Inc.
- 6.4.6 Stellantis N.V. (incl. FCA brands)
- 6.4.7 Tesla Inc.
- 6.4.8 Hanergy Mobile Energy
- 6.4.9 Venturi Automobiles
- 6.4.10 Aptera Motors Corp.
- 6.4.11 Squad Mobility
- 6.4.12 Sunreef Yachts Eco-Cars Division
- 6.4.13 Mitsubishi Motors Corporation
- 6.4.14 Nissan Motor Co.
- 6.4.15 EdisonFuture (SPI Energy)
7 Market Opportunities and Future Outlook
- 7.1 White-space and Unmet-Need Assessment
 太陽能汽車市場:2026-2032年全球市場預測(按車輛類型、續航里程、自動化程度和最終用戶分類)
 2026年全球太陽能汽車市場報告
 全球太陽能汽車市場規模、佔有率、趨勢和成長分析報告(2026-2034年)卡車和火車地磅市場:按地磅類型、技術、安裝類型、量程範圍、材質、最終用途行業和銷售管道分類 - 全球預測 2026-2032
 太陽能汽車市場規模、佔有率和成長分析(按車輛類型、電動車類型、電池類型、太陽能板類型、組件類型、充電類型和地區分類)—2026-2033年產業預測
 太陽能汽車市場:產業趨勢及全球預測(至 2035 年)-依車輛類型、電池類型、電動車類型、太陽能板類型、公司類型和地區劃分
 太陽能汽車市場-全球產業規模、佔有率、趨勢、機會和預測,按太陽能板、電池類型、動力系統、地區和競爭格局分類,2020-2030年預測
 全球太陽能汽車市場全球太陽能汽車市場
 2025 年至 2033 年太陽能汽車市場報告(按推進類型、車輛類型、電池類型、太陽能板類型、充電類型和地區分類)