


 |
市場調查報告書
商品編碼
1869577
器官晶片市場:產業趨勢及全球預測(至 2035 年)-依產品類型、器官類型、單一器官模型、結構材料、用途、應用、最終用戶及主要地區劃分Organs-on-Chips Market: Industry Trends and Global Forecasts, Till 2035 Distribution by Product, Organ, Single Organ based Model, Material of Construction, Purpose, Application Area, End User, Key Geographical Regions and Leading Players |
||||||
器官晶片市場:概述
根據 Roots Analysis 預測,全球器官晶片市場規模預計將從目前的 1 億美元增長至 2035 年的 9.44 億美元,複合年增長率 (CAGR) 為 25.2%(截至 2035 年)。
器官晶片市場機會可區隔為以下幾個部分:
產品類型
- 基於器官的晶片
- 基於疾病的晶片
器官類型
- 單一器官模型
- 多器官模型
單一器官模型
- 肝臟
- 肺
- 大腦
- 心臟
- 腸道
- 腎臟
- 其他
結構材料
- 聚二甲基矽氧烷
- 其他聚合物
- 玻璃
- 其他
應用
- 研究
- 治療
應用領域
- 藥物發現/毒性測試
- 癌症研究
- 幹細胞研究
- 組織工程/再生醫藥
- 其他
最終使用者
- 製藥和生技公司
- 學術和研究機構
- 化妝品產業利害關係人
- 其他
主要地區
- 北美
- 歐洲
- 亞太地區
- 拉丁美洲
- 中東和北非
主要公司
晶片器官市場:成長與趨勢
研究表明,每1000個候選藥物中只有1個能夠通過臨床前評估進入臨床試驗。其中,90%的藥物最終未能上市,主要原因是缺乏療效或在臨床試驗中觀察到意想不到的毒性,以及基於動物的臨床前模型存在局限性,由於難以重現複雜的人類生物學和機制,這些模型無法準確預測人體反應。因此,為了應對這些挑戰和局限性,減輕藥物失敗的醫療負擔,許多研究人員正致力於引入替代檢測方法,例如器官晶片技術。此外,為了加速創新藥物和個人化醫療的發現,我們需要能夠更精確地在體外模擬人體生物學和病理學的技術。器官晶片,也稱為微生理系統(MPS),是一種體外微流控裝置,其中包含模擬人體生理的活細胞,能夠詳細描繪細胞微環境和疾病的病理生理過程。這些晶片採用微加工技術構建,其內部包含裝有活細胞(持續灌注細胞培養基)的腔室,以模擬人體組織的物理化學微環境。
目前,市面上已有75種整合式器官晶片技術和模型,與傳統的細胞培養方法和動物實驗相比,它們具有明顯的優勢,包括能夠高精度地預測類似人類的生理反應、體內可重複性高、測試成本更低以及對動物模型的依賴性更低。
在過去幾年中,器官晶片市場經歷了穩步增長,這主要得益於對非動物實驗需求的不斷增長、監管政策的進步、投資和合作活動的增加以及微流控技術的進步。然而,一些因素可能會抑制市場成長。這些挑戰包括器官晶片在臨床前研究的應用有限、缺乏既定的方案和標準化,以及在長期和慢性研究中的適用性有限。此外,市場可能面臨一些挑戰,例如選擇最佳的建造材料、多器官整合的複雜性以及整合輔助設備以提高療效的影響。因此,為了克服這些挑戰,器官晶片供應商必須攜手合作,以實現製造流程的標準化。
市場成長和衰退受多種因素共同驅動。因此,評估行業內的風險和挑戰、監測應對挑戰的方法以及把握機遇,對於在該領域拓展業務的公司至關重要。此外,考慮到器官晶片領域持續不斷的創新和投資,以及新技術的日益普及,預計該市場未來將顯著增長。
器官晶片市場:關鍵洞察
本報告深入分析了器官晶片市場的現狀,並指出了該行業的潛在成長機會。主要發現包括:
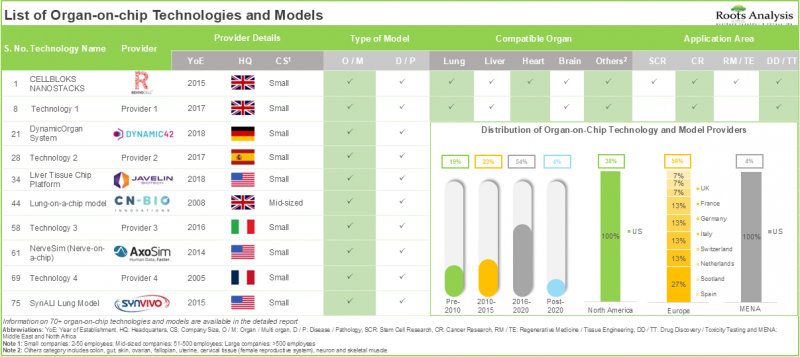
- 目前已有超過70種器官晶片技術和模型上市、核准或正在研發中。市場格局既包含成熟企業,也包含新興企業。
- 大多數技術和模型都適用於基於器官和疾病的應用。其中98%的技術/模型主要用於藥物研發和毒理學測試研究。
- 目前,共有25家公司(包括成熟企業和新創公司)聲稱提供器官晶片和微流控晶片。這些公司中超過60%成立於2013年之後。
- 超過50%的器官晶片產品是微流控晶片。 有趣的是,由於聚合物具有柔韌性和可塑性,這些晶片和板材大多由聚合物製成。
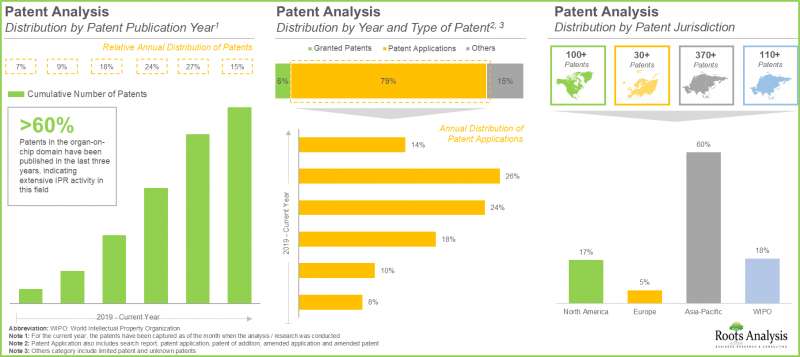
- 工業界和非工業界的利害關係人已申請並獲得 600 多項與器官晶片相關的專利,這表明該領域的智慧財產權正在成長。
- 利害關係人日益增長的興趣也反映在合作活動的增加上。技術和產品准入協議已成為器官晶片供應商最常用的合作模式。
- 近 350 項資助已授予用於器官晶片產品和技術的持續研發活動,其中金額最大的資助來自美國國家轉化科學促進中心。
- 自 2017 年以來,多家投資者已在多輪融資中投入超過 3.5 億美元,為這一新興領域帶來了豐厚的成長機會。
- 近年來,為了滿足日益增長的器官晶片需求,各利益相關方已建立起強大的品牌地位,多家公司推出了高效、易用且先進的產品。
- 對無動物實驗的需求不斷增長以及微流控技術的進步已成為推動器官晶片市場快速發展的關鍵因素。
- 預計未來十年,器官晶片市場將成長 25.2%,因為器官晶片提供了無動物實驗模型,並顯著降低了藥物測試的相關成本。
晶片器官市場:主要區隔市場
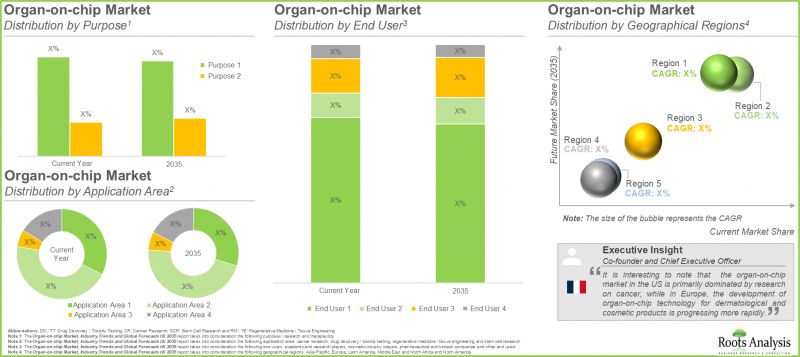
依產品類型劃分,全球晶片器官市場分為基於器官的模型和基於疾病的模型。目前,基於器官的模型佔晶片器官市場的大部分佔有率。值得注意的是,未來幾年,基於疾病的模型區隔市場預計將以更高的複合年增長率(約 27%)成長。
依器官類型劃分,全球晶片器官市場分為單一器官模型與多重器官模型。雖然支援單一器官模型的晶片器官產品佔了大部分市場佔有率,但值得注意的是,多器官模型的晶片器官市場預計在預測期內將以相對較高的複合年增長率增長。這是因為多器官模型能夠有效追蹤代謝途徑。
依單一器官模型劃分,全球市場可分為肝臟、肺臟、大腦、心臟、腸道、腎臟和其他器官模型。目前,肝臟晶片模型佔市場主導地位,預計將推動整體成長。值得注意的是,肺臟、大腦和心臟晶片模型在預測期內也可能成長。這主要歸功於它們能夠精確且精細地模擬人體生物機制。
依材料類型劃分,全球市場規模可分為聚二甲基矽氧烷 (PDMS)、其他聚合物、玻璃和其他材料。特別是,由於其高柔韌性、透明度和透氣性,PDMS 預計將在預測期內主導器官晶片市場。
預計在預測期內,治療性器官晶片市場將以較高的複合年增長率成長。
依應用領域劃分,全球器官晶片市場分為研究應用與治療應用。目前,專注於研究應用的器官晶片佔了整體市場的大部分佔有率。然而,隨著這些晶片的應用擴展到多個治療領域,這一趨勢在預測期內可能會發生變化。
依應用領域劃分,全球器官晶片市場分為藥物發現和毒性測試、癌症研究、幹細胞研究和組織工程以及再生醫學。雖然用於癌症研究的器官晶片模型和培養板是推動整體市場成長的主要因素,但值得注意的是,用於幹細胞研究和組織工程的器官晶片模型市場有望以相對較高的複合年增長率成長。
依最終用戶劃分,全球市場可分為製藥和生物技術公司、學術和研究機構、化妝品行業以及其他最終用戶。目前,製藥和生物技術公司佔最大的市場佔有率。然而,預計未來幾年化妝品行業的器官晶片市場將顯著成長。
依主要地區劃分,市場可分為北美、歐洲、亞太、拉丁美洲以及中東和北非。目前,預計北美將佔最大的市場佔有率。然而,由於歐洲各國禁止動物模型試驗,預計歐洲器官晶片市場在預測期內將以較高的複合年增長率成長。
晶片器官市場代表性公司
- 4DCell
- Aim biotech
- Beonchip
- Bi/ond
- CN BIO
- Emulate
- InSphero
- Jiksak Bioengineering
- Kirkstall
- Lena Biosciences
- Merck Millipore
- MesoBio Tech
- MicroBrain Biotech
- Mimetas
- ma Biosciences
- Qureator
- SynVivo
- TissUse
- Visikol
- Xona Microfluidics
目錄
第一章:引言
第二章:研究方法
第三章:市場動態
第四章:經濟及其他專案特定考量
第五章:摘要整理
第六章:引言
- 章節概要
- 器官晶片的歷史發展
- 器官晶片的設計
- 器官晶片的分類
- 器官晶片的優點與局限性器官晶片
- 器官晶片的應用
- 未來展望
第七章 市場概況:器官晶片技術與模型
- 章節概述
- 器官晶片技術與模型市場:市場概況
- 器官晶片技術與模型市場:開發商概況
第八章 市場概況:晶片和培養皿上的器官
第九章 器官晶片供應商:北美公司簡介
- 章節概述
- Emulate
- SynVivo
- Draper
- Hesperos
- Xona Microfluidics
章節10. 器官晶片供應商:歐洲公司簡介
- 章節概述
- CN Bio
- Dynamic42
- InSphero
- Beonchip
- BiomimX
- Mimetas
- NETRI
- React4life
- TissUse
第11章:器官晶片供應商:亞太地區公司簡介
- 章節概述
- Aim biotech
第12章:專利分析
第13章:品牌定位分析:器官晶片技術與模式供應商
第十四章:品牌定位分析:器官晶片與培養板供應商
- 章節概述
- 研究方法
- 關鍵參數
- 器官晶片與培養板供應商:品牌定位框架
第十五章:學術資助分析
- 章節概述
- 研究範圍與方法
- 器官晶片:學術資助分析
第十六章:合作關係
第十七章:資金與投資分析
第十八章:案例研究:無支架三維細胞培養系統
第十九章:市場影響分析:推動因素、阻礙因素機會與挑戰
- 章節概述
- 市場推動因素
- 市場阻礙因素
- 市場機遇
- 市場挑戰
- 結論
第20章 全球晶片器官市場
第21章 晶片器官市場(依產品類型劃分)
第22章 晶片器官市場(依器官類型劃分)
第23章 晶片器官市場(依單一器官模型劃分)
第24章 晶片器官市場(依結構材料劃分)
第25章器官晶片市場(依用途劃分)
第26章 器官晶片市場(依應用劃分)
第27章 器官晶片市場(依最終用戶劃分)
第28章 器官晶片市場(依地區劃分)
第29章 結論
第30章 高階主管洞察
第31章 附錄1:表格資料
第32章 附錄2:公司與組織清單
Organs-on-Chips Market: Overview
As per Roots Analysis, the global organ-on-chip market size is estimated to grow from USD 100 million in the current year to USD 944 million by 2035, at a CAGR of 25.2% during the forecast period, till 2035.
The opportunity for organ on a chip market has been distributed across the following segments:
Type of Product
- Organ based
- Disease based
Type of Organ
- Single organ based
- Multi organ based
Type of Single Organ based Model
- Liver
- Lung
- Brain
- Heart
- Intestine
- Kidney
- Other organs
Type of Material of Construction
- Polydimethylsiloxane
- Other polymer
- Glass
- Others
Purpose
- Research
- Therapeutic
Application Area
- Drug discovery / toxicity testing
- Cancer research
- Stem cell research
- Tissue engineering / regenerative medicine
- Others
End User
- Pharmaceutical and biotech companies
- Academic and research players
- Cosmetic industry players
- Other end users
Key Geographical Regions
- North America
- Europe
- Asia-Pacific
- Latin America
- Middle East and North Africa
Leading Players
Organs-on-Chips Market: Growth and Trends
Research suggests that 1 in every 1,000 drug candidates advance to clinical trials after preclinical evaluation. Among these, 90% of the candidates fail to enter the market, primarily because of insufficient efficacy or unexpected toxicity observed during clinical trials, as well as the limitations of animal-based preclinical models to accurately anticipate human reactions (due to challenges in replicating the complex human biology and mechanisms). Therefore, to address these issues / limitations and in an effort to reduce the healthcare burden due to drug failures, several researchers are striving to adopt alternative testing methods, such as organ-on-a-chip technology. Further, in order to fasten the discovery of innovative drugs and personalized medication, improved in vitro simulation of human biology and pathologies is required. Organs-on-a-chip, also known as micro-physiological systems (MPS), are in vitro microfluidic devices, housing living cells that imitate human physiology, thereby providing detailed descriptions of the cell microenvironment and disease pathophysiology. These chips are remodeled using microfabrication techniques and have chambers with live cells (continually perfused with cell culture media) that mimic the physio-chemical microenvironment of tissues in the human body.
At present, 75 integrated organ-on-chip technologies and models are available in the market, offering distinct advantages over the traditional cell culture and animal-based testing methods, such as enhanced accuracy in predicting physiological responses like humans, high in vivo replicability, reduced trial costs and dependency on animal models.
Owing to the increased demand for animal free testing, emergence of laws and increased investment and partnership activity, coupled with the advancements in microfluidics, the organ-on-chip market has witnessed steady growth over the past few years. However, the market's growth may be hindered by certain factors, such as the limitation of organ-on-chips to preclinical trials, lack of established protocols and standardization, and the limited use of organ-on-chips in long-term and chronic studies. In addition, the organ-on-chip market may face some challenges due to the choice of ideal material of construction, complexity of multi-organ integration and impact of integrating ancillary devices for enhanced efficacy. Therefore, in order to overcome the abovementioned challenges, organ-on-chip providers are required to collectively work towards the standardization of organ-on-chip manufacturing process.
Multiple factors are collectively responsible for the growth / decline of a market. Therefore, assessing the risks / challenges within an industry, monitoring approaches to overcome the challenges and capitalizing the opportunities, can help the companies to expand their business operations within this domain. Further, considering the continued innovation and investments in the organ-on-chip domain, along with increased adoption of new technologies, the market is anticipated to grow significantly in the coming future.
Organs-on-Chips Market: Key Insights
The report delves into the current state of the organs-on-chips market and identifies potential growth opportunities within the industry. Some key findings from the report include:
- More than 70 organ-on-chip technologies and models have been launched / approved or are currently under development; the market landscape features the presence of both established players and new entrants.
- Majority of the technologies and models support both organ-based and disease-based applications; of these, 98% of the technologies / models are preferred for drug discovery and toxicity testing studies.
- Presently, 25 players (established players as well as start-ups) claim to provide organ-on-chips and plates; more than 60% of these firms have been established post-2013.
- Over 50% of organ-on-chips products are microfluidic plates; interestingly, majority of these chips and plates are constructed from polymers due to their flexibility and moldability.
- More than 600 patents related to organ-on-chip have been filed / granted by industry and non-industry stakeholders, indicating a growing intellectual capital in the domain.
- The growing interest of stakeholders is evident from the increasing partnership activities; technology / product utilization agreements emerged as the most prevalent partnership model adopted by organ-on-chip providers.
- Close to 350 grants have been awarded for ongoing research and development efforts for organ-on-chip products and technologies; National Center for Advancing Translational Sciences has awarded the maximum grant amount.
- Since 2017, over USD 350 million have been invested by several investors across various funding rounds, thereby presenting lucrative growth opportunities within this emerging segment.
- In recent years, stakeholders have established strong brand positions to cater to the increasing demand for organ-on-chips; several players have introduced efficient, easy to use, and advanced products.
- The growing demand for animal free testing and advancements in microfluidics has emerged as key driving factors supporting the rapid evolution of the organ-on-chip market.
- Owing to the ability of organ-on-chips to provide animal free testing models and substantially reduce the costs associated with drug testing, the market is anticipated to witness a growth of 25.2% over the next decade.
Organs-on-Chips Market: Key Segments
Disease-based Model is the Fastest Growing Segment of the Organs-on-Chips Market
Based on the type of product, the global market for organs-on-chips is segmented into organ based and disease-based models. Currently, majority share of the organ-on-chip market is captured by organ-based models. It is worth mentioning that the disease-based model segment is likely to grow at a higher CAGR (around 27%) in the coming years.
Organ-on-Chip Products Supporting Single Organ-based Models are Likely to Dominate the Organs-on-Chips Market During the Forecast Period
Based on the type of organ, the global organs-on-chips market is distributed across single organ and multi organ-based models. While the organs-on-chip products supporting single organ-based models hold the majority of the market share, it is worth noting that organ-on-chip market for multi-organ-based models is likely to grow at a relatively higher CAGR during the forecast period. This can be attributed to the capability of multi-organ models to efficiently track metabolic pathways.
Liver-on-a-Chip Models are Likely to Hold the Largest Share of the Organs-on-Chips Market During the Forecast Period
Based on the type of single organ-based model, the global market is segmented into liver, lung, brain, heart, intestine, kidney and other organs-based models. Currently, the liver-on-a-chip models are likely to dominate and drive the overall market growth. It is worth noting that the lung, brain, and heart-on-a-chip models are likely to flourish during the forecast period. This can be attributed to the ability of these models to mimic the exact and intricate human biology / mechanisms.
Organs-on-Chips Market for Other Polymers is Likely to Grow at a Relatively Faster Pace During the Forecast Period
Based on the type of material, the global market value is segmented across polydimethylsiloxane (PDMS), other polymers, glass and other materials. Notably, owing to the high flexibility, transparency and gas permeability of PDMS, it is likely to dominate the organs-on-chips market during the forecast period.
Organs-On-Chips Market for Therapeutic Purposes is Likely to Grow at a Higher CAGR During the Forecast Period
Based on purpose, the global market is segmented into research and therapeutic purposes. Currently, organ-on-chips focussed on research purposes hold a larger share of the overall market. However, this trend is likely to change during the forecast period due to the expanding application of such chips across multiple therapeutic areas.
By Application Area, Organs-on-Chips for Cancer Research are Likely to Dominate the Market During the Forecast Period
Based on the application area, the global market for organs on chips is distributed across drug discovery and toxicity testing, cancer research, stem cell research and tissue engineering and regenerative medicines. While the organs-on-chip models and plates for cancer research will be the primary drivers of the overall market, it is worth highlighting that the market for organ-on-chips models used in stem cell research and tissue engineering is likely to grow at a relatively higher CAGR.
Currently, Pharmaceutical and Biotech Companies Hold the Largest Share of the Organs-On-Chips Market
Based on end users, the global market is segmented into pharmaceutical and biotech companies, academic and research players, cosmetic industry players, and other end users. Currently, pharmaceutical and biotech companies hold the largest market share. However, organ-on-chip market for cosmetic industry is expected to witness substantial growth in the coming years.
North America Accounts for the Largest Share of the Market
Based on key geographical regions, the market is segmented into North America, Europe, Asia-Pacific, Latin America and Middle East and North Africa. In the current scenario, North America is likely to capture the largest market share. However, owing to the ban on animal model testing in European countries, the organ-on-chip market in Europe is expected to grow at a higher CAGR during the forecast period.
Example Players in the Organs-on-Chips Market
- 4DCell
- Aim biotech
- Beonchip
- Bi/ond
- CN BIO
- Emulate
- InSphero
- Jiksak Bioengineering
- Kirkstall
- Lena Biosciences
- Merck Millipore
- MesoBio Tech
- MicroBrain Biotech
- Mimetas
- Numa Biosciences
- Qureator
- SynVivo
- TissUse
- Visikol
- Xona microfluidics
Primary Research Overview
The opinions and insights presented in this study were influenced by discussions conducted with multiple stakeholders. The research report features detailed transcripts of interviews held with the following industry stakeholders:
- Chief Executive Officer, Small Company, US
- Chief Executive Officer, Mid-sized Company, France
- Chief Executive Officer, Small Company, South Korea
- Chief Executive Officer, Small Company, Italy
- Chief Executive Officer, Small Company, Scotland
- Chief Technology Officer, Mid-sized Company, The Netherlands
- Chief Business Development Officer, Mid-sized Company, France
- President, Mid-sized Company, US
Organs-on-Chips Market: Research Coverage
The report on Organs-on-Chips Market features insights on various sections, including:
- Market Sizing and Opportunity Analysis: An in-depth analysis of the organ-on-chip market, focusing on key market segments, including [A] type of product, [B] type of organ, [C] type of single organ-based model, [D] type of material of construction, [E] purpose, [F] application area, [G] end user, [H] key geographical regions and [I] leading players.
- Market Impact Analysis: A thorough analysis of various factors, such as drivers, restraints, opportunities, and existing challenges that are likely to impact market growth.
- Organ-on-Chip Technologies and Models Market Landscape: A comprehensive evaluation of organ-on-chips and plates, based on several relevant parameters, such as [A] type of model, [B] compatible organ, and [C] application area.
- Organ-on-Chip Technologies and Models Developer Landscape: The report features a list of players engaged in the development of organ-on-chips and plates offered, along with analyses based on [A] year of establishment, [B] company size, [C] location of headquarters and [D] leading technology providers.
- Organ-on-Chip and Plates Market Landscape: A comprehensive evaluation of organ-on-chips and plates, based on several relevant parameters, such as [A] type of product, [B] type of model, [C] compatible organs, [D] application area, [E] material of construction, [F] type of polymer and [G] status of development.
- Organ-on-Chip and Plates Developer Landscape: The report features a list of players engaged in the development of organ-on-chips and plates offered, along with analyses based on [A] year of establishment, [B] company size, [C] location of headquarters and [D] leading chips and plate providers.
- Company Profiles: In-depth profiles of key industry players offering big data analytics solutions across various geographies, focusing on [A] company overviews, [B] financial information (if available), [C] organ-on-chip portfolio, [D] recent developments and [E] an informed future outlook.
- Patents Analysis: An in-depth analysis of patents filed / granted till date in the organ-on-chip domain, based on various relevant parameters, such as [A] type of patent, [B] publication year, [C] application year, [D] patent jurisdiction, [E] CPC symbols, [F] type of applicant, [G] patent age, [H] leading inventors, [I] leading industry and non-industry players, [J] patent benchmarking, and [K] patent valuation analysis.
- Brand Positioning Analysis: A detailed analysis of the [A] organ-on-chip technology and model providers and [B] organ-on-chips and plate providers, highlighting the current perceptions regarding their proprietary technologies, models, chips and plates by taking into consideration several relevant aspects, such as portfolio strength, portfolio diversity, years of experience, and company size.
- Academic Grants Analysis: A comprehensive assessment of grants that have been awarded to research institutes in the organ-on-chip domain, based on various relevant parameters, such as [A] year of award, [B] amount awarded, [C] administering institute center, [D] support period, [E] type of grant application, [F] purpose of grant, [G] activity code, [H] emerging focus area, [I] study section involved, [J] popular NIH departments, [K] type of recipient organization, [L] leading recipient organizations and [M] location of recipient organization.
- Partnerships and Collaborations: An insightful analysis of the deals inked by stakeholders in organs-on-chips market, based on several parameters, such as [A] year of partnership, [B] type of partnership, [C] type of organ, [D] geographical regions, [E] purpose of partnership, [F] most active players and [G] geographical distribution of partnership activity.
- Funding and Investment Analysis: An in-depth analysis of the fundings raised by organ-on-chip companies, based on relevant parameters, such as [A] year of funding, [B] type of funding, [C] amount invested (USD million), [D] purpose of funding, [E] associated organ / system, [F] therapeutic area, [G] geographical area, and [H] most active players.
- Case Study: A detailed assessment of scaffold-free 3D cell culture products, featuring a list of more than 60 products that are being used for research and pharmaceutical testing, based on a number of relevant parameters, such as [A] status of development, [B] type of system, [C] type of product and [D] material used for fabrication.
Key Questions Answered in this Report
- How many companies are currently engaged in this market?
- Which are the leading companies in this market?
- What factors are likely to influence the evolution of this market?
- What is the current and future market size?
- What is the CAGR of this market?
- How is the current and future market opportunity likely to be distributed across key market segments?
- What kind of partnership models are commonly adopted by industry stakeholders?
- What is the ongoing investment trend in this market?
- What is the patent filing activity trend in the market?
Reasons to Buy this Report
- The report provides a comprehensive market analysis, offering detailed revenue projections of the overall market and its specific sub-segments. This information is valuable to both established market leaders and emerging entrants.
- Stakeholders can leverage the report to gain a deeper understanding of the competitive dynamics within the market. By analyzing the competitive landscape, businesses can make informed decisions to optimize their market positioning and develop effective go-to-market strategies.
- The report offers stakeholders a comprehensive overview of the market, including key drivers, barriers, opportunities, and challenges. This information empowers stakeholders to stay abreast of market trends and make data-driven decisions to capitalize on growth prospects.
Additional Benefits
- Complimentary PPT Insights Packs
- Complimentary Excel Data Packs for all Analytical Modules in the Report
- 15% Free Content Customization
- Detailed Report Walkthrough Session with Research Team
- Free Updated report if the report is 6-12 months old or older
TABLE OF CONTENTS
1. PREFACE
- 1.1. Introduction
- 1.2. Market Share Insights
- 1.3. Key Market Insights
- 1.4. Report Coverage
- 1.5. Key Questions Answered
- 1.6. Chapter Outlines
2. RESEARCH METHODOLOGY
- 2.1. Chapter Overview
- 2.2. Research Assumptions
- 2.2.1. Market Landscape and Market Trends
- 2.2.2. Market Forecast and Opportunity Analysis
- 2.2.3. Comparative Analysis
- 2.3. Database Building
- 2.3.1. Data Collection
- 2.3.2. Data Validation
- 2.3.3. Data Analysis
- 2.4. Project Methodology
- 2.4.1. Secondary Research
- 2.4.1.1. Annual Reports
- 2.4.1.2. Academic Research Papers
- 2.4.1.3. Company Websites
- 2.4.1.4. Investor Presentations
- 2.4.1.5. Regulatory Filings
- 2.4.1.6. White Papers
- 2.4.1.7. Industry Publications
- 2.4.1.8. Conferences and Seminars
- 2.4.1.9. Government Portals
- 2.4.1.10. Media and Press Releases
- 2.4.1.11. Newsletters
- 2.4.1.12. Industry Databases
- 2.4.1.13. Roots Proprietary Databases
- 2.4.1.14. Paid Databases and Sources
- 2.4.1.15. Social Media Portals
- 2.4.1.16. Other Secondary Sources
- 2.4.2. Primary Research
- 2.4.2.1. Types of Primary Research
- 2.4.2.1.1. Qualitative Research
- 2.4.2.1.2. Quantitative Research
- 2.4.2.1.3. Hybrid Approach
- 2.4.2.2. Advantages of Primary Research
- 2.4.2.3. Techniques for Primary Research
- 2.4.2.3.1. Interviews
- 2.4.2.3.2. Surveys
- 2.4.2.3.3. Focus Groups
- 2.4.2.3.4. Observational Research
- 2.4.2.3.5. Social Media Interactions
- 2.4.2.4. Key Opinion Leaders Considered in Primary Research
- 2.4.2.4.1. Company Executives (CXOs)
- 2.4.2.4.2. Board of Directors
- 2.4.2.4.3. Company Presidents and Vice Presidents
- 2.4.2.4.4. Research and Development Heads
- 2.4.2.4.5. Technical Experts
- 2.4.2.4.6. Subject Matter Experts
- 2.4.2.4.7. Scientists
- 2.4.2.4.8. Doctors and Other Healthcare Providers
- 2.4.2.5. Ethics and Integrity
- 2.4.2.5.1. Research Ethics
- 2.4.2.5.2. Data Integrity
- 2.4.2.1. Types of Primary Research
- 2.4.3. Analytical Tools and Databases
- 2.4.1. Secondary Research
3. MARKET DYNAMICS
- 3.1. Chapter Overview
- 3.2. Forecast Methodology
- 3.2.1. Top-down Approach
- 3.2.2. Bottom-up Approach
- 3.2.3. Hybrid Approach
- 3.3. Market Assessment Framework
- 3.3.1. Total Addressable Market (TAM)
- 3.3.2. Serviceable Addressable Market (SAM)
- 3.3.3. Serviceable Obtainable Market (SOM)
- 3.3.4. Currently Acquired Market (CAM)
- 3.4. Forecasting Tools and Techniques
- 3.4.1. Qualitative Forecasting
- 3.4.2. Correlation
- 3.4.3. Regression
- 3.4.4. Extrapolation
- 3.4.5. Convergence
- 3.4.6. Sensitivity Analysis
- 3.4.7. Scenario Planning
- 3.4.8. Data Visualization
- 3.4.9. Time Series Analysis
- 3.4.10. Forecast Error Analysis
- 3.5. Key Considerations
- 3.5.1. Demographics
- 3.5.2. Government Regulations
- 3.5.3. Reimbursement Scenarios
- 3.5.4. Market Access
- 3.5.5. Supply Chain
- 3.5.6. Industry Consolidation
- 3.5.7. Pandemic / Unforeseen Disruptions Impact
- 3.6. Key Market Segmentation
- 3.7. Robust Quality Control
- 3.8. Limitations
4. ECONOMIC AND OTHER PROJECT SPECIFIC CONSIDERATIONS
- 4.1. Chapter Overview
- 4.2. Market Dynamics
- 4.2.1. Time Period
- 4.2.1.1. Historical Trends
- 4.2.1.2. Current and Forecasted Estimates
- 4.2.2. Currency Coverage
- 4.2.2.1. Overview of Major Currencies Affecting the Market
- 4.2.2.2. Impact of Currency Fluctuations on the Industry
- 4.2.3. Foreign Exchange Impact
- 4.2.3.1. Evaluation of Foreign Exchange Rates and Their Impact on Market
- 4.2.3.2. Strategies for Mitigating Foreign Exchange Risk
- 4.2.4. Recession
- 4.2.4.1. Historical Analysis of Past Recessions and Lessons Learnt
- 4.2.4.2. Assessment of Current Economic Conditions and Potential Impact on the Market
- 4.2.5. Inflation
- 4.2.5.1. Measurement and Analysis of Inflationary Pressures in the Economy
- 4.2.5.2. Potential Impact of Inflation on the Market Evolution
- 4.2.1. Time Period
5. EXECUTIVE SUMMARY
6. INTRODUCTION
- 6.1. Chapter Overview
- 6.2. Historical Evolution of Organ-on-chips
- 6.3. Design of Organ-on-chips
- 6.4. Classification of Organ-on-chips
- 6.4.1. Single Organ Chips
- 6.4.2. Disease / Therapeutic Specific Chips
- 6.4.3. Multi Organ Chips
- 6.5. Advantages and Limitations of Organ-on-chips
- 6.6. Applications of Organ-on-chips
- 6.7. Future Perspectives
7. MARKET LANDSCAPE: ORGAN-ON-CHIP TECHNOLOGIES AND MODELS
- 7.1. Chapter Overview
- 7.2. Organ-on-chip Technologies and Models Market: Overall Market Landscape
- 7.2.1. Analysis by Type of Model
- 7.2.2. Analysis by Compatible Organ
- 7.2.3. Analysis by Application Area
- 7.3. Organ-on-chip Technology and Models Market: Developer Landscape
- 7.3.1. Analysis by Year of Establishment
- 7.3.2. Analysis by Company Size
- 7.3.3. Analysis by Location of Headquarters
- 7.3.4. Analysis by Leading Technology Providers
8. MARKET LANDSCAPE: ORGAN-ON-CHIPS AND PLATES
- 8.1. Chapter Overview
- 8.2. Organ-on-Chips and Plates Market: Overall Market Landscape
- 8.2.1. Analysis by Type of Model
- 8.2.2. Analysis by Type of Product
- 8.2.3. Analysis by Compatible Organ
- 8.2.4. Analysis by Application Area
- 8.2.5. Analysis by Material of Construction
- 8.2.6. Analysis by Type of Polymer
- 8.2.7. Analysis by Status of Development
- 8.3. Organ-on-Chips and Plates Market: Developer Landscape
- 8.3.1. Analysis by Year of Establishment
- 8.3.2. Analysis by Company Size
- 8.3.3. Analysis by Location of Headquarters
- 8.3.4. Analysis by Leading Organ-on-Chips and Plates Providers
9. ORGAN-ON-CHIP PROVIDERS: COMPANY PROFILES OF PLAYERS BASED IN NORTH AMERICA
- 9.1. Chapter Overview
- 9.2. Emulate
- 9.2.1. Company Overview
- 9.2.2. Technology Portfolio
- 9.2.3. Product Portfolio
- 9.2.4. Recent Developments and Future Outlook
- 9.3. SynVivo
- 9.4. Draper
- 9.5. Hesperos
- 9.6. Xona Microfluidics
10. ORGAN-ON-CHIP PROVIDERS: COMPANY PROFILES OF PLAYERS BASED IN EUROPE
- 10.1. Chapter Overview
- 10.2. CN Bio
- 10.2.1. Company Overview
- 10.2.2. Technology Portfolio
- 10.2.3. Product Portfolio
- 10.2.4. Recent Developments and Future Outlook
- 10.3. Dynamic42
- 10.4. InSphero
- 10.5. Beonchip
- 10.6. BiomimX
- 10.7. Mimetas
- 10.8. NETRI
- 10.9. React4life
- 10.10. TissUse
11. ORGAN-ON-CHIP PROVIDERS: COMPANY PROFILES OF PLAYERS BASED IN ASIA-PACIFIC
- 11.1. Chapter Overview
- 11.2. Aim biotech
12. PATENT ANALYSIS
- 12.1. Chapter Overview
- 12.2. Scope and Methodology
- 12.3. Organ-on-Chip: Patent Analysis
- 12.3.1. Analysis by Type of Patent
- 12.3.2. Analysis by Patent Publication Year
- 12.3.3. Analysis by Patent Application Year
- 12.3.4. Analysis of Granted Patents by Publication Year
- 12.3.5. Analysis of Patent Applications by Publication Year
- 12.3.6. Analysis by Patent Jurisdiction
- 12.3.7. Analysis by CPC Symbols
- 12.3.8. Analysis by Type of Applicant
- 12.3.9. Analysis by Patent Age
- 12.3.10. Leading Inventors: Analysis by Number of Patents
- 12.3.11. Leading Industry Players: Analysis by Number of Patents
- 12.3.12. Leading Non-Industry Players: Analysis by Number of Patents
- 12.4. Patent Benchmarking Analysis
- 12.4.1. Analysis of Patent Characteristics (CPC Codes) by Leading Industry Players
- 12.5. Analysis by Patent Valuation
- 12.6. Leading Patents by Number of Citations
13. BRAND POSITIONING ANALYSIS: ORGAN-ON-CHIP TECHNOLOGIES AND MODELS PROVIDERS
- 13.1. Chapter Overview
- 13.2. Methodology
- 13.3. Key Parameters
- 13.4. Organ-on-Chip Technologies and Models Providers: Brand Positioning Framework
- 13.4.1. Brand Positioning Matrix: BiomimX
- 13.4.2. Brand Positioning Matrix: Hesperos
- 13.4.3. Brand Positioning Matrix: Emulate
- 13.4.4. Brand Positioning Matrix: Dynamic42
- 13.4.5. Brand Positioning Matrix: React4life
- 13.4.6. Brand Positioning Matrix: SynVivo
14. BRAND POSITIONING ANALYSIS: ORGAN-ON-CHIPS AND PLATES PROVIDERS
- 14.1. Chapter Overview
- 14.2. Methodology
- 14.3. Key Parameters
- 14.4. Organ-on-Chips and Plates Providers: Brand Positioning Framework
- 14.4.1. Brand Positioning Matrix: NETRI
- 14.4.2. Brand Positioning Matrix: TissUse
- 14.4.3. Brand Positioning Matrix: Aim Biotech
- 14.4.4. Brand Positioning Matrix: Beonchip
- 14.4.5. Brand Positioning Matrix: CN BIO
- 14.4.6. Brand Positioning Matrix: InSphero
- 14.4.7. Brand Positioning Matrix: Mimetas
- 14.4.8. Brand Positioning Matrix: SynVivo
- 14.4.9. Brand Positioning Matrix: Xona microfluidics
15. ACADEMIC GRANTS ANALYSIS
- 15.1 Chapter Overview
- 15.2. Scope and Methodology
- 15.3. Organ-on-Chip: Academic Grants Analysis
- 15.3.1. Analysis by Year of Grant Award
- 15.3.2. Analysis by Amount Awarded
- 15.3.3. Analysis by Administering Institute Center
- 15.3.4. Analysis by Support Period
- 15.3.5. Analysis by Administering Institute Center and Support Period
- 15.3.6. Analysis by Administering Institute Center and Amount Awarded
- 15.3.7. Analysis by Type of Grant Application
- 15.3.8. Analysis by Purpose of Grant
- 15.3.9. Analysis by Activity Code
- 15.3.10. Word Cloud Analysis: Emerging Focus Area
- 15.3.11. Analysis by Study Section Involved
- 15.3.12. Popular NIH Departments: Analysis by Number of Grants
- 15.3.13. Analysis by Type of Recipient Organizations
- 15.3.14. Analysis by Support Period and Amount Awarded
- 15.3.15. Popular Recipient Organizations: Analysis by Number of Grants
- 15.3.16. Popular Recipient Organizations: Analysis by Amount Awarded
- 15.3.17. Analysis by Location of Recipient Organization
16. PARTNERSHIPS AND COLLABORATIONS
- 16.1. Chapter Overview
- 16.2. Partnership Models
- 16.3. Organ-on-Chip: Partnerships and Collaborations Analysis
- 16.3.1. Analysis by Year of Partnership
- 16.3.2. Analysis by Type of Partnership
- 16.3.3. Analysis by Year and Type of Partnership
- 16.3.4. Analysis by Type of Organ
- 16.3.5. Analysis by Type of Partner
- 16.3.6. Analysis by Geography
- 16.3.6.1. Local and International Agreements
- 16.3.6.2. Intercontinental and Intracontinental Agreements
- 16.3.7. Most Active Players: Analysis by Number of Partnerships
17. FUNDING AND INVESTMENT ANALYSIS
- 17.1. Chapter Overview
- 17.2. Funding Models
- 17.3. Organ-on-Chip: Funding and Investments Analysis
- 17.3.1. Analysis by Year of Funding
- 17.3.2. Analysis by Type of Funding
- 17.3.3. Analysis by Year and Type of Funding
- 17.3.4. Analysis by Amount Invested
- 17.3.5. Analysis by Type of Funding and Amount Invested
- 17.3.6. Analysis by Purpose of Funding
- 17.3.7. Analysis by Associated Organ / System
- 17.3.8. Analysis by Therapeutic Area
- 17.3.9. Analysis by Geography
- 17.3.10. Most Active Players: Analysis by Number of Funding Instances
- 17.3.11. Most Active Players: Analysis by Amount Raised
- 17.3.12. Leading Investors: Analysis by Number of Funding Instances
- 17.4. Concluding Remarks
18. CASE STUDY: SCAFFOLD-FREE 3D CELL CULTURE SYSTEMS
- 18.1. Chapter Overview
- 18.2. Scaffold-Free Products: Overall Market Landscape
- 18.2.1. Analysis by Status of Development
- 18.2.2. Analysis by Type of System
- 18.2.3. Analysis by Type of Product
- 18.2.4. Analysis by Material Used for Construction
- 18.2.5. Analysis by Type of System and Material Used for Construction
- 18.3. Scaffold-Free Products: Developer Landscape
- 18.3.1. Analysis by Year of Establishment
- 18.3.2. Analysis by Company Size
- 18.3.3. Analysis by Location of Headquarters
19. MARKET IMPACT ANALYSIS: DRIVERS, RESTRAINTS, OPPORTUNITIES AND CHALLENGES
- 19.1. Chapter Overview
- 19.2. Market Drivers
- 19.3. Market Restraints
- 19.4. Market Opportunities
- 19.5. Market Challenges
- 19.6. Conclusion
20. GLOBAL ORGAN-ON-CHIP MARKET
- 20.1. Chapter Overview
- 20.2. Key Assumptions and Methodology
- 20.3. Organ-on-Chip Market: Historical Trends (since 2019) and Forecasted Estimates (till 2035)
- 20.3.1. Scenario Analysis
- 20.3.1.1. Conservative Scenario
- 20.3.1.2. Optimistic Scenario
- 20.3.1. Scenario Analysis
- 20.4. Key Market Segmentations
- 20.5. Leading Industry Players
21. ORGAN-ON-CHIP MARKET, BY TYPE OF PRODUCT
- 21.1. Chapter Overview
- 21.2. Key Assumptions and Methodology
- 21.3. Organ-on-Chip Market: Distribution by Type of Product
- 21.3.1. Organ-on-Chip Market for Organ based Models: Historical Trends (since 2019) and Forecasted Estimates (till 2035)
- 21.3.2. Organ-on-Chip Market for Disease based Models: Historical Trends (since 2019) and Forecasted Estimates (till 2035)
- 21.4. Data Triangulation and Validation
22. ORGAN-ON-CHIP MARKET, BY TYPE OF ORGAN
- 22.1. Chapter Overview
- 22.2. Key Assumptions and Methodology
- 22.3. Organ-on-Chip Market: Distribution by Type of Organ
- 22.3.1. Organ-on-Chip Market for Single Organ based Models: Historical Trends (since 2019) and Forecasted Estimates (till 2035)
- 22.3.2. Organ-on-Chip Market for Multi Organ based Models: Historical Trends (since 2019) and Forecasted Estimates (till 2035)
- 22.4. Data Triangulation and Validation
23. ORGAN-ON-CHIP MARKET, BY TYPE OF SINGLE ORGAN BASED MODEL
- 23.1. Chapter Overview
- 23.2. Key Assumptions and Methodology
- 23.3. Organ-on-Chip Market: Distribution by Type of Single Organ based Model
- 23.3.1. Organ-on-Chip Market for Liver Models: Historical Trends (since 2019) and Forecasted Estimates (till 2035)
- 23.3.2. Organ-on-Chip Market for Lung Models: Historical Trends (since 2019) and Forecasted Estimates (till 2035)
- 23.3.3. Organ-on-Chip Market for Brain Models: Historical Trends (since 2019) and Forecasted Estimates (till 2035)
- 23.3.4. Organ-on-Chip Market for Heart Models: Historical Trends (since 2019) and Forecasted Estimates (till 2035)
- 23.3.5. Organ-on-Chip Market for Intestine Models: Historical Trends (since 2019) and Forecasted Estimates (till 2035)
- 23.3.6. Organ-on-Chip Market for Kidney Models: Historical Trends (since 2019) and Forecasted Estimates (till 2035)
- 23.3.7. Organ-on-Chip Market for Other Organ based Models: Historical Trends (since 2019) and Forecasted Estimates (till 2035)
- 23.4. Data Triangulation and Validation
24. ORGAN-ON-CHIP MARKET, BY TYPE OF MATERIAL
- 24.1. Chapter Overview
- 24.2. Key Assumptions and Methodology
- 24.3. Organ-on-Chip Market: Distribution by Type of Material
- 24.3.1. Organ-on-Chip Market for Polydimethylsiloxane based Models: Historical Trends (since 2019) and Forecasted Estimates (till 2035)
- 24.3.2. Organ-on-Chip Market for Other Polymer based Models: Historical Trends (since 2019) and Forecasted Estimates (till 2035)
- 24.3.3. Organ-on-Chip Market for Glass based Models: Historical Trends (since 2019) and Forecasted Estimates (till 2035)
- 24.3.4. Organ-on-Chip Market for Other Material based Models: Historical Trends (since 2019) and Forecasted Estimates (till 2035)
- 24.4. Data Triangulation and Validation
25. ORGAN-ON-CHIP MARKET, BY PURPOSE
- 25.1. Chapter Overview
- 25.2. Key Assumptions and Methodology
- 25.3. Organ-on-Chip Market: Distribution by Purpose
- 25.3.1. Organ-on-Chip Market for Research Purposes: Historical Trends (since 2019) and Forecasted Estimates (till 2035)
- 25.3.2. Organ-on-Chip Market for Therapeutic Purposes: Historical Trends (since 2019) and Forecasted Estimates (till 2035)
- 25.4. Data Triangulation and Validation
26. ORGAN-ON-CHIP MARKET, BY APPLICATION AREA
- 26.1. Chapter Overview
- 26.2. Key Assumptions and Methodology
- 26.3. Organ-on-Chip Market: Distribution by Application Area
- 26.3.1. Organ-on-Chip Market for Drug Discovery and Toxicity Testing: Historical Trends (since 2019) and Forecasted Estimates (till 2035)
- 26.3.2. Organ-on-Chip Market for Cancer Research: Historical Trends (since 2019) and Forecasted Estimates (till 2035)
- 26.3.3. Organ-on-Chip Market for Stem Cell Research: Historical Trends (since 2019) and Forecasted Estimates (till 2035)
- 26.3.4. Organ-on-Chip Market for Tissue Engineering and Regenerative Medicine: Historical Trends (since 2019) and Forecasted Estimates (till 2035)
- 26.4. Data Triangulation and Validation
27. ORGAN-ON-CHIP MARKET, BY END USER
- 27.1. Chapter Overview
- 27.2. Key Assumptions and Methodology
- 27.3. Organ-on-Chip Market: Distribution by End User
- 27.3.1. Organ-on-Chip Market for Pharmaceutical and Biotech Companies: Historical Trends (since 2019) and Forecasted Estimates (till 2035)
- 27.3.2. Organ-on-Chip Market for Academic and Research Institutes: Historical Trends (since 2019) and Forecasted Estimates (till 2035)
- 27.3.3. Organ-on-Chip Market for Cosmetic Industry Players: Historical Trends (since 2019) and Forecasted Estimates (till 2035)
- 27.3.4. Organ-on-Chip Market for Other End Users: Historical Trends (since 2019) and Forecasted Estimates (till 2035)
- 27.4. Data Triangulation and Validation
28. ORGAN-ON-CHIP MARKET, BY GEOGRAPHICAL REGIONS
- 28.1. Chapter Overview
- 28.2. Key Assumptions and Methodology
- 28.3. Organ-on-Chip Market: Distribution by Geographical Regions
- 28.3.1. Organ-on-Chip Market in North America: Historical Trends (since 2019) and Forecasted Estimates (till 2035)
- 28.3.1.1. Organ-on-Chip Market in the US: Historical Trends (since 2019) and Forecasted Estimates (till 2035)
- 28.3.1.2. Organ-on-Chip Market in Canada: Historical Trends (since 2019) and Forecasted Estimates (till 2035)
- 28.3.1.3. Organ-on-Chip Market for Rest of North America: Historical Trends (since 2019) and Forecasted Estimates (till 2035)
- 28.3.2. Organ-on-Chip Market in Europe: Historical Trends (since 2019) and Forecasted Estimates (till 2035)
- 28.3.2.1. Organ-on-Chip Market in the UK: Historical Trends (since 2019) and Forecasted Estimates (till 2035)
- 28.3.2.2. Organ-on-Chip Market in Germany: Historical Trends (since 2019) and Forecasted Estimates (till 2035)
- 28.3.2.3. Organ-on-Chip Market in France: Historical Trends (since 2019) and Forecasted Estimates (till 2035)
- 28.3.2.4. Organ-on-Chip Market in Italy: Historical Trends (since 2019) and Forecasted Estimates (till 2035)
- 28.3.2.5. Organ-on-Chip Market in Spain: Historical Trends (since 2019) and Forecasted Estimates (till 2035)
- 28.3.2.6. Organ-on-Chip Market for Rest of Europe: Historical Trends (since 2019) and Forecasted Estimates (till 2035)
- 28.3.3. Organ-on-Chip Market in Asia-Pacific: Historical Trends (since 2019) and Forecasted Estimates (till 2035)
- 28.3.3.1. Organ-on-Chip Market in China: Historical Trends (since 2019) and Forecasted Estimates (till 2035)
- 28.3.3.2. Organ-on-Chip Market in Japan: Historical Trends (since 2019) and Forecasted Estimates (till 2035)
- 28.3.3.3. Organ-on-Chip Market in South Korea: Historical Trends (since 2019) and Forecasted Estimates (till 2035)
- 28.3.3.4. Organ-on-Chip Market in Australia: Historical Trends (since 2019) and Forecasted Estimates (till 2035)
- 28.3.3.5. Organ-on-Chip Market for Rest of Asia-Pacific: Historical Trends (since 2019) and Forecasted Estimates (till 2035)
- 28.3.4. Organ-on-Chip Market for Latin America: Historical Trends (since 2019) and Forecasted Estimates (till 2035)
- 28.3.5. Organ-on-Chip Market for Middle East and North Africa: Historical Trends (since 2019) and Forecasted Estimates (till 2035)
- 28.3.1. Organ-on-Chip Market in North America: Historical Trends (since 2019) and Forecasted Estimates (till 2035)
- 28.4. Data Triangulation and Validation
29. CONCLUSION
30. EXECUTIVE INSIGHTS
- 30.1. Chapter Overview
- 30.2. Company A
- 30.2.1. Company Snapshot
- 30.2.2. Interview Transcript: Chief Executive Officer
- 30.3. Company B
- 30.3.1. Company Snapshot
- 30.3.2. Interview Transcript: Chief Executive Officer
- 30.4. Company C
- 30.4.1. Company Snapshot
- 30.4.2. Interview Transcript: Chief Technology Officer
- 30.5. Company D
- 30.5.1. Company Snapshot
- 30.5.2. Interview Transcript: Chief Executive Officer
- 30.6. Company E
- 30.6.1. Company Snapshot
- 30.6.2. Interview Transcript: Chief Executive Officer
- 30.7. Company F
- 30.7.1. Company Snapshot
- 30.7.2. Interview Transcript: Chief Executive Officer
- 30.8. Company G
- 30.8.1. Company Snapshot
- 30.8.2. Interview Transcript: Chief Business Development Officer
- 30.9. Company H
- 30.9.1. Company Snapshot
- 30.9.2. Interview Transcript: President
31. APPENDIX 1: TABULATED DATA
32. APPENDIX 2: LIST OF COMPANIES AND ORGANIZATIONS
List of Tables
- Table 7.1 Organ-on-Chip Technologies and Models: Information on Provider and Type of Model
- Table 7.2 Organ-on-Chip Technologies and Models: Information on Compatible Organ and Application Area
- Table 7.3 List of Organ-on-Chip Technology and Model Providers
- Table 8.1 Organ-on-Chips and Plates: Information on Provider, Type of Product and Type of Model
- Table 8.2 Organ-on-Chips and Plates: Information on Compatible Organ and Application Area
- Table 8.3 Organ-on-Chips and Plates: Information on Material of Construction, Type of Polymer and Status of Development
- Table 8.4 List of Organ-on-Chips and Plates Providers
- Table 9.1 Organ-on-Chip Providers in North America: List of Companies Profiled
- Table 9.2 Emulate: Company Overview
- Table 9.3 Emulate: Key Characteristics of Organ-on-Chip Technologies
- Table 9.4 Emulate: Key Characteristics of Organ-on-Chip Products
- Table 9.5 Emulate: Recent Developments and Future Outlook
- Table 9.6 SynVivo: Company Overview
- Table 9.7 SynVivo: Key Characteristics of Organ-on-Chip Technologies
- Table 9.8 SynVivo: Key Characteristics of Organ-on-Chip Products
- Table 9.9 Draper: Company Overview
- Table 9.10 Hesperos: Company Overview
- Table 9.11 Xona Microfluidics: Company Overview
- Table 10.1 Organ-on-Chip Providers in Europe: List of Companies Profiled
- Table 10.2 CN Bio: Company Overview
- Table 10.3 CN Bio: Key Characteristics of Organ-on-Chip Technologies
- Table 10.4 CN Bio: Key Characteristics of Organ-on-Chip Products
- Table 10.5 CN Bio: Recent Developments and Future Outlook
- Table 10.6 Dynamic42: Company Overview
- Table 10.7 Dynamic42: Key Characteristics of Organ-on-Chips Technologies
- Table 10.8 Dynamic42: Key Characteristics of Organ-on-Chips Products
- Table 10.9 Dynamic42: Recent Developments and Future Outlook
- Table 10.10 InSphero: Company Overview
- Table 10.11 InSphero: Key Characteristics of Organ-on-Chip Technologies
- Table 10.12 InSphero: Key Characteristics of Organ-on-Chip Products
- Table 10.13 InSphero: Recent Developments and Future Outlook
- Table 10.14 Beonchip: Company Overview
- Table 10.15 BiomimX: Company Overview
- Table 10.16 Mimetas: Company Overview
- Table 10.17 NETRI: Company Overview
- Table 10.18 React4life: Company Overview
- Table 10.19 TissUse: Company Overview
- Table 11.1 Organ-on-Chip Providers in Asia-Pacific: List of Companies Profiled
- Table 11.2 AIM Biotech: Company Overview
- Table 12.1 Patent Analysis: Top CPC Sections
- Table 12.2 Patent Analysis: Top CPC Symbols
- Table 12.3 Patent Analysis: Top CPC Codes
- Table 12.4 Patent Analysis: Summary of Benchmarking Analysis
- Table 12.5 Patent Analysis: Categorization based on Weighted Valuation Scores
- Table 12.6 Patent Portfolio: List of Leading Patents (by Highest Relative Valuation)
- Table 12.7 Patent Portfolio: List of Leading Patents (by Number of Citations)
- Table 13.1 Brand Positioning: List of Organ-on-Chip Technologies and Models Brands Positioned
- Table 14.1 Brand Positioning: List of Organ-on-Chips and Plates Brands Positioned
- Table 16.1 Organ-on-Chip: List of Partnerships and Collaborations
- Table 17.1 Organ-on-Chip: List of Funding and Investments
- Table 18.1 Scaffold-free Products: Information on Developer, Status of Development, Type of System, Type of Product and Material Used for Construction
- Table 18.2 Scaffold-free Developers: Information on Year of Establishment, Company Size, Location of Headquarters and Type of Products Offered
- Table 20.1 Organ-on-Chip Market: Leading Industry Players
- Table 30.1 Lena Biosciences: Company Snapshot
- Table 30.2 NETRI: Company Snapshot
- Table 30.3 Bi/ond: Company Snapshot
- Table 30.4 EDmicBio: Company Snapshot
- Table 30.5 React4life: Company Snapshot
- Table 30.6 Screenin3D: Company Snapshot
- Table 30.7 Cherry Biotech: Company Snapshot
- Table 30.8 Hesperos: Company Snapshot
- Table 31.1 Organ-on-Chip Technologies and Models: Distribution by Type of Model
- Table 31.2 Organ-on-Chip Technologies and Models: Distribution by Compatible Organ
- Table 31.3 Organ-on-Chip Technologies and Models: Distribution by Application Area
- Table 31.4 Organ-on-Chip Technology and Model Providers: Distribution by Year of Establishment
- Table 31.5 Organ-on-Chip Technology and Model Providers: Distribution by Company Size
- Table 31.6 Organ-on-Chip Technology and Model Providers: Distribution by Location of Headquarters
- Table 31.7 Leading Technology Providers: Distribution by Number of Organ-on-Chip Technologies and Models
- Table 31.8 Organ-on-Chips and Plates: Distribution by Type of Model
- Table 31.9 Organ-on-Chips and Plates: Distribution by Type of Product
- Table 31.10 Organ-on-Chips and Plates: Distribution by Compatible Organ
- Table 31.11 Organ-on-Chips and Plates: Distribution by Application Area
- Table 31.12 Organ-on-Chips and Plates: Distribution by Material of Construction
- Table 31.13 Organ-on-Chips and Plates: Distribution by Type of Polymer
- Table 31.14 Organ-on-Chips and Plates: Distribution by Status of Development
- Table 31.15 Organ-on-Chips and Plates Providers: Distribution by Year of Establishment
- Table 31.16 Organ-on-Chips and Plates Providers: Distribution by Company Size
- Table 31.17 Organ-on-Chips and Plates Providers: Distribution by Location of Headquarters
- Table 31.18 Organ-on-Chips and Plates Providers: Distribution by Number of Organ-on-Chips and Plates
- Table 31.19 Patent Analysis: Distribution by Type of Patent
- Table 31.20 Patent Analysis: Cumulative Year-wise Trend by Patent Publication Year, Since 2019
- Table 31.21 Patent Analysis: Cumulative Year-wise Trend by Patent Application Year, Since 2019
- Table 31.22 Patent Analysis: Distribution of Granted Patents by Publication Year
- Table 31.23 Patent Analysis: Distribution of Patent Applications by Publication Year
- Table 31.24 Patent Analysis: Distribution by Patent Jurisdiction
- Table 31.25 Patent Analysis: Cumulative Year-wise Trend by Type of Applicant, Since 2019
- Table 31.26 Patent Analysis: Distribution by Patent Age
- Table 31.27 Leading Inventors: Distribution by Number of Patents
- Table 31.28 Leading Industry Players: Distribution by Number of Patents
- Table 31.29 Leading Non-Industry Players: Distribution by Number of Patents
- Table 31.30 Patent Benchmarking Analysis: Distribution of Patent Characteristics (CPC Codes) by Leading Industry Players
- Table 31.31 Patent Benchmarking Analysis: Distribution of Leading Industry Players by Patent Characteristics (CPC Codes)
- Table 31.32 Organ-on-Chip Market: Patent Valuation
- Table 31.33 Academic Grant Analysis: Cumulative Year-Wise Trend, Since Pre-2019
- Table 31.34 Academic Grant Analysis: Distribution by Amount Awarded (USD Million)
- Table 31.35 Academic Grant Analysis: Distribution by Administering Institute Center
- Table 31.36 Academic Grant Analysis: Distribution by Support Period
- Table 31.37 Academic Grant Analysis: Distribution by Administering Institute Center and Support Period
- Table 31.38 Academic Grant Analysis: Distribution by Administering Institute Center and Amount Awarded (USD Million)
- Table 31.39 Academic Grant Analysis: Distribution by Type of Grant Application
- Table 31.40 Academic Grant Analysis: Distribution by Purpose of Grant
- Table 31.41 Academic Grant Analysis: Distribution by Activity Code
- Table 31.42 Academic Grant Analysis: Distribution by Study Section Involved
- Table 31.43 Popular NIH Departments: Distribution by Number of Grants
- Table 31.44 Academic Grant Analysis: Distribution by Type of Recipient Organization
- Table 31.45 Academic Grant Analysis: Distribution by Support Period and Amount Awarded (USD Million)
- Table 31.46 Popular Recipient Organizations: Distribution by Number of Grants
- Table 31.47 Popular Recipient Organizations: Distribution by Amount Awarded (USD Million)
- Table 31.48 Academic Grant Analysis: Distribution by Location of Recipient Organization
- Table 31.49 Partnerships and Collaborations: Cumulative Year-wise Trend, Since 2017
- Table 31.50 Partnerships and Collaborations: Distribution by Type of Partnership
- Table 31.51 Partnerships and Collaborations: Distribution by Year and Type of Partnership, Since 2017
- Table 31.52 Partnerships and Collaborations: Distribution by Type of Organ
- Table 31.53 Partnerships and Collaborations: Distribution by Type of Partner
- Table 31.54 Partnerships and Collaborations: Distribution by Geography (Country)
- Table 31.56 Partnerships and Collaborations: Distribution by Geography (Region)
- Table 31.57 Partnerships and Collaborations: Local and International Agreements
- Table 31.58 Partnerships and Collaborations: Intercontinental and Intracontinental Agreements
- Table 31.59 Most Active Players: Distribution by Number of Partnerships
- Table 31.60 Funding and Investment Analysis: Cumulative Year-wise Trend, Since 2017
- Table 31.61 Funding and Investment Analysis: Analysis by Type of Funding
- Table 31.62 Funding and Investment Analysis: Distribution by Year and Type of Funding, Since 2017
- Table 31.63 Funding and Investment Analysis: Cumulative Year-wise Trend of Amount Invested (USD Million)
- Table 31.64 Funding and Investment Analysis: Distribution by Type of Funding and Amount Invested (USD Million)
- Table 31.65 Funding and Investment Analysis: Distribution by Purpose of Funding
- Table 31.66 Funding and Investment Analysis: Distribution by Associated Organ / System
- Table 31.67 Funding and Investment Analysis: Distribution by Therapeutic Area
- Table 31.68 Funding and Investment Analysis: Geographical Distribution of Funding Instances
- Table 31.69 Most Active Players: Distribution by Number of Funding Instances
- Table 31.70 Most Active Players: Distribution by Amount Raised (USD Million)
- Table 31.71 Leading Investors: Distribution by Number of Funding Instances
- Table 31.72 Scaffold-free Products: Distribution by Status of Development
- Table 31.73 Scaffold-free Products: Distribution by Type of System
- Table 31.74 Scaffold-free Products: Distribution by Type of Product
- Table 31.75 Scaffold-free Products: Distribution by Material Used for Fabrication
- Table 31.76 Scaffold-free Products: Distribution by Type of System and Material Used for Fabrication
- Table 31.77 Scaffold-free Product Developers: Distribution by Year of Establishment
- Table 31.78 Scaffold-free Product Developers: Distribution by Company Size
- Table 31.79 Scaffold-free Product Developers: Distribution by Location of Headquarters
- Table 31.80 Global Organ-on-Chip Market, Historical Trends (since 2019) and Forecasted Estimates (till 2035) (USD Million)
- Table 31.81 Global Organ-on-Chip Market, Historical Trends (since 2019) and Forecasted Estimates (till 2035): Conservative Scenario (USD Million)
- Table 31.82 Global Organ-on-Chip Market, Historical Trends (since 2019) and Forecasted Estimates (till 2035): Optimistic Scenario (USD Million)
- Table 31.83 Organ-on-Chip Market: Distribution by Type of Product
- Table 31.84 Organ-on-Chip Market for Organ based Models, Historical Trends (since 2019) and Forecasted Estimates (till 2035) (USD Million)
- Table 31.85 Organ-on-Chip Market for Disease based Models, Historical Trends (since 2019) and Forecasted Estimates (till 2035) (USD Million)
- Table 31.86 Organ-on-Chip Market: Distribution by Type of Organ
- Table 31.87 Organ-on-Chip Market for Organ based Models, Historical Trends (since 2019) and Forecasted Estimates (till 2035) (USD Million)
- Table 31.88 Organ-on-Chip Market for Multi Organ based Models, Historical Trends (since 2019) and Forecasted Estimates (till 2035) (USD Million)
- Table 31.89 Organ-on-Chip Market: Distribution by Type of Single Organ based Model
- Table 31.90 Organ-on-Chip Market for Liver based Models, Historical Trends (since 2019) and Forecasted Estimates (till 2035) (USD Million)
- Table 31.91 Organ-on-Chip Market for Lung based Models, Historical Trends (since 2019) and Forecasted Estimates (till 2035) (USD Million)
- Table 31.92 Organ-on-Chip Market for Brain based Models, Historical Trends (since 2019) and Forecasted Estimates (till 2035) (USD Million)
- Table 31.93 Organ-on-Chip Market for Heart based Models, Historical Trends (since 2019) and Forecasted Estimates (till 2035) (USD Million)
- Table 31.94 Organ-on-Chip Market for Intestine based Models, Historical Trends (since 2019) and Forecasted Estimates (till 2035) (USD Million)
- Table 31.95 Organ-on-Chip Market for Kidney based Models, Historical Trends (since 2019) and Forecasted Estimates (till 2035) (USD Million)
- Table 31.96 Organ-on-Chip Market for Other Organ based Models, Historical Trends (since 2019) and Forecasted Estimates (till 2035) (USD Million)
- Table 31.97 Organ-on-Chip Market: Distribution by Type of Material of Construction
- Table 31.98 Organ-on-Chip Market for Polydimethylsiloxane based Models, Historical Trends (since 2019) and Forecasted Estimates (till 2035) (USD Million)
- Table 31.99 Organ-on-Chip Market for Other Polymer based Models, Historical Trends (since 2019) and Forecasted Estimates (till 2035) (USD Million)
- Table 31.100 Organ-on-Chip Market for Glass based Models, Historical Trends (since 2019) and Forecasted Estimates (till 2035) (USD Million)
- Table 31.101 Organ-on-Chip Market for Other Material based Models, Historical Trends (since 2019) and Forecasted Estimates (till 2035) (USD Million)
- Table 31.102 Organ-on-Chip Market: Distribution by Purpose
- Table 31.103 Organ-on-Chip Market for Research Purposes, Historical Trends (since 2019) and Forecasted Estimates (till 2035) (USD Million)
- Table 31.104 Organ-on-Chip Market for Therapeutic Purposes, Historical Trends (since 2019) and Forecasted Estimates (till 2035) (USD Million)
- Table 31.105 Organ-on-Chip Market: Distribution by Application Area
- Table 31.106 Organ-on-Chip Market for Drug Discovery and Toxicity Testing, Historical Trends (since 2019) and Forecasted Estimates (till 2035) (USD Million)
- Table 31.107 Organ-on-Chip Market for Cancer Research, Historical Trends (since 2019) and Forecasted Estimates (till 2035) (USD Million)
- Table 31.108 Organ-on-Chip Market for Stem Cell Research, Historical Trends (since 2019) and Forecasted Estimates (till 2035) (USD Million)
- Table 31.109 Organ-on-Chip Market for Tissue Engineering and Regenerative Medicines, Historical Trends (since 2019) and Forecasted Estimates (till 2035) (USD Million)
- Table 31.110 Organ-on-Chip Market: Distribution by End User
- Table 31.111 Organ-on-Chip Market for Pharmaceutical and Biotech Companies, Historical Trends (since 2019) and Forecasted Estimates (till 2035) (USD Million)
- Table 31.112 Organ-on-Chip Market for Academic and Research Institutes, Historical Trends (since 2019) and Forecasted Estimates (till 2035) (USD Million)
- Table 31.113 Organ-on-Chip Market for Cosmetic Industry Players, Historical Trends (since 2019) and Forecasted Estimates (till 2035) (USD Million)
- Table 31.114 Organ-on-Chip Market for Other End Users, Historical Trends (since 2019) and Forecasted Estimates (till 2035) (USD Million)
- Table 31.115 Organ-on-Chip Market: Distribution by Geography
- Table 31.116 Organ-on-Chip Market in North America, Historical Trends (since 2019) and Forecasted Estimates (till 2035) (USD Million)
- Table 31.117 Organ-on-Chip Market in the US, Historical Trends (since 2019) and Forecasted Estimates (till 2035) (USD Million)
- Table 31.118 Organ-on-Chip Market in Canada, Historical Trends (since 2019) and Forecasted Estimates (till 2035) (USD Million)
- Table 31.119 Organ-on-Chip Market in Rest of North America, Historical Trends (since 2019) and Forecasted Estimates (till 2035) (USD Million)
- Table 31.120 Organ-on-Chip Market in Europe, Historical Trends (since 2019) and Forecasted Estimates (till 2035) (USD Million)
- Table 31.121 Organ-on-Chip Market in the UK, Historical Trends (since 2019) and Forecasted Estimates (till 2035) (USD Million)
- Table 31.122 Organ-on-Chip Market in Germany, Historical Trends (since 2019) and Forecasted Estimates (till 2035) (USD Million)
- Table 31.123 Organ-on-Chip Market in France, Historical Trends (since 2019) and Forecasted Estimates (till 2035) (USD Million)
- Table 31.124 Organ-on-Chip Market in Italy, Historical Trends (since 2019) and Forecasted Estimates (till 2035) (USD Million)
- Table 31.125 Organ-on-Chip Market in Spain, Historical Trends (since 2019) and Forecasted Estimates (till 2035) (USD Million)
- Table 31.126 Organ-on-Chip Market in Rest of Europe, Historical Trends (since 2019) and Forecasted Estimates (till 2035) (USD Million)
- Table 31.127 Organ-on-Chip Market in Asia-Pacific, Historical Trends (since 2019) and Forecasted Estimates (till 2035) (USD Million)
- Table 31.128 Organ-on-Chip Market in China, Historical Trends (since 2019) and Forecasted Estimates (till 2035) (USD Million)
- Table 31.129 Organ-on-Chip Market in Japan, Historical Trends (since 2019) and Forecasted Estimates (till 2035) (USD Million)
- Table 31.130 Organ-on-Chip Market in South Korea, Historical Trends (since 2019) and Forecasted Estimates (till 2035) (USD Million)
- Table 31.131 Organ-on-Chip Market in Australia, Historical Trends (since 2019) and Forecasted Estimates (till 2035) (USD Million)
- Table 31.132 Organ-on-Chip Market in Rest of Asia-Pacific, Historical Trends (since 2019) and Forecasted Estimates (till 2035) (USD Million)
- Table 31.133 Organ-on-Chip Market in Latin America, Historical Trends (since 2019) and Forecasted Estimates (till 2035) (USD Million)
- Table 31.134Organ-on-Chip Market in Middle East and North Africa, Historical Trends (since 2019) and Forecasted Estimates (till 2035) (USD Million)
List of Figures
- Figure 2.1 Research Methodology: Project Methodology
- Figure 2.2 Research Methodology: Data Sources for Secondary Research
- Figure 2.3 Research Methodology: Robust Quality Control
- Figure 3.1 Market Dynamics: Forecast Methodology
- Figure 3.2 Market Dynamics: Key Market Segmentation
- Figure 4.1 Lessons Learnt from Past Recessions
- Figure 5.1 Executive Summary: Organ-on-Chip Technologies and Models Market Landscape
- Figure 5.2 Executive Summary: Organ-on-Chips and Plates Market Landscape
- Figure 5.3 Executive Summary: Recent Trends Analysis
- Figure 5.4 Executive Summary: Market Forecast and Opportunity Analysis
- Figure 6.1 Historical Evolution of Organ-on-Chips
- Figure 6.2 Types of Organ-on-Chips
- Figure 6.3 Types of Single Organ-on-Chips
- Figure 6.4 Advantages and Limitations of Organ-on-Chips
- Figure 6.5 Applications of Organ-on-Chips in Drug Discovery and Development
- Figure 7.1 Organ-on-Chip Technologies and Models: Distribution by Type of Model
- Figure 7.2 Organ-on-Chip Technologies and Models: Distribution by Compatible Organ
- Figure 7.3 Organ-on-Chip Technologies and Models: Distribution by Application Area
- Figure 7.4 Organ-on-Chip Technology and Model Providers: Distribution by Year of Establishment
- Figure 7.5 Organ-on-Chip Technology and Model Providers: Distribution by Company Size
- Figure 7.6 Organ-on-Chip Technology and Model Providers: Distribution by Location of Headquarters
- Figure 7.7 Leading Technology Providers: Distribution by Number of Organ-on-Chip Technologies and Models
- Figure 8.1 Organ-on-Chips and Plates: Distribution by Type of Model
- Figure 8.2 Organ-on-Chips and Plates: Distribution by Type of Product
- Figure 8.3 Organ-on-Chips and Plates: Distribution by Compatible Organ
- Figure 8.4 Organ-on-Chips and Plates: Distribution by Application Area
- Figure 8.5 Organ-on-Chips and Plates: Distribution by Material of Construction
- Figure 8.6 Organ-on-Chips and Plates: Distribution by Type of Polymer
- Figure 8.7 Organ-on-Chips and Plates: Distribution by Status of Development
- Figure 8.8 Organ-on-Chips and Plates Providers: Distribution by Year of Establishment
- Figure 8.9 Organ-on-Chips and Plates Providers: Distribution by Company Size
- Figure 8.10 Organ-on-Chips and Plates Providers: Distribution by Location of Headquarters
- Figure 8.11 Organ-on-Chips and Plates Providers: Distribution by Number of Organ-on-Chips and Plates
- Figure 12.1 Patent Analysis: Distribution by Type of Patent
- Figure 12.2 Patent Analysis: Cumulative Year-wise Trend by Patent Publication Year, Since 2019
- Figure 12.3 Patent Analysis: Cumulative Year-wise Trend by Patent Application Year, Since 2019
- Figure 12.4 Patent Analysis: Distribution of Granted Patents by Publication Year
- Figure 12.5 Patent Analysis: Distribution of Patent Applications by Publication Year
- Figure 12.6 Patent Analysis: Distribution by Patent Jurisdiction
- Figure 12.7 Patent Analysis: Distribution by CPC Symbols
- Figure 12.8 Patent Analysis: Cumulative Year-wise Trend by Type of Applicant, Since 2019
- Figure 12.9 Patent Analysis: Distribution by Patent Age
- Figure 12.10 Leading Inventors: Distribution by Number of Patents
- Figure 12.11 Leading Industry Players: Distribution by Number of Patents
- Figure 12.12 Leading Non-Industry Players: Distribution by Number of Patents
- Figure 12.13 Patent Benchmarking Analysis: Distribution of Patent Characteristics (CPC Codes) by Leading Industry Players
- Figure 12.14 Patent Benchmarking Analysis: Distribution of Leading Industry Players by Patent Characteristics (CPC Codes)
- Figure 12.15 Organ-on-Chip Market: Patent Valuation
- Figure 13.1 Brand Positioning Analysis: Organ-on-Chip Technologies and Models Providers (Competitive Advantage)
- Figure 13.2 Brand Positioning Analysis: Organ-on-Chip Technologies and Models Providers (Reasons to Believe)
- Figure 13.3 Brand Positioning Matrix: BiomimX
- Figure 13.4 Brand Positioning Matrix: Hesperos
- Figure 13.5 Brand Positioning Matrix: Emulate
- Figure 13.6 Brand Positioning Matrix: Dynamic42
- Figure 13.7 Brand Positioning Matrix: React4life
- Figure 13.8 Brand Positioning Matrix: SynVivo
- Figure 14.1 Brand Positioning Analysis: Organ-on-Chips and Plates Providers (Competitive Advantage)
- Figure 14.2 Brand Positioning Analysis: Organ-on-Chips and Plates Providers (Reasons to Believe)
- Figure 14.3 Brand Positioning Matrix: NETRI
- Figure 14.4 Brand Positioning Matrix: TissUse
- Figure 14.5 Brand Positioning Matrix: Aim Biotech
- Figure 14.6 Brand Positioning Matrix: Beonchip
- Figure 14.7 Brand Positioning Matrix: CN BIO
- Figure 14.8 Brand Positioning Matrix: InSphero
- Figure 14.9 Brand Positioning Matrix: Mimetas
- Figure 14.10 Brand Positioning Matrix: SynVivo
- Figure 14.11 Brand Positioning Matrix: Xona Microfluidics
- Figure 15.1 Academic Grant Analysis: Cumulative Year-Wise Trend, Since Pre-2019
- Figure 15.2 Academic Grant Analysis: Distribution by Amount Awarded (USD Million)
- Figure 15.3 Academic Grant Analysis: Distribution by Administering Institute Center
- Figure 15.4 Academic Grant Analysis: Distribution by Support Period
- Figure 15.5 Academic Grant Analysis: Distribution by Administering Institute Center and Support Period
- Figure 15.6 Academic Grant Analysis: Distribution by Administering Institute Center and Amount Awarded (USD Million)
- Figure 15.7 Academic Grant Analysis: Distribution by Type of Grant Application
- Figure 15.8 Academic Grant Analysis: Distribution by Purpose of Grant
- Figure 15.9 Academic Grant Analysis: Distribution by Activity Code
- Figure 15.10 Academic Grant Analysis: Emerging Focus Areas
- Figure 15.11 Academic Grant Analysis: Distribution by Study Section Involved
- Figure 15.12 Popular NIH Departments: Distribution by Number of Grants
- Figure 15.13 Academic Grant Analysis: Distribution by Type of Recipient Organization
- Figure 15.14 Academic Grant Analysis: Distribution by Support Period and Amount Awarded (USD Million)
- Figure 15.15 Popular Recipient Organizations: Distribution by Number of Grants
- Figure 15.16 Popular Recipient Organizations: Distribution by Amount Awarded (USD Million)
- Figure 15.17 Academic Grant Analysis: Distribution by Location of Recipient Organization
- Figure 16.1 Partnerships and Collaborations: Cumulative Year-wise Trend, Since 2017
- Figure 16.2 Partnerships and Collaborations: Distribution by Type of Partnership
- Figure 16.3 Partnerships and Collaborations: Distribution by Year and Type of Partnership, Since 2017
- Figure 16.4 Partnerships and Collaborations: Distribution by Type of Organ
- Figure 16.5 Partnerships and Collaborations: Distribution by Type of Partner
- Figure 16.6 Partnerships and Collaborations: Distribution by Geography (Country)
- Figure 16.7 Partnerships and Collaborations: Distribution by Geography (Region)
- Figure 16.8 Partnerships and Collaborations: Local and International Agreements
- Figure 16.9 Partnerships and Collaborations: Intercontinental and Intracontinental Agreements
- Figure 16.10 Most Active Players: Distribution by Number of Partnerships
- Figure 17.1 Funding and Investment Analysis: Cumulative Year-wise Trend, Since 2017
- Figure 17.2 Funding and Investment Analysis: Analysis by Type of Funding
- Figure 17.3 Funding and Investment Analysis: Distribution by Year and Type of Funding, Since 2017
- Figure 17.4 Funding and Investment Analysis: Cumulative Year-wise Trend of Amount Invested (USD Million)
- Figure 17.5 Funding and Investment Analysis: Distribution by Type of Funding and Amount Invested (USD Million)
- Figure 17.6 Funding and Investment Analysis: Distribution by Purpose of Funding
- Figure 17.7 Funding and Investment Analysis: Distribution by Associated Organ / System
- Figure 17.8 Funding and Investment Analysis: Distribution by Therapeutic Area
- Figure 17.9 Funding and Investment Analysis: Geographical Distribution of Funding Instances
- Figure 17.10 Most Active Players: Distribution by Number of Funding Instances
- Figure 17.11 Most Active Players: Distribution by Amount Raised (USD Million)
- Figure 17.12 Leading Investors: Distribution by Number of Funding Instances
- Figure 17.13 Funding and Investment Analysis: Summary of Investments
- Figure 18.1 Scaffold-free Products: Distribution by Status of Development
- Figure 18.2 Scaffold-free Products: Distribution by Type of System
- Figure 18.3 Scaffold-free Products: Distribution by Type of Product
- Figure 18.4 Scaffold-free Products: Distribution by Material Used for Fabrication
- Figure 18.5 Scaffold-free Products: Distribution by Type of System and Material Used for Fabrication
- Figure 18.6 Scaffold-free Product Developers: Distribution by Year of Establishment
- Figure 18.7 Scaffold-free Product Developers: Distribution by Company Size
- Figure 18.8 Scaffold-free Product Developers: Distribution by Location of Headquarters
- Figure 19.1 Global Organ-on-Chip Market, Historical Trends (since 2019) and Forecasted Estimates (till 2035) (USD Million)
- Figure 19.2 Global Organ-on-Chip Market, Historical Trends (since 2019) and Forecasted Estimates (till 2035): Conservative Scenario (USD Million)
- Figure 19.3 Global Organ-on-Chip Market, Historical Trends (since 2019) and Forecasted Estimates (till 2035): Optimistic Scenario (USD Million)
- Figure 21.1 Organ-on-Chip Market: Distribution by Type of Product
- Figure 21.2 Organ-on-Chip Market for Organ based Models, Historical Trends (since 2019) and Forecasted Estimates (till 2035) (USD Million)
- Figure 21.3 Organ-on-Chip Market for Disease based Models, Historical Trends (since 2019) and Forecasted Estimates (till 2035) (USD Million)
- Figure 22.1 Organ-on-Chip Market: Distribution by Type of Organ
- Figure 22.2 Organ-on-Chip Market for Organ based Models, Historical Trends (since 2019) and Forecasted Estimates (till 2035) (USD Million)
- Figure 22.3 Organ-on-Chip Market for Multi Organ based Models, Historical Trends (since 2019) and Forecasted Estimates (till 2035) (USD Million)
- Figure 23.1 Organ-on-Chip Market: Distribution by Type of Single Organ based Model
- Figure 23.2 Organ-on-Chip Market for Liver based Models, Historical Trends (since 2019) and Forecasted Estimates (till 2035) (USD Million)
- Figure 23.3 Organ-on-Chip Market for Lung based Models, Historical Trends (since 2019) and Forecasted Estimates (till 2035) (USD Million)
- Figure 23.4 Organ-on-Chip Market for Brain based Models, Historical Trends (since 2019) and Forecasted Estimates (till 2035) (USD Million)
- Figure 23.5 Organ-on-Chip Market for Heart based Models, Historical Trends (since 2019) and Forecasted Estimates (till 2035) (USD Million)
- Figure 23.6 Organ-on-Chip Market for Intestine based Models, Historical Trends (since 2019) and Forecasted Estimates (till 2035) (USD Million)
- Figure 23.7 Organ-on-Chip Market for Kidney based Models, Historical Trends (since 2019) and Forecasted Estimates (till 2035) (USD Million)
- Figure 23.8 Organ-on-Chip Market for Other Organ based Models, Historical Trends (since 2019) and Forecasted Estimates (till 2035) (USD Million)
- Figure 24.1 Organ-on-Chip Market: Distribution by Type of Material of Construction
- Figure 24.2 Organ-on-Chip Market for Polydimethylsiloxane based Models, Historical Trends (since 2019) and Forecasted Estimates (till 2035) (USD Million)
- Figure 24.3 Organ-on-Chip Market for Other Polymer based Models, Historical Trends (since 2019) and Forecasted Estimates (till 2035) (USD Million)
- Figure 24.4 Organ-on-Chip Market for Glass based Models, Historical Trends (since 2019) and Forecasted Estimates (till 2035) (USD Million)
- Figure 24.5 Organ-on-Chip Market for Other Material based Models, Historical Trends (since 2019) and Forecasted Estimates (till 2035) (USD Million)
- Figure 25.1 Organ-on-Chip Market: Distribution by Purpose
- Figure 25.2 Organ-on-Chip Market for Research Purposes, Historical Trends (since 2019) and Forecasted Estimates (till 2035) (USD Million)
- Figure 25.3 Organ-on-Chip Market for Therapeutic Purposes, Historical Trends (since 2019) and Forecasted Estimates (till 2035) (USD Million)
- Figure 26.1 Organ-on-Chip Market: Distribution by Application Area
- Figure 26.2 Organ-on-Chip Market for Drug Discovery and Toxicity Testing, Historical Trends (since 2019) and Forecasted Estimates (till 2035) (USD Million)
- Figure 26.3 Organ-on-Chip Market for Cancer Research, Historical Trends (since 2019) and Forecasted Estimates (till 2035) (USD Million)
- Figure 26.4 Organ-on-Chip Market for Stem Cell Research, Historical Trends (since 2019) and Forecasted Estimates (till 2035) (USD Million)
- Figure 26.5 Organ-on-Chip Market for Tissue Engineering and Regenerative Medicines, Historical Trends (since 2019) and Forecasted Estimates (till 2035) (USD Million)
- Figure 27.1 Organ-on-Chip Market: Distribution by End User
- Figure 27.2 Organ-on-Chip Market for Pharmaceutical and Biotech Companies, Historical Trends (since 2019) and Forecasted Estimates (till 2035) (USD Million)
- Figure 27.3 Organ-on-Chip Market for Academic and Research Institutes, Historical Trends (since 2019) and Forecasted Estimates (till 2035) (USD Million)
- Figure 27.4 Organ-on-Chip Market for Cosmetic Industry Players, Historical Trends (since 2019) and Forecasted Estimates (till 2035) (USD Million)
- Figure 27.5 Organ-on-Chip Market for Other End Users, Historical Trends (since 2019) and Forecasted Estimates (till 2035) (USD Million)
- Figure 28.1 Organ-on-Chip Market: Distribution by Geography
- Figure 28.2 Organ-on-Chip Market in North America, Historical Trends (since 2019) and Forecasted Estimates (till 2035) (USD Million)
- Figure 28.3 Organ-on-Chip Market in the US, Historical Trends (since 2019) and Forecasted Estimates (till 2035) (USD Million)
- Figure 28.4 Organ-on-Chip Market in Canada, Historical Trends (since 2019) and Forecasted Estimates (till 2035) (USD Million)
- Figure 28.5 Organ-on-Chip Market in Rest of North America, Historical Trends (since 2019) and Forecasted Estimates (till 2035) (USD Million)
- Figure 28.6 Organ-on-Chip Market in Europe, Historical Trends (since 2019) and Forecasted Estimates (till 2035) (USD Million)
- Figure 28.7 Organ-on-Chip Market in the UK, Historical Trends (since 2019) and Forecasted Estimates (till 2035) (USD Million)
- Figure 28.8 Organ-on-Chip Market in Germany, Historical Trends (since 2019) and Forecasted Estimates (till 2035) (USD Million)
- Figure 28.9 Organ-on-Chip Market in France, Historical Trends (since 2019) and Forecasted Estimates (till 2035) (USD Million)
- Figure 28.10 Organ-on-Chip Market in Italy, Historical Trends (since 2019) and Forecasted Estimates (till 2035) (USD Million)
- Figure 28.11 Organ-on-Chip Market in Spain, Historical Trends (since 2019) and Forecasted Estimates (till 2035) (USD Million)
- Figure 28.12 Organ-on-Chip Market in Rest of Europe, Historical Trends (since 2019) and Forecasted Estimates (till 2035) (USD Million)
- Figure 28.13 Organ-on-Chip Market in Asia-Pacific, Historical Trends (since 2019) and Forecasted Estimates (till 2035) (USD Million)
- Figure 28.14 Organ-on-Chip Market in China, Historical Trends (since 2019) and Forecasted Estimates (till 2035) (USD Million)
- Figure 28.15 Organ-on-Chip Market in Japan, Historical Trends (since 2019) and Forecasted Estimates (till 2035) (USD Million)
- Figure 28.16 Organ-on-Chip Market in South Korea, Historical Trends (since 2019) and Forecasted Estimates (till 2035) (USD Million)
- Figure 28.17 Organ-on-Chip Market in Australia, Historical Trends (since 2019) and Forecasted Estimates (till 2035) (USD Million)
- Figure 28.18 Organ-on-Chip Market in Rest of Asia-Pacific, Historical Trends (since 2019) and Forecasted Estimates (till 2035) (USD Million)
- Figure 28.19 Organ-on-Chip Market in Latin America, Historical Trends (since 2019) and Forecasted Estimates (till 2035) (USD Million)
- Figure 28.20 Organ-on-Chip Market in Middle East and North Africa, Historical Trends (since 2019) and Forecasted Estimates (till 2035) (USD Million)
- Figure 29.1 Concluding Remarks: Organ-on-Chip Technologies and Models Market Landscape
- Figure 29.2 Concluding Remarks: Organ-on-Chips and Plates Market Landscape
- Figure 29.3 Concluding Remarks: Patent Analysis
- Figure 29.4 Concluding Remarks: Brand Positioning Analysis
- Figure 29.5 Concluding Remarks: Academic Grant Analysis
- Figure 29.6 Concluding Remarks: Partnerships and Collaborations
- Figure 29.7 Concluding Remarks: Funding and Investment Analysis
- Figure 29.8 Concluding Remarks: Market Forecast and Opportunity Analysis (1/2)
- Figure 29.9 Concluding Remarks: Market Forecast and Opportunity Analysis (2/2)
 器官晶片平台市場分析與預測(至2035年):按類型、產品、服務、技術、組件、應用、材料類型、最終用戶和功能分類
 晶片器官市場:2026-2032年全球市場預測(按材料、產品、技術、器官類型、應用和最終用戶分類)
 器官腫瘤晶片市場規模、佔有率和成長分析:按晶片結構、腫瘤模型類型、組成材料、應用、最終用戶和地區分類-2026-2033年產業預測人體器官晶片市場:依器官類型、技術平台、產品類型、應用領域和最終用戶分類,全球預測(2026-2032)
 全球晶片器官市場規模、佔有率、趨勢和成長分析報告(2026-2034)全球晶片器官市場規模、佔有率、趨勢和成長分析報告(2026-2034)聚合物心臟瓣膜市場:按產品類型、材質、應用和最終用戶分類 - 全球預測(2026-2032年)器官晶片市場-2026-2031年預測
 晶片器官市場規模、佔有率和成長分析(按器官類型、模型類型、產品類型、用途、應用、最終用戶和地區分類)-2026-2033年產業預測
 全球晶片器官市場:預測至2032年-按器官類型、產品、技術、應用、最終用戶和地區進行分析