


 |
市場調查報告書
商品編碼
1830067
雙特異性抗體市場:2035年前的產業趨勢和全球預測 - 各治療領域,各作用機制,各標的抗原抗體形態,主要各地區,各主要企業Bispecific Antibodies Market: Industry Trends and Global Forecasts, Till 2035 - Distribution by Therapeutic Area, Mechanism of Action, Target Antigen Antibody Format, Key Geographical Regions and Key Players |
||||||
雙特異性抗體市場概況
預計全球雙特異性抗體市場在預測期間(至2035年)的複合年增長率為6.5%,從目前的89.3億美元增加到168.1億美元。
市場區隔包括基於以下參數的市場規模和機會分析:
治療領域
- 自體免疫疾病
- 遺傳性疾病
- 骨髓惡性腫瘤
- 眼科疾病
- 皮膚癌症
- 固態腫瘤
作用機制
- 細胞激素再標靶化/中和
- 雙重配體定位掩護
- 抗性因素共同標的
- 腫瘤血管新生
- T細胞的再標靶化/活性化
- 其他
標的抗原
- C5-白蛋白
- CD20 x CD3
- CD3 x BCMA
- CD3 x CD19
- EGFR x cMET
- EpCAM x CD3
- 第IXa因子x第X凝血因子
- gp100 x CD3
- HER2 x HER2
- PD-1 x CTLA-4
- PD-L1 x TGFB
- TNF-a x HSA
- VEGF x DLL4
- VEGF-A x ANG2
抗體形態
- 不對稱
- 片段
地區
- 北美(美國,加拿大,其他)
- 歐洲(德國,法國,義大利,西班牙,英國,其他)
- 亞洲(印度,中國,日本,韓國,其他)
- 其他地區
雙特異性抗體市場成長與趨勢
對單株抗體治療潛力及其在多種疾病治療中的有效應用的評估已經改變了製藥業。目前,正在進行廣泛的研究,以開發人工抗體療法來增強治療效果。幾十年前,雙價抗體是透過在單株抗體上添加抗原結合位點而開發的。這些雙價分子的主要目的是誘導細胞毒性免疫效應細胞,透過抗體依賴性細胞介導的細胞毒性作用 (ADCC) 和其他由免疫效應細胞推動的細胞毒過程增強對腫瘤細胞的殺傷力。目前,這種基於抗體的療法的改進版本正引起製藥公司的濃厚興趣。最近的進展表明,創新雙特異性抗體療法在臨床試驗中對各種目標疾病具有顯著的益處,這為開發這些療法的公司創造了巨大的機會。
雙特異性抗體市場受多個關鍵因素推動,包括日益加重的癌症負擔,以及對血液系統癌症、自體免疫疾病和其他疾病的個人化醫療日益增長的關注。日益加重的經濟負擔和慢性病對死亡率的影響,推動了對能夠治療各種腫瘤和非腫瘤疾病的高效雙特異性抗體療法的需求。因此,對高效雙特異性抗體療法日益增長的需求,以及來自工業和非工業領域的研發舉措,預計將在未來十年推動雙特異性抗體市場的發展。
雙特異性抗體市場關鍵洞察
本報告分析了雙特異性抗體市場的現狀,並探討了潛在的成長機會。報告的主要發現包括:
- 過去十年,雙特異性抗體治療領域穩步發展,全球超過120家藥物開發商正在評估400多種臨床和臨床前候選藥物。
- 目前的研發管線包含眾多處於臨床階段的雙特異性抗體候選藥物,這些藥物有可能透過標靶多種生物抗原來治療多種適應症。
- 事實上,業內參與者正在開發超過 85 個雙特異性抗體技術平台,旨在緩解此類療法目前在生產過程中面臨的課題。
- 合作活動的增加顯示了各方對該領域的興趣日益濃厚,各公司積極簽訂策略協議,以擴大其雙特異性抗體產品組合。
- 自 2010 年以來,已有近 280 項臨床試驗註冊,用於評估各種雙特異性抗體療法的安全性和有效性,其中大多數試驗在美國進行。
- 為了有效地推廣這些療法,藥物開發商正在積極探索各種推廣策略,以保持其市場地位。
- 根據開發平台的關注高漲有前途的臨床結果,市場今後10年,年率6.5%以上的成長被預料。
雙特異性抗體市場的主要細分市場
血液系統惡性腫瘤是雙特異性抗體市場中成長最快的細分市場
依治療領域劃分,市場分為自體免疫疾病、遺傳性疾病、血液系統惡性腫瘤、眼科疾病、皮膚癌及實體腫瘤。目前,遺傳性疾病在雙特異性抗體市場中佔比最大。值得注意的是,血液系統惡性腫瘤雙特異性抗體市場可能以相對較高的複合年增長率成長。
在預測期內,透過T細胞重靶向/活化起作用的雙特異性抗體將佔最大佔有率。
根據作用機制,市場細分為細胞激素重靶向/中和、雙配體阻斷、抗藥性因子共靶向、腫瘤血管生成靶向、T細胞重靶向/活化和其他活性。目前,T細胞重靶向/活化佔雙特異性抗體市場的最大佔有率。然而,預計在不久的將來,透過細胞激素重靶向/中和起作用的雙特異性抗體將佔最大的市場佔有率。
標靶CD3 x BCMA的雙特異性抗體是市場成長最快的細分市場
根據標靶抗原,市場細分為C5白蛋白、CD20 x CD3、CD3 x BCMA、CD3 x CD19、EGFR x cMET、EpCAM x CD3、因子IXa x 因子X、gp100 x CD3、HER2 x HER2、PD-1 x CTLA-4、PD-L1 x TGFB、TNF-a xH目前,標靶因子IXa x 因子X的藥物佔雙特異性抗體市場的最大佔有率。值得注意的是,針對 CD3 x BCMA 的藥物可能會以相對較高的複合年增長率成長。
在預測期內,非對稱雙特異性抗體可能會佔市場主導地位。
根據抗體形式,市場細分為非對稱雙特異性抗體和基於片段的雙特異性抗體。目前,非對稱抗體在雙特異性抗體市場中佔比最大。這一趨勢在短期內不太可能改變。
北美佔比最大
依主要地區劃分,市場細分為北美、歐洲、亞太地區及世界其他地區。預計北美將佔雙特異性抗體市場的大部分佔有率。此外,值得注意的是,預計未來幾年歐洲的複合年增長率將更高。
雙特異性抗體市場參與企業案例
- Akeso Biopharma
- Alexion
- Amgen
- Genmab
- Immunocore
- Janssen Research & Development
- Linton Pharm
- Merck
- OncXerna Therapeutics
- Pfizer
- Roche
- Taisho Pharmaceutical
- Zymeworks
初步研究概要
本研究中提出的觀點和見解受到與多位利害關係人討論的影響。本研究報告包含對以下產業利害關係人的深入訪談:
- A公司資深科學家
- B公司業務發展顧問
- C公司GMP臨床製作總監
- D公司前業務發展資深總監
- E公司創辦人、首席科學長兼首席執行官
- F公司博士生
雙特異性抗體市場研究目標
- 市場規模和機會分析:本報告對雙特異性抗體市場進行了深入分析,重點關注[A]治療領域、[B]作用機制、[C]目標抗原、[D]抗體形式和[E]主要地區等關鍵細分市場。
- 市場模式 1:對已核准或處於臨床開發階段的雙特異性抗體進行全面評估,同時考慮各種參數,例如 [A] 開發商、[B] 開發階段、[C] 標靶抗原、[D] 治療類型、[E] 給藥途徑、[F] 給藥方法、[G] 目標適應症、[H] 治療領域、[I] 階段
- 市場格局 2:對目前正在臨床前研究中評估的雙特異性抗體進行全面評估,同時考慮各種參數,例如 [A] 開發商、[B] 開發階段、[C] 目標抗原、[D] 治療領域、[E] 疾病細分、[F] 成立年份、[G] 公司規模和 [H] 開發商總部位置。
- 關鍵洞察:基於[A]開發階段和給藥途徑、[B]開發階段和疾病細分以及[C]開發階段和總部所在地等相關參數,深入分析雙特異性抗體療法的市場趨勢。此外,本章也基於[D]開發階段和疾病細分以及[E]開發階段和總部所在地,提供了臨床前階段雙特異性抗體療法的各種表示形式。此外,本章還基於[F]開發階段(臨床前、臨床、臨床前-臨床)和[G]總部所在地,對雙特異性抗體療法開發商進行了分析。
- 技術評估架構:基於若干相關參數,深入評估各類藥物開發商為生產雙特異性抗體療法而開發/使用的技術平台,包括:A]臨床/臨床前產品線的實力;[B]開發商的經驗年限;[C]公司規模;以及[D]開發商的總部所在地。
- 大藥廠分析:全面回顧各大製藥公司專注於雙特異性抗體療法的各種措施。分析包括可視化熱圖,展示主要製藥公司的分佈情況,以及比較多個相關參數措施的蛛網圖。
- 公司簡介:各地區參與雙特異性抗體開發的關鍵公司的詳細簡介,重點關注 A) 公司概況、[B] 財務資訊(如有)、[C] 藥物組合、[D] 最新進展和 [E] 明智的未來展望。
- 合作關係與合作:基於多個參數分析自 2016 年以來該領域建立的合作夥伴關係,包括 A) 合作年份、[B] 合作類型、[C] 疾病細分、[D] 採用的付款模式類型、[E] 交易價值、[F] 最活躍的參與者(按達成的交易數量)和 [G] 最受歡迎的技術(每種技術)。本節也揭示了該市場合作活動的區域分佈。
- 雙特異性抗體治療合約服務:回顧雙特異性抗體製造的關鍵步驟和課題。該報告還強調了雙特異性抗體開發者在選擇合適的合約研發組織 (CRO/CMO) 時需要考慮的關鍵因素,並提供了合約生產組織 (CMO) 和合約生物製劑研發組織 (CRO) 的清單。
- 臨床試驗分析:基於以下參數,審查各種雙特異性抗體療法已完成、正在進行和計劃中的臨床試驗:A) 研究註冊年份,[B] 研究階段,[C] 研究招募狀態,[D] 入組患者人數,[E] 研究類型,[F] 研究設計,[G] 申辦方/類型,[H] 合作者類型,[H] 主要行業和行業的領域。
- 案例研究 1:討論 ICH、WHO 和 FDA 發布的關於雙特異性抗體開發的通用監管指南。該報告還詳細介紹了製藥業對 FDA 指南的各種回應。
- 案例研究 2:回顧已上市雙特異性抗體的各種推廣管道,並列舉開展此類推廣活動的公司案例,分析已獲批雙特異性抗體 Blincyto® 和 Hemlibra® 的開發商所採用的各種推廣策略,並根據各自網站上的信息對這兩種藥物進行比較。
- SWOT 分析:SWOT 分析重點突顯了可能影響產業發展的關鍵推動因素和課題。此外,它還包含 Harvey Ball 分析,重點突出了每個 SWOT 參數對整個產業的相對影響。
目錄
第1章 序文
第2章 摘要整理
第3章 簡介
- 章概要
- 抗體簡介
- 抗體治療藥
- 雙特異性抗體形態
- 雙特異性抗體治療藥的作用機制
- 雙特異性抗體的應用
第4章 已核准及臨床治療的市場形勢
- 章概要
- 已核准及臨床階段的雙特異性抗體治療藥:市場形勢
- 已核准及臨床階段的雙特異性抗體治療藥:開發企業的全體形勢
第5章 前臨床治療的市場形勢
- 章概要
- 前臨床雙特異性抗體治療藥:市場形勢
- 前臨床雙特異性抗體治療藥:開發情形的全體形勢
第6章 重要的洞察
- 章概要
- 已核准及臨床階段的雙特異性抗體治療藥的形勢:重要的洞察
- 前臨床階段的雙特異性抗體治療藥的形勢:重要的洞察
- 雙特異性抗體治療藥開發的形勢:重要的洞察
第7章 技術評估組成架構
- 章節概述
- 雙特異性抗體治療:技術平台概述
- 雙特異性抗體技術平台:比較分析
- 大多數熱門技術平台:依開發階段分析
- 雙特異性抗體技術平台開發商:依總部所在地分析
第8章 大型製藥企業:基準分析
- 章概要
- 大型製藥企業:基準分析(蛛網圖)
- 大型製藥企業:臨床實驗平台的比較分析
第9章 企業簡介
- 章概要
- Akeso Biopharma
- Alphamab Oncology
- Amgen
- Merck
- Regeneron
- Roche
- Xencor
第10章 夥伴關係和合作
- 章概要
- 夥伴關係模式
- 雙特異性抗體治療藥:夥伴關係和合作
第11章 雙特異性抗體治療藥相關契約服務
- 章節概述
- 雙特異性抗體療法的生產
- 選擇合適的CMO/CRO合作夥伴的關鍵考慮因素
第12章 臨床試驗的分析
- 章節概述
- 關鍵假設與研究方法
- 雙特異性抗體療法:臨床試驗分析
第13章 案例研究:雙特異性抗體相關法規指南
- 章節概述
- 監管機構發布的指南
- 美國美國食品藥物管理局 (FDA)
- 世界衛生組織 (WHO)
第14章 案例研究:推銷/行銷策略
- 章節概述
- 推廣活動的主要管道
- 推廣和行銷策略中使用的其他管道
- 總結:雙特異性抗體開發商使用的推廣和行銷策略
- 推廣分析:Blincyto®
- 推廣分析:Hemlibra®
第15章 與市場預測機會分析
- 章節概述
- 範圍和局限性
- 預測研究方法與關鍵假設
- 2035年雙特異性抗體治療市場
- 雙特異性抗體市場:價值創造分析
- 雙特異性抗體治療市場:按產品劃分的銷售預測
- AK104(康方生物製藥)
- Blincyte™(安進)
- Hemlibra®(羅氏)
- Kimmtrak®(免疫核心)
- Lun Sumio®(羅氏)
- Nanozola®(大正藥)
- Rybrevant™(楊森研發)
- Tecvayli™(楊森研發)
- Vabismo™(羅氏)
- AK112(康方生物製藥)
- ALXN1720(亞力兄)
- GEN3013(Genmab)
- 格洛菲他瑪(羅氏)
- LP000(林頓製藥)
- M7824(默克)
- OMP 305B83 (Mereo BioPharma)
- PF-06863135 (輝瑞)
- ZW25 (Zymeworks)
- 結論
第16章 SWOT分析
- 章概要
- 優勢
- 弱點
- 機會
- 威脅
- 結論
第17章 結論
第18章 執行洞察
第19章 附錄1:表格形式資料
第20章 附錄2:企業·組織一覽
Bispecific Antibodies Market: Overview
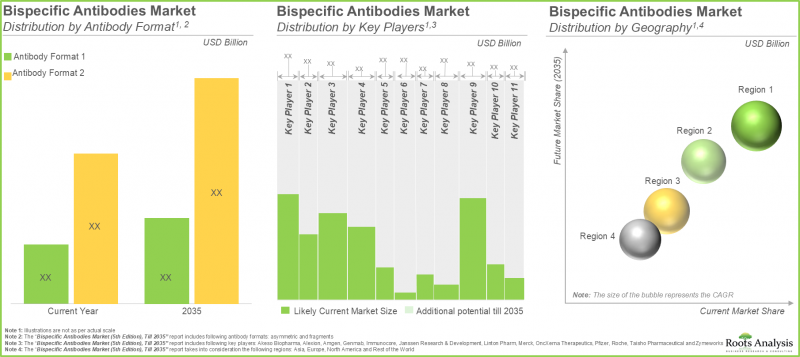
As per Roots Analysis, the global bispecific antibodies market is estimated to grow from USD 8.93 billion in the current year to USD 16.81 billion by 2035, at a CAGR of 6.5% during the forecast period, till 2035.
The market sizing and opportunity analysis has been segmented across the following parameters:
Therapeutic Area
- Autoimmune Disorders
- Genetic Disorders
- Hematological Malignancies
- Ophthalmic Disorders
- Skin Cancers
- Solid Tumors
Mechanism of Action
- Cytokines Retargeting / Neutralization
- Dual Ligands Blocking
- Resistance Factors Co-targeting
- Targeting Tumor Angiogenesis
- T-Cell Retargeting / Activation
- Others
Target Antigen
- C5-Albumin
- CD20 x CD3
- CD3 x BCMA
- CD3 x CD19
- EGFR x cMET
- EpCAM x CD3
- Factor IXa x Factor X
- gp100 x CD3
- HER2 x HER2
- PD-1 x CTLA-4
- PD-L1 x TGFB
- TNF-a x HSA
- VEGF x DLL4
- VEGF-A x ANG2
Antibody Format
- Asymmetric
- Fragments
Geography
- North America (US, Canada, Rest of North America)
- Europe (Germany, France, Italy, Spain, UK, Rest of Europe)
- Asia (India, China, Japan, South Korea, Rest of Asia)
- Rest of the World
Bispecific Antibodies Market: Growth and Trends
Assessing the therapeutic capabilities of monoclonal antibodies and their effective application in treating numerous diseases has transformed the pharmaceutical sector. Currently, extensive studies are underway to develop engineered antibody therapeutics to enhance treatment outcomes. Several decades ago, bispecific antibodies were developed by adding additional antigen binding sites to monoclonal antibodies. The primary goal of these bivalent molecules has been to guide cytotoxic immune effector cells to enhance the destruction of tumor cells through antibody-dependent cell-mediated cytotoxicity (ADCC) and various other cytotoxic processes driven by the immune effector cells. This modified version of antibody-based treatments is presently attracting significant interest from pharmaceutical firms. In recent years, clinical trials have shown significant advantages provided by innovative bispecific antibody treatments for various target conditions, creating substantial opportunities for those involved in developing these therapies.
The bispecific antibodies market is driven by major factors including the growing cancer burden, along with an increasing focus on personalized medicine for blood cancers, autoimmune diseases, and other such disorders. The rising financial burden of chronic diseases, along with its impact on death rates, has resulted in a heightened need for efficient bispecific antibody therapies that can address various oncological and non-oncological conditions. Consequently, R&D initiatives from both industry and non-industry entities, along with the increasing need for efficient bispecific antibody treatments, are expected to drive the bispecific antibodies market in the coming decade.
Bispecific Antibodies Market: Key Insights
The report delves into the current state of the bispecific antibodies market and identifies potential growth opportunities within the industry. Some key findings from the report include:
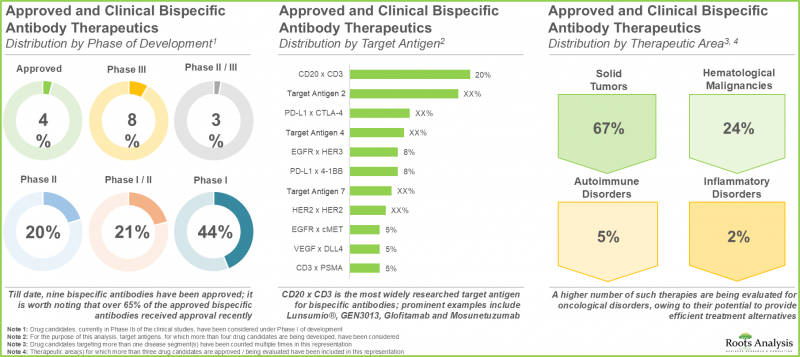
- The landscape of bispecific antibody therapeutics has steadily evolved in the past decade; over 400 clinical / preclinical candidates are being evaluated by over 120 drug developers worldwide.
- The current pipeline features a number of clinical stage bispecific antibody drug candidates, capable of targeting a range of biological antigens in order to potentially treat multiple target indications.
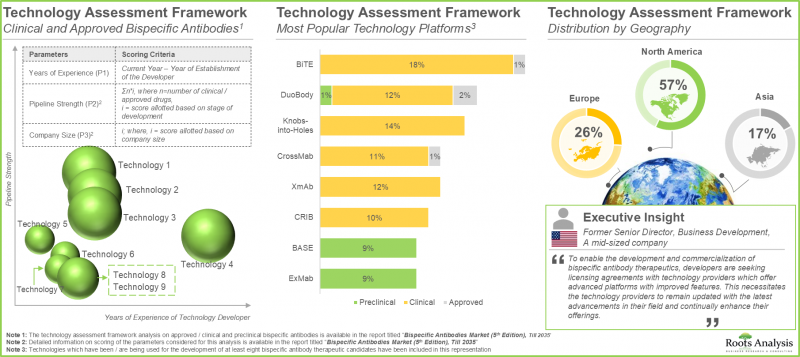
- In fact, industry stakeholders are engaged in the development of over 85 bispecific antibody technology platforms, aiming to mitigate the existing manufacturing challenges associated with such therapies.
- The growing interest is evident from the rise in partnership activity; companies are actively entering into strategic agreements in order to expand their bispecific antibody portfolio.
- Since 2010, nearly 280 clinical trials have been registered to evaluate the safety and efficacy of various bispecific antibody therapeutics; majority of these studies are being conducted across sites in the US.
- In order to efficiently promote these therapies, drug developers are actively exploring diverse promotional strategies with an aim to sustain their position in the market.
- With the growing focus on development pipeline and encouraging clinical results, the market is expected to witness an annualized growth rate of over 6.5%, during the next decade.
Bispecific Antibodies Market: Key Segments
Hematological Malignancies is the Fastest Growing Segment of Bispecific Antibodies Market
In terms of therapeutic area, the market is segmented into autoimmune disorders, genetic disorders, hematological malignancies, ophthalmic disorders, skin cancers and solid tumors. At present, genetic disorders hold the maximum share of the bispecific antibodies market. It is worth highlighting that the bispecific antibodies market for hematological malignancies is likely to grow at a relatively higher CAGR.
Bispecific Antibodies Acting Through T-Cell Retargeting / Activation Occupy the Largest Share During the Forecast Period
In terms of mechanism of action, the market is segmented into cytokines retargeting / neutralization, dual ligands blocking, resistance factors co-targeting, targeting tumor angiogenesis, T-cell retargeting / activation and others. Currently, T-cell retargeting / activation holds the maximum share of the bispecific antibodies market. However, bispecific antibodies acting through cytokines retargeting / neutralization are anticipated to capture the highest market in the near future.
Bispecific Antibodies Targeting CD3 x BCMA is the Fastest Growing Segment of the Market
In terms of target antigen, the market is segmented into C5-Albumin,CD20 x CD3, CD3 x BCMA, CD3 x CD19, EGFR x cMET, EpCAM x CD3, Factor IXa x Factor X, gp100 x CD3, HER2 x HER2, PD-1 x CTLA-4, PD-L1 x TGFB, TNF-a x HSA, VEGF x DLL4 and VEGF-A x ANG2. At present, therapies targeting factor IXa x factor X holds the maximum share of the bispecific antibodies market. It is worth highlighting that the drugs intended to target CD3 x BCMA are likely to grow at a relatively higher CAGR.
Asymmetric Bispecific Antibodies are Likely to Dominate the Market During the Forecast Period
In terms of antibody format, the market is segmented into asymmetric and fragments. Currently, asymmetric antibodies hold the maximum share of the bispecific antibodies market. This trend is unlikely to change in the foreseeable future.
North America Accounts for the Largest Share of the Market
In terms of key geographical regions, the market is segmented into North America, Europe, Asia-Pacific and rest of the world. We anticipate North America to capture the majority of the bispecific antibodies market. Further, it is worth highlighting that Europe is expected to grow at a higher CAGR over the coming years.
Example Players in the Bispecific Antibodies Market
- Akeso Biopharma
- Alexion
- Amgen
- Genmab
- Immunocore
- Janssen Research & Development
- Linton Pharm
- Merck
- OncXerna Therapeutics
- Pfizer
- Roche
- Taisho Pharmaceutical
- Zymeworks
Primary Research Overview
The opinions and insights presented in this study were influenced by discussions conducted with multiple stakeholders. The research report features detailed transcripts of interviews held with the following industry stakeholders:
- Senior Scientist, Company A
- Business Development Consultant, Company B
- Director (GMP Clinical Manufacturing), Company C
- Former Senior Director, Business Development, Company D
- Founder and Chief Scientific Officer and Chief Executive Officer, Company E
- PhD Student, Company F
Bispecific Antibodies Market: Research Coverage
- Market Sizing and Opportunity Analysis: The report features an in-depth analysis of the bispecific antibodies market, focusing on key market segments, including [A] therapeutic area, [B] mechanism of action, [C] target antigen, [D] antibody format and [E] Key geographical regions.
- Market Landscape 1: A comprehensive evaluation of bispecific antibodies that are either approved or being evaluated in different stages of clinical development, considering various parameters, such as [A] developer company, [B] phase of development, [C] target antigen, [D] type of therapy, [E] route of administration, [F] method of administration, [G] target indication, [H] therapeutic area, [I] disease segment, [J] year of establishment, [K] company size and [L] location of headquarter.
- Market Landscape 2: A comprehensive evaluation of bispecific antibodies that are currently being evaluated in preclinical studies, considering various parameters, such as [A] developer company, [B] stage of development, [C] target antigen, [D] therapeutic area, [E] disease segment, [F] year of establishment, [G] company size and [H] location of headquarters of the developer.
- Key Insights: A detailed analysis, encompassing the contemporary bispecific antibody therapeutics market trends, based on relevant parameters, such as [A] phase of development and route of administration, [B] phase of development and disease segment, and [C] phase of development and location of their headquarters. In addition, this chapter includes various representations of preclinical stage bispecific antibody therapeutics based on [D] stage of development and disease segment, and [E] stage of development and location of their headquarters. Further, the chapter also includes representation of the developers of bispecific antibody therapeutics based on [F] stage of development (preclinical, clinical and preclinical and clinical) of their drug candidates and [G] location of their headquarters.
- Technology Assessment Framework: A detailed assessment of technology platforms being developed / used by various drug developers for the production of bispecific antibody therapeutics, based on multiple relevant parameters, such as [A] clinical / preclinical pipeline strength, [B] developer's years of experience, [C] company size and [D] location of headquarters of developers.
- Big Pharma Analysis: A comprehensive examination of various initiatives focused on bispecific antibody therapeutics undertaken by major pharmaceutical companies. This analysis includes heat map visualizations that illustrate the distribution of leading pharmaceutical firms, as well as spider web diagrams that compare their initiatives across multiple relevant parameters.
- Company Profiles: In-depth profiles of key industry players engaged in the development of bispecific antibodies across various geographies, focusing on [A] company overviews, [B] financial information (if available), [C] drug portfolio, [D] recent developments and [E] an informed future outlook.
- Partnerships and Collaborations: An analysis of partnerships established in this sector, since 2016, based on several parameters, such as [A] year of partnership, [B] type of partnership, [C] disease segment, [D] type of payment model employed, [E] deal amount, [F] most active players (in terms of number of deals inked), [G] most popular technologies (in terms of number of deals inked for technologies). This section also highlights the regional distribution of partnership activity in this market.
- Contract Services for Bispecific Antibody Therapeutics: A review on the key steps involved and challenges associated with the manufacturing of bispecific antibodies. In addition, this section includes a list of contract manufacturing organizations (CMOs) and biologics contract research organization (CROs), highlighting the key considerations for bispecific antibody developers, while selecting a suitable CRO / CMO.
- Clinical Trial Analysis: Examination of completed, ongoing, and planned clinical studies of various bispecific antibody therapeutics based on parameters like [A] trial registration year, [B] trial phase, [C] trial recruitment status, [D] enrolled patient population, [E] type of study, [F] study design, [G] type of sponsor / collaborator, [H] leading industry and non-industry players, [I] key focus areas and [J] geographical location of trials.
- Case Study 1: A discussion on general regulatory guidelines issued by the ICH, WHO and FDA for the development of bispecific antibodies. In addition, it provides details related to the responses of various pharmaceutical industries to the FDA guidelines.
- Case Study 2: A review of different channels used for promoting marketed bispecific antibodies, along with examples of players that have undertaken such initiatives, elaborating on the various promotional strategies being adopted by developers of two approved bispecific antibodies, namely Blincyto(R) and Hemlibra(R), and comparison of both the drugs based on information available on their respective websites.
- SWOT Analysis: A SWOT analysis, focusing on key drivers and challenges that are likely to impact the industry's evolution. Further, it includes a Harvey ball analysis, highlighting the relative effect of each SWOT parameter on the overall industry.
Key Questions Answered in this Report
- How many companies are currently engaged in this market?
- Which are the leading companies in this market?
- What kind of partnership models are commonly adopted by industry stakeholders?
- What are the factors that are likely to influence the evolution of this market?
- What is the current and future market size?
- What is the CAGR of this market?
- How is the current and future market opportunity likely to be distributed across key market segments?
Reasons to Buy this Report
- The report provides a comprehensive market analysis, offering detailed revenue projections of the overall market and its specific sub-segments. This information is valuable to both established market leaders and emerging entrants.
- Stakeholders can leverage the report to gain a deeper understanding of the competitive dynamics within the market. By analyzing the competitive landscape, businesses can make informed decisions to optimize their market positioning and develop effective go-to-market strategies.
- The report offers stakeholders a comprehensive overview of the market, including key drivers, barriers, opportunities, and challenges. This information empowers stakeholders to stay abreast of market trends and make data-driven decisions to capitalize on growth prospects.
Additional Benefits
- Complimentary PPT Insights Packs
- Complimentary Excel Data Packs for all Analytical Modules in the Report
- 15% Free Content Customization
- Detailed Report Walkthrough Session with Research Team
- Free Updated report if the report is 6-12 months old or older
TABLE OF CONTENTS
1. PREFACE
- 1.1. Introduction
- 1.2. Key Market Insights
- 1.3. Scope of the Report
- 1.4. Research Methodology
- 1.5. Frequently Asked Questions
- 1.6. Chapter Outlines
2. EXECUTIVE SUMMARY
3. INTRODUCTION
- 3.1. Chapter Overview
- 3.2. Introduction to Antibodies
- 3.2.1. Structure
- 3.2.2. Functions
- 3.2.3. Mechanism of Action
- 3.3. Antibody Therapeutics
- 3.3.1. Historical Evolution of Antibody Therapeutics
- 3.3.2. Key Approved Antibody Therapeutics
- 3.3.3. Advanced Antibody Therapeutics
- 3.3.3.1. Fc Engineered and Glycoengineered Antibodies
- 3.3.3.2. Antibody Fragments
- 3.3.3.3. Fusion Proteins
- 3.3.3.4. Intrabodies
- 3.3.3.5. Bispecific Antibodies
- 3.4. Bispecific Antibody Formats
- 3.4.1. Single-Chain-based Formats (Fc Independent Antibody Formats)
- 3.4.1.1. Tandem scFvs (single-chain variable fragments) and Triple bodies
- 3.4.1.2. Bispecific Single-Domain Antibody Fusion Proteins
- 3.4.1.3. Diabodies / Diabody Derivatives
- 3.4.1.4. Fusion Proteins
- 3.4.1.5. Fusion Proteins Devoid of Fc Regions
- 3.4.2. Immunoglobulin G Based Formats (Fc Dependent Antibody Formats)
- 3.4.2.1. Quadromas
- 3.4.2.2. Knobs-Into-Holes
- 3.4.2.3. Dual Variable Domain Ig
- 3.4.2.4. IgG-scFv
- 3.4.2.5. Two-in-one or Dual Action Fab (DAF) Antibodies
- 3.4.2.6. Half Molecule Exchange
- 3.4.2.7. κλ- Bodies
- 3.4.1. Single-Chain-based Formats (Fc Independent Antibody Formats)
- 3.5. Mechanism of Action of Bispecific Antibody Therapeutics
- 3.5.1. Retargeting Immune Effectors (NK Cells and T Cells) to Tumor Cells
- 3.5.2. Directly Targeting Malignant / Tumor Cells
- 3.5.3. Retargeting of Toxins
- 3.5.4. Targeting Tumor Angiogenesis
- 3.5.5. Other Mechanisms
- 3.6. Applications of Bispecific Antibodies
4. MARKET LANDSCAPE OF APPROVED AND CLINICAL THERAPIES
- 4.1. Chapter Overview
- 4.2. Approved and Clinical Bispecific Antibody Therapeutics: Overall Market Landscape
- 4.2.1. Analysis by Phase of Development
- 4.2.2. Analysis by Target Antigen
- 4.2.3. Analysis by Type of Therapy
- 4.2.4. Analysis by Route of Administration
- 4.2.5. Analysis by Method of Administration
- 4.2.6. Analysis by Target Indication
- 4.2.7. Analysis by Therapeutic Area
- 4.2.8. Analysis by Disease Segment
- 4.3. Approved and Clinical Bispecific Antibody Therapeutics: Overall Developer Landscape
- 4.3.1. Analysis by Year of Establishment
- 4.3.2. Analysis by Company Size
- 4.3.3. Analysis by Location of Headquarters
5. MARKET LANDSCAPE OF PRECLINICAL THERAPIES
- 5.1. Chapter Overview
- 5.2. Preclinical Bispecific Antibody Therapeutics: Overall Market Landscape
- 5.2.1. Analysis by Stage of Development
- 5.2.2. Analysis by Target Antigen
- 5.2.3. Analysis by Therapeutic Area and Disease Segment
- 5.3. Preclinical Bispecific Antibody Therapeutics: Overall Developer Landscape
- 5.3.1. Analysis by Year of Establishment
- 5.3.2. Analysis by Company Size
- 5.3.3. Analysis by Location of Headquarters
6. KEY INSIGHTS
- 6.1. Chapter Overview
- 6.2. Approved and Clinical Stage Bispecific Antibody Therapeutics Landscape: Key Insights
- 6.2.1. Analysis by Phase of Development and Route of Administration
- 6.2.2. Analysis by Phase of Development and Disease Segment
- 6.2.3. Analysis by Phase of Development and Location of Developer's Headquarters
- 6.3. Preclinical Stage Bispecific Antibody Therapeutics Landscape: Key Insights
- 6.3.1. Analysis by Stage of Development and Therapeutic Area
- 6.3.2. Analysis by Stage of Development and Location of Developer Headquarters
- 6.4. Bispecific Antibody Therapeutic Developers Landscape: Key Insights
- 6.4.1. Distribution by Stage of Development
- 6.4.2. Distribution by Stage of Development and Region of Developer Headquarters
7. TECHNOLOGY ASSESSMENT FRAMEWORK
- 7.1. Chapter Overview
- 7.2. Bispecific Antibody Therapeutics: List of Technology Platforms
- 7.3. Bispecific Antibody Technology Platforms: Comparative Analysis
- 7.3.1. Analysis by Technologies for Approved and Clinical Drugs
- 7.3.2. Analysis by Technologies for Preclinical Drugs
- 7.4. Most Popular Technology Platforms: Analysis by Stage of Development
- 7.5. Bispecific Antibody Technology Platform Developers: Analysis by Location of Headquarters
8. BIG PHARMA PLAYERS: BENCHMARKING ANALYSIS
- 8.1. Chapter Overview
- 8.2. Big Pharma Players: Benchmarking Analysis (Spider Web Representation)
- 8.3. Big Pharma Players: Comparative Clinical Pipeline Analysis
- 8.3.1. Analysis by Target Antigen
- 8.3.2. Analysis by Antibody Format
- 8.3.3. Analysis by Mechanism of Action
- 8.3.4. Analysis by Therapeutic Area
9. COMPANY PROFILES
- 9.1. Chapter Overview
- 9.2. Akeso Biopharma
- 9.2.1. Company Overview
- 9.2.2. Financial Performance
- 9.2.3. Drug Portfolio
- 9.2.4. Recent Developments and Future Outlook
- 9.3. Alphamab Oncology
- 9.3.1. Company Overview
- 9.3.2. Financial Performance
- 9.3.3. Drug Portfolio
- 9.3.4. Recent Developments and Future Outlook
- 9.4. Amgen
- 9.4.1. Company Overview
- 9.4.2. Financial Performance
- 9.4.3. Drug Portfolio
- 9.4.4. Recent Developments and Future Outlook
- 9.5. Merck
- 9.5.1. Company Overview
- 9.5.2. Financial Performance
- 9.5.3. Drug Portfolio
- 9.5.4. Recent Developments and Future Outlook
- 9.6. Regeneron
- 9.6.1. Company Overview
- 9.6.2. Financial Performance
- 9.6.3. Drug Portfolio
- 9.6.4. Recent Developments and Future Outlook
- 9.7. Roche
- 9.7.1. Company Overview
- 9.7.2. Financial Performance
- 9.7.3. Drug Portfolio
- 9.7.4. Recent Developments and Future Outlook
- 9.8. Xencor
- 9.8.1. Company Overview
- 9.8.2. Financial Performance
- 9.8.3. Drug Portfolio
- 9.8.4. Recent Developments and Future Outlook
10. PARTNERSHIPS AND COLLABORATIONS
- 10.1. Chapter Overview
- 10.2. Partnership Models
- 10.3. Bispecific Antibody Therapeutics: Partnerships and Collaborations
- 10.3.1. Analysis by Year of Partnership
- 10.3.2. Analysis by Type of Partnership
- 10.3.3. Analysis by Year and Type of Partnership
- 10.3.4. Analysis by Disease Segment
- 10.3.5. Analysis by Type of Payment Model Employed and Deal Amount
- 10.3.6. Analysis by Year of Agreement, Type of Payment Model Employed and Deal Amount
- 10.3.7. Analysis by Disease Segment, Type of Payment Model Employed and Deal Amount
- 10.3.8. Most Active Players: Analysis by Number of Partnership Instances
- 10.3.9. Most Popular Technologies: Analysis by Number of Partnership Instances
- 10.3.10. Analysis by Region
- 10.3.11. Intercontinental and Intracontinental Agreements
11. CONTRACT SERVICES FOR BISPECIFIC ANTIBODY THERAPEUTICS
- 11.1. Chapter Overview
- 11.2. Manufacturing of Bispecific Antibody Therapeutics
- 11.2.1. Key Considerations for Manufacturing and Associated Challenges
- 11.2.2. Contract Manufacturing Organizations (CMOs)
- 11.2.2.1. Bispecific Antibody Therapeutics: List of CMOs
- 11.2.3. Contract Research Organizations (CROs)
- 11.2.3.1. Bispecific Antibody Therapeutics: List of CROs
- 11.3. Key Considerations for Selecting a Suitable CMO / CRO Partner
12. CLINICAL TRIAL ANALYSIS
- 12.1. Chapter Overview
- 12.2. Key Assumptions and Methodology
- 12.3. Bispecific Antibody Therapeutics: Clinical Trial Analysis
- 12.3.1. Analysis by Trial Registration Year
- 12.3.2. Analysis of Enrolled Patient Population by Trial Registration Year
- 12.3.3. Analysis by Trial Phase
- 12.3.4. Analysis of Enrolled Patient Population by Trial Phase
- 12.3.5. Analysis by Trial Recruitment Status
- 12.3.6. Analysis by Trial Registration Year and Trial Recruitment Status
- 12.3.7. Analysis by Type of Study
- 12.3.8. Analysis by Study Design
- 12.3.9. Analysis by Type of Sponsor / Collaborator
- 12.3.10. Leading Industry Players: Analysis by Number of Registered Trials
- 12.3.11. Leading Non-Industry Players: Analysis by Number of Registered Trials
- 12.3.12. Clinical Trial Analysis: Key Focus Areas (Word Cloud Representation)
- 12.3.13. Analysis by Geography
- 12.3.14. Analysis by Trial Recruitment Status and Geography
- 12.3.15. Analysis of Enrolled Patient Population by Trial Recruitment Status and Geography
13. CASE STUDY: REGULATORY GUIDELINES FOR BISPECIFIC ANTIBODIES
- 13.1. Chapter Overview
- 13.2. Guidelines Issued by Regulatory Authorities
- 13.2.1. US Food and Drug Administration (FDA)
- 13.2.1.1. Pharma Companies' Response to the FDA Draft Guidance
- 13.2.2. World Health Organization (WHO)
- 13.2.1. US Food and Drug Administration (FDA)
14. CASE STUDY: PROMOTIONAL / MARKETING STRATEGIES
- 14.1. Chapter Overview
- 14.2. Key Channels Used for Promotional Campaigns
- 14.2.1. Product Websites
- 14.2.2. Patient Assistance Programs
- 14.2.3. Participation in Conferences
- 14.2.4. Collaboration with Stakeholders
- 14.2.5. Drug Approval Across Multiple Geographies
- 14.3. Other Channels Used for Promotional and Marketing Strategies
- 14.4. Summary: Promotional and Marketing Strategy Leveraged by Bispecific Antibody Developers
- 14.5. Promotional Analysis: Blincyto(R)
- 14.5.1. Drug Overview
- 14.5.2. Product Website analysis
- 14.5.2.1. Messages for Healthcare Professionals
- 14.5.2.1.1. For MRD Positive B-cell precursor ALL
- 14.5.2.1.2. For Relapsed or Refractory B-cell precursor ALL
- 14.5.2.2. Messages for Patients
- 14.5.2.1. Messages for Healthcare Professionals
- 14.5.3. Patient Support Services and Informative Downloads
- 14.5.4. Other Promotional Strategies
- 14.5.4.1. Presence in Conferences
- 14.6. Promotional Analysis: Hemlibra(R)
- 14.6.1. Drug Overview
- 14.6.2. Product Website Analysis
- 14.6.2.1. Messages for Healthcare Professionals
- 14.6.2.1.1. For Hemophilia A without Factor VIII Inhibitors
- 14.6.2.1.2. For Hemophilia A with Factor VIII Inhibitors
- 14.6.2.3. Messages for Patients
- 14.6.2.1. Messages for Healthcare Professionals
- 14.6.3. Patient Support Services and Informative Downloads
- 14.6.3.1. Co-pay Program
- 14.6.3.2. Independent Co-pay Assistance Foundation
- 14.6.3.3. Genentech Patient Foundation
- 14.6.4. Other Promotional Strategies
- 14.6.4.1. Presence in Conferences
15. MARKET FORECAST AND OPPORTUNITY ANALYSIS
- 15.1. Chapter Overview
- 15.2. Scope and Limitations
- 15.3. Forecast Methodology and Key Assumptions
- 15.4. Bispecific Antibody Therapeutics Market, till 2035
- 15.4.1. Bispecific Antibody Therapeutics Market: Analysis by Therapeutic Area, Current Year and 2035
- 15.4.2. Bispecific Antibody Therapeutics Market: Analysis by Mechanism of Action, Current Year and 2035
- 15.4.3. Bispecific Antibody Therapeutics Market: Analysis by Target Antigen, Current Year and 2035
- 15.4.4. Bispecific Antibody Therapeutics Market: Analysis by Antibody Format, Current Year and 2035
- 15.4.5. Bispecific Antibody Therapeutics Market: Analysis by Key Players, Current Year and 2035
- 15.4.6. Bispecific Antibody Therapeutics Market: Analysis by Geography, Current Year and 2035
- 15.5. Bispecific Antibody Market: Value Creation Analysis
- 15.6. Bispecific Antibody Therapeutics Market: Product-wise Sales Forecasts
- 15.6.1. AK104 (Akeso Biopharma)
- 15.6.1.1. Target Patient Population
- 15.6.1.2. Sales Forecast
- 15.6.1.3. Net Present Value
- 15.6.1.4. Value Creation Analysis
- 15.6.2. Blincyto(TM) (Amgen)
- 15.6.2.1. Target Patient Population
- 15.6.2.2. Sales Forecast
- 15.6.2.3. Net Present Value
- 15.6.2.4. Value Creation Analysis
- 15.6.3. Hemlibra(R) (Roche)
- 15.6.3.1. Target Patient Population
- 15.6.3.2. Sales Forecast
- 15.6.3.3. Net Present Value
- 15.6.3.4. Value Creation Analysis
- 15.6.4. Kimmtrak(R) (Immunocore)
- 15.6.4.1. Target Patient Population
- 15.6.4.2. Sales Forecast
- 15.6.4.3. Net Present Value
- 15.6.4.4. Value Creation Analysis
- 15.6.5. Lunsumio(R) (Roche)
- 15.6.5.1. Target Patient Population
- 15.6.5.2. Sales Forecast
- 15.6.5.3. Net Present Value
- 15.6.5.4. Value Creation Analysis
- 15.6.6. Nanozora(R) (Taisho Pharmaceutical)
- 15.6.6.1. Target Patient Population
- 15.6.6.2. Sales Forecast
- 15.6.6.3. Net Present Value
- 15.6.6.4. Value Creation Analysis
- 15.6.7. Rybrevant(TM) (Janssen Research & Development)
- 15.6.7.1. Target patient Population
- 15.6.7.2. Sales Forecast
- 15.6.7.3. Net Present Value
- 15.6.7.4. Value Creation Analysis
- 15.6.8. Tecvayli(TM) (Janssen Research & Development)
- 15.6.8.1. Target Patient Population
- 15.6.8.2. Sales Forecast
- 15.6.8.3. Net Present Value
- 15.6.8.4. Value Creation Analysis
- 15.6.9. Vabysmo(TM) (Roche)
- 15.6.9.1. Target Patient Population
- 15.6.9.2. Sales Forecast
- 15.6.9.3. Net Present Value
- 15.6.9.4. Value Creation Analysis
- 15.6.10. AK112 (Akeso Biopharma)
- 15.6.10.1. Target Patient Population
- 15.6.10.2. Sales Forecast
- 15.6.10.3. Net Present Value
- 15.6.10.4. Value Creation Analysis
- 15.6.11. ALXN1720 (Alexion)
- 15.6.11.1. Target Patient Population
- 15.6.11.2. Sales Forecast
- 15.6.11.3. Net Present Value
- 15.6.11.4. Value Creation Analysis
- 15.6.12. GEN3013 (Genmab)
- 15.6.12.1. Target Patient Population
- 15.6.12.2. Sales Forecast
- 15.6.12.3. Net Present Value
- 15.6.12.4. Value Creation Analysis
- 15.6.13. Glofitamab (Roche)
- 15.6.13.1. Target Patient Population
- 15.6.13.2. Sales Forecast
- 15.6.13.3. Net Present Value
- 15.6.13.4. Value Creation Analysis
- 15.6.14. LP000 (Linton Pharm)
- 15.6.14.1. Target Patient Population
- 15.6.14.2. Sales Forecast
- 15.6.14.3. Net Present Value
- 15.6.14.4. Value Creation Analysis
- 15.6.15. M7824 (Merck)
- 15.6.15.1. Target Patient Population
- 15.6.15.2. Sales Forecast
- 15.6.15.3. Net Present Value
- 15.6.15.4. Value Creation Analysis
- 15.6.16. OMP 305B83 (Mereo BioPharma)
- 15.6.16.1. Target Patient Population
- 15.6.16.2. Sales Forecast
- 15.6.16.3. Net Present Value
- 15.6.16.4. Value Creation Analysis
- 15.6.17. PF-06863135 (Pfizer)
- 15.6.17.1. Target Patient Population
- 15.6.17.2. Sales Forecast
- 15.6.17.3. Net Present Value
- 15.6.17.4. Value Creation Analysis
- 15.6.18. ZW25 (Zymeworks)
- 15.6.18.1. Target Patient Population
- 15.6.18.2. Sales Forecast
- 15.6.18.3. Net Present Value
- 15.6.18.4. Value Creation Analysis
- 15.6.1. AK104 (Akeso Biopharma)
- 15.7. Concluding Remarks
16. SWOT ANALYSIS
- 16.1. Chapter Overview
- 16.2. Strengths
- 16.2.1. Enhanced Specificity
- 16.2.2. Diverse Application Areas
- 16.2.3. Lower Drug Resistance
- 16.2.4. Success of Approved Products
- 16.3. Weaknesses
- 16.3.1. Uncertainties with Safety of Therapeutic Candidates
- 16.3.2. Complex Purification and Downstream Processing
- 16.3.3. Dimerization in Antibodies with Fc-region
- 16.4. Opportunities
- 16.4.1. Life Cycle Management of Novel Therapies
- 16.4.2. Growing Number of High Value Partnerships
- 16.4.3. Expertise Available with Contract Manufacturing Organizations
- 16.4.4. Emergence of Advanced Technologies
- 16.5. Threats
- 16.5.1. Rise in Attrition Rate of Clinical Stage Candidates
- 16.6. Concluding Remarks
17. CONCLUDING REMARKS
18. EXECUTIVE INSIGHTS
- 18.1. Chapter Overview
- 18.2. Company A
- 18.2.1. Company Snapshot
- 18.2.2. Interview Transcript: Senior Scientist
- 18.3. Company B
- 18.3.1. Company Snapshot
- 18.3.2. Interview Transcript: PhD Student
- 18.4. Company C
- 18.4.1. Company Snapshot
- 18.4.2. Interview Transcript: Founder and Chief Scientific Officer, and Chief Executive Officer
- 18.5. Company D
- 18.5.1. Company Snapshot
- 18.5.2. Interview Transcript: Former Senior Director, Business Development
- 18.6. Company E
- 18.6.1. Company Snapshot
- 18.6.2. Interview Transcript: Business Development Consultant
- 18.7. Company F
- 18.7.1. Company Snapshot
- 18.7.2. Interview Transcript: Director, GMP Clinical Manufacturing
19. APPENDIX 1: TABULATED DATA
20. APPENDIX 2: LIST OF COMPANIES AND ORGANIZATION
List of Tables
- Table 3.1. Isotypes of Mammalian Antibodies
- Table 3.2. Mechanisms of Action of Antibody Therapeutics
- Table 3.3. Revenue of Top Antibody Therapeutics (USD Billion)
- Table 4.1. Bispecific Antibody Therapeutics: Information on Approved and Clinical Drug Candidates, Developer(s), Phase of Development and Target Antigen
- Table 4.2. Bispecific Antibody Therapeutics: Information on Approved and Clinical Drug Candidates, Type of Therapy, Route of Administration and Method of Administration
- Table 4.3. Bispecific Antibody Therapeutics: Information on Approved and Clinical Drug Candidates, Target Indication(s), Therapeutic Area(s) and Disease Segment(s)
- Table 4.4. Bispecific Antibody Therapeutic Developers: Information on Approved and Clinical Drug Candidates Developers, Year of Establishment, Company Size, Location of Headquarters
- Table 5.1. Bispecific Antibody Therapeutics: Information on Preclinical Drug Candidates, Developer(s), Stage of Development and Target Antigen
- Table 5.2. Bispecific Antibody Therapeutics: Information on Preclinical Drug Candidates, Developer(s), Therapeutic Area(s) and Disease Segment(s)
- Table 5.3. Bispecific Antibody Therapeutic Developers: Information on Preclinical Drug Candidates Developers, Year of Establishment, Company Size, Location of Headquarters
- Table 7.1. Bispecific Antibody Therapeutics: List of Technology Platforms
- Table 9.1. Bispecific Antibody Therapeutic Developers: List of Companies Profiled
- Table 9.2. Akeso Biopharma: Company Overview
- Table 9.3. Akeso Biopharma: Bispecific Antibody Therapeutics Portfolio
- Table 9.4. Akeso Biopharma: Recent Developments and Future Outlook
- Table 9.5. Alphamab Oncology: Company Overview
- Table 9.6. Alphamab Oncology: Bispecific Antibody Therapeutics Portfolio
- Table 9.7. Alphamab Oncology: Recent Developments and Future Outlook
- Table 9.8. Amgen: Company Overview
- Table 9.9. Amgen: Bispecific Antibody Therapeutics Portfolio
- Table 9.10. Amgen: Recent Developments and Future Outlook
- Table 9.11. Merck: Company Overview
- Table 9.12. Merck: Bispecific Antibody Therapeutics Portfolio
- Table 9.13. Merck: Recent Developments and Future Outlook
- Table 9.14. Regeneron: Company Overview
- Table 9.15. Regeneron: Bispecific Antibody Therapeutics Portfolio
- Table 9.16. Regeneron: Recent Developments and Future Outlook
- Table 9.17. Roche: Company Overview
- Table 9.18. Roche: Bispecific Antibody Therapeutics Portfolio
- Table 9.19. Roche: Recent Developments and Future Outlook
- Table 9.20. Xencor: Company Overview
- Table 9.21. Xencor: Bispecific Antibody Therapeutics Portfolio
- Table 9.22. Xencor: Recent Developments and Future Outlook
- Table 10.1. Partnerships and Collaborations: Information on Year of Agreement, Partner and Type of Agreement, since 2016
- Table 10.2. Partnerships and Collaborations: Information on Type of Agreement (Region-wise and Geography-wise), since 2016
- Table 11.1. List of Bispecific Antibody CMOs: Company Specifications
- Table 11.2. List of Bispecific Antibody CMOs: Information on Scale of Operation
- Table 11.3. List of Bispecific Antibody CROs: Company Specifications
- Table 11.4. List of Bispecific Antibody CROs: Information on Type of Service
- Table 11.5. Comparison of Key Factors for the Selection of Contract Service Provider: Harvey Ball Analysis
- Table 14.1. List of Bispecific Antibodies Approved Across Various Geographies
- Table 15.1. Bispecific Antibody Therapeutics: Expected Launch Years of Advanced Stage Drug Candidates
- Table 15.2. AK104: Target Patient Population
- Table 15.3. AK104: Net Present Value (USD Million)
- Table 15.4. AK104: Value Creation Analysis (USD Million)
- Table 15.5. Blincyto(R): Target Patient Population
- Table 15.6. Blincyto(R): Net Present Value (USD Million)
- Table 15.7. Blincyto(R): Value Creation Analysis (USD Million)
- Table 15.8. Hemlibra(R): Target Patient Population
- Table 15.9. Hemlibra(R): Net Present Value (USD Million)
- Table 15.10. Hemlibra(R): Value Creation Analysis (USD Million)
- Table 15.11. Kimmtrak(R): Target Patient Population
- Table 15.12. Kimmtrak(R): Net Present Value (USD Million)
- Table 15.13. Kimmtrak(R): Value Creation Analysis (USD Million)
- Table 15.14. Lunsumio(R): Target Patient Population
- Table 15.15. Lunsumio(R): Net Present Value (USD Million)
- Table 15.16. Lunsumio(R): Value Creation Analysis (USD Million)
- Table 15.17. Nanozora(R): Target Patient Population
- Table 15.18. Nanozora(R): Net Present Value (USD Million)
- Table 15.19. Nanozora(R): Value Creation Analysis (USD Million)
- Table 15.20. Rybrevant(TM): Target Patient Population
- Table 15.21. Rybrevant(TM): Net Present Value (USD Million)
- Table 15.22. Rybrevant(TM): Value Creation Analysis (USD Million)
- Table 15.23. Tecvayli(TM): Target Patient Population
- Table 15.24. Tecvayli(TM): Net Present Value (USD Million)
- Table 15.25. Tecvayli(TM): Value Creation Analysis (USD Million)
- Table 15.26. Vabysmo(TM): Target Patient Population
- Table 15.27. Vabysmo(TM): Net Present Value (USD Million)
- Table 15.28. Vabysmo(TM): Value Creation Analysis (USD Million)
- Table 15.29. AK112: Target Patient Population
- Table 15.30. AK112: Net Present Value (USD Million)
- Table 15.31. AK112: Value Creation Analysis (USD Million)
- Table 15.32. ALXN1720: Target Patient Population
- Table 15.33. ALXN1720: Net Present Value (USD Million)
- Table 15.34. ALXN1720: Value Creation Analysis (USD Million)
- Table 15.35. GEN3013: Target Patient Population
- Table 15.36. GEN3013: Net Present Value (USD Million)
- Table 15.37. GEN3013: Value Creation Analysis (USD Million)
- Table 15.38. Glofitamab: Target Patient Population
- Table 15.39. Glofitamab: Net Present Value (USD Million)
- Table 15.40. Glofitamab: Value Creation Analysis (USD Million)
- Table 15.41. LP000: Target Patient Population
- Table 15.42. LP000: Net Present Value (USD Million)
- Table 15.43. LP000: Value Creation Analysis (USD Million)
- Table 15.44. M7824: Target Patient Population
- Table 15.45. M7824: Net Present Value (USD Million)
- Table 15.46. M7824: Value Creation Analysis (USD Million)
- Table 15.47. OMP 305B83: Target Patient Population
- Table 15.48. OMP 305B83: Net Present Value (USD Million)
- Table 15.49. OMP 305B83: Value Creation Analysis (USD Million)
- Table 15.50. PF-06863135: Target Patient Population
- Table 15.51. PF-06863135: Net Present Value (USD Million)
- Table 15.52. PF-06863135: Value Creation Analysis (USD Million)
- Table 15.53. ZW25: Target Patient Population
- Table 15.54. ZW25: Net Present Value (USD Million)
- Table 15.55. ZW25: Value Creation Analysis (USD Million)
- Table 18.1. Immunai: Company Snapshot
- Table 18.2. University of Freiburg: Organization Snapshot
- Table 18.3. SYNIMMUNE: Company Snapshot
- Table 18.4. CytomX Therapeutics: Company Snapshot
- Table 18.5. F-star: Company Snapshot
- Table 18.6. Innovent Biologics: Company Snapshot
- Table 19.1. Approved and Clinical Bispecific Antibody Therapeutics: Distribution by Phase of Development
- Table 19.2. Approved and Clinical Bispecific Antibody Therapeutics: Distribution by Target Antigen
- Table 19.3. Approved and Clinical Bispecific Antibody Therapeutics: Distribution by Type of Therapy
- Table 19.4. Approved and Clinical Bispecific Antibody Therapeutics: Distribution by Route of Administration
- Table 19.5. Approved and Clinical Bispecific Antibody Therapeutics: Distribution by Method of Administration
- Table 19.6. Approved and Clinical Bispecific Antibody Therapeutics: Distribution by Target Indication
- Table 19.7. Approved and Clinical Bispecific Antibody Therapeutics: Distribution by Therapeutic Area
- Table 19.8. Approved and Clinical Bispecific Antibody Therapeutics: Distribution by Disease Segment
- Table 19.9. Approved and Clinical Bispecific Antibody Therapeutic Developers: Distribution by Year of Establishment
- Table 19.10. Approved and Clinical Bispecific Antibody Therapeutic Developers: Distribution by Company Size
- Table 19.11. Approved and Clinical Bispecific Antibody Therapeutic Developers: Distribution by Location of Headquarters
- Table 19.12. Preclinical Bispecific Antibody Therapeutics: Distribution by Stage of Development
- Table 19.13. Preclinical Bispecific Antibody Therapeutics: Distribution by Target Antigen
- Table 19.14. Preclinical Bispecific Antibody Therapeutics: Distribution by Disease Segment
- Table 19.15. Preclinical Bispecific Antibody Therapeutic Developers: Distribution by Year of Establishment
- Table 19.16. Preclinical Bispecific Antibody Therapeutic Developers: Distribution by Company Size
- Table 19.17. Preclinical Bispecific Antibody Therapeutic Developers: Distribution by Location of Headquarters
- Table 19.18. Most Popular Technology Platforms: Distribution by Stage of Development
- Table 19.19. Bispecific Antibody Technology Platform Developers: Distribution by Location of Headquarters
- Table 19.20. Akeso Biopharma: Annual Revenues, FY 2019 Onwards (RMB Million)
- Table 19.21. Alphamab Oncology: Annual Revenues, FY 2019 Onwards (RMB Million)
- Table 19.22. Amgen: Annual Revenues, FY 2019 Onwards (USD Billion)
- Table 19.23. Merck: Annual Revenues, FY 2019 Onwards (EUR Billion)
- Table 19.24. Regeneron: Annual Revenues, FY 2019 Onwards (USD Billion)
- Table 19.25. Roche: Annual Revenues, FY 2019 Onwards (CHF Million)
- Table 19.26. Xencor: Annual Revenues, FY 2019 Onwards (USD Million)
- Table 19.27. Partnerships and Collaborations: Cumulative Year-wise Trend, since 2016
- Table 19.28. Partnerships and Collaborations: Distribution by Type of Partnership
- Table 19.29. Partnerships and Collaborations: Distribution by Disease Segment
- Table 19.30. Partnerships and Collaborations: Distribution by Type of Payment Model Employed and Deal Amount (USD Billion)
- Table 19.31. Partnerships and Collaborations: Year-wise Distribution by Type of Payment Model Employed and Deal Amount (USD Billion, since 2016)
- Table 19.32. Partnerships and Collaborations: Distribution by Disease Segment, Type of Payment Model Employed and Deal Amount (USD Billion)
- Table 19.33. Most Active Players: Distribution by Number of Partnership Instances
- Table 19.34. Most Popular Technologies: Distribution by Number of Partnership Instances
- Table 19.35. Partnerships and Collaborations: Distribution by Region
- Table 19.36. Partnerships and Collaborations: International and Intracontinental Agreements
- Table 19.37. Clinical Trial Analysis: Cumulative Year-wise Trend of Trials by Trial Registration Year
- Table 19.38. Clinical Trial Analysis: Distribution of Enrolled Patient Population by Trial Registration Year
- Table 19.39. Clinical Trial Analysis: Distribution by Trial Phase
- Table 19.40. Clinical Trial Analysis: Distribution of Enrolled Patient Population by Trial Phase
- Table 19.41. Clinical Trial Analysis: Distribution by Trial Recruitment Status
- Table 19.42. Clinical Trial Analysis: Cumulative Distribution by Trial Registration Year and Trial Recruitment Status
- Table 19.43. Clinical Trial Analysis: Distribution by Type of Study
- Table 19.44. Clinical Trial Analysis: Distribution by Study Design
- Table 19.45. Clinical Trial Analysis: Distribution by Type of Sponsor / Collaborator
- Table 19.46. Clinical Trial Analysis: Geographical Distribution by Trial Recruitment Status
- Table 19.47. Clinical Trial Analysis: Geographical Distribution of Enrolled Patient Population by Trial Recruitment Status
- Table 19.48. Bispecific Antibody Therapeutics Market, Conservative, Base, and Optimistic Scenarios, till 2035 (USD Million)
- Table 19.49. Bispecific Antibody Therapeutics Market: Distribution by Therapeutic Area, Conservative, Base, and Optimistic Scenarios, Current Year and 2035 (USD Million)
- Table 19.50. Bispecific Antibody Therapeutics Market: Distribution by Mechanism of Action, Conservative, Base, and Optimistic Scenarios, Current Year and 2035 (USD Million)
- Table 19.51. Bispecific Antibody Therapeutics Market: Distribution by Target Antigen, Conservative, Base, and Optimistic Scenarios, Current Year and 2035 (USD Million)
- Table 19.52. Bispecific Antibody Therapeutics Market: Distribution by Antibody Format, Conservative, Base, and Optimistic Scenarios, Current Year and 2035 (USD Million)
- Table 19.53. Bispecific Antibody Therapeutics Market: Distribution by Key Players, Conservative, Base, and Optimistic Scenarios, Current Year and 2035 (USD Million)
- Table 19.54. Bispecific Antibody Therapeutics Market: Distribution by Geography, Conservative, Base, and Optimistic Scenarios, Current Year and 2035 (USD Million)
- Table 19.55. AK104 (Akeso Biopharma) Sales Forecast, Till 2035, Conservative, Base, and Optimistic Scenarios (USD Million)
- Table 19.56. Blincyto(R) (Amgen) Sales Forecast, Till 2035, Conservative, Base, and Optimistic Scenarios (USD Million)
- Table 19.57. Hemlibra(R) (Roche) Sales Forecast, Till 2035, Conservative, Base, and Optimistic Scenarios (USD Million)
- Table 19.58. Kimmtrak(R) (Immunocore) Sales Forecast, Till 2035, Conservative, Base, and Optimistic Scenarios (USD Million)
- Table 19.59. Lunsumio(R) (Roche) Sales Forecast, Till 2035, Conservative, Base, and Optimistic Scenarios (USD Million)
- Table 19.60. Nanozora(R) (Taisho Pharmaceutical) Sales Forecast, Till 2035, Conservative, Base, and Optimistic Scenarios (USD Million)
- Table 19.61. Rybrevant(TM) (Janssen Research & Development) Sales Forecast, Till 2035, Conservative, Base, and Optimistic Scenarios (USD Million)
- Table 19.62. Tecvayli(TM) (Janssen Research & Development) Sales Forecast, Till 2035, Conservative, Base, and Optimistic Scenarios (USD Million)
- Table 19.63. Vabysmo(TM) (Roche) Sales Forecast, Till 2035, Conservative, Base, and Optimistic Scenarios (USD Million)
- Table 19.64. AK112 (Akeso Biopharma) Sales Forecast, Till 2035, Conservative, Base, and Optimistic Scenarios (USD Million)
- Table 19.65. ALXN1720 (Alexion) Sales Forecast, Till 2035, Conservative, Base, and Optimistic Scenarios (USD Million)
- Table 19.66. GEN3013 (Genmab) Sales Forecast, Till 2035, Conservative, Base, and Optimistic Scenarios (USD Million)
- Table 19.67. Glofitamab (Roche) Sales Forecast, Till 2035, Conservative, Base, and Optimistic Scenarios (USD Million)
- Table 19.68. LP000 (Linton Pharm) Sales Forecast, Till 2035, Conservative, Base, and Optimistic Scenarios (USD Million)
- Table 19.69. M7824 (Merck) Sales Forecast, Till 2035, Conservative, Base, and Optimistic Scenarios (USD Million)
- Table 19.70. OMP 305B83 (Mereo BioPharma) Sales Forecast, Till 2035, Conservative, Base, and Optimistic Scenarios (USD Million)
- Table 19.71. PF-06863135 (Pfizer) Sales Forecast, Till 2035, Conservative, Base, and Optimistic Scenarios (USD Million)
- Table 19.72. ZW25 (Zymeworks) Sales Forecast, Till 2035, Conservative, Base, and Optimistic Scenarios (USD Million)
List of Figures
- Figure 3.1. Historical Evolution of Antibody Therapeutics
- Figure 3.2. Basic Structure of an Antibody
- Figure 3.3. Revenues of Top 15 Drugs (USD Billion)
- Figure 3.4. Symmetric and Asymmetric Bispecific Antibodies
- Figure 4.1. Approved and Clinical Bispecific Antibody Therapeutics: Distribution by Phase of Development
- Figure 4.2. Approved and Clinical Bispecific Antibody Therapeutics: Distribution by Target Antigen
- Figure 4.3. Approved and Clinical Bispecific Antibody Therapeutics: Distribution by Type of Therapy
- Figure 4.4. Approved and Clinical Bispecific Antibody Therapeutics: Distribution by Route of Administration
- Figure 4.5. Approved and Clinical Bispecific Antibody Therapeutics: Distribution by Method of Administration
- Figure 4.6. Approved and Clinical Bispecific Antibody Therapeutics: Distribution by Target Indication
- Figure 4.7. Approved and Clinical Bispecific Antibody Therapeutics: Distribution by Therapeutic Area
- Figure 4.8. Approved and Clinical Bispecific Antibody Therapeutics: Distribution by Disease Segment
- Figure 4.9. Approved and Clinical Bispecific Antibody Therapeutic Developers: Distribution by Year of Establishment
- Figure 4.10. Approved and Clinical Bispecific Antibody Therapeutic Developers: Distribution by Company Size
- Figure 4.11. Approved and Clinical Bispecific Antibody Therapeutic Developers: Distribution by Location of Headquarters
- Figure 5.1. Preclinical Bispecific Antibody Therapeutics: Distribution by Stage of Development
- Figure 5.2. Preclinical Bispecific Antibody Therapeutics: Distribution by Target Antigen
- Figure 5.3. Preclinical Bispecific Antibody Therapeutics: Distribution by Disease Segment
- Figure 5.4. Preclinical Bispecific Antibody Therapeutic Developers: Distribution by Year of Establishment
- Figure 5.5. Preclinical Bispecific Antibody Therapeutic Developers: Distribution by Company Size
- Figure 5.6. Preclinical Bispecific Antibody Therapeutic Developers: Distribution by Location of Headquarters
- Figure 6.1. Approved and Clinical Stage Bispecific Antibody Therapeutics Landscape: Distribution by Phase of Development and Route of Administration
- Figure 6.2. Approved and Clinical Stage Bispecific Antibody Therapeutics Landscape: Distribution by Phase of Development and Disease Segment
- Figure 6.3. Approved and Clinical Stage Bispecific Antibody Therapeutics Landscape: Distribution by Phase of Development and Location of
Developer Headquarters
- Figure 6.4. Preclinical Stage Bispecific Antibody Therapeutics Landscape: Distribution by Stage of Development and Disease Segment
- Figure 6.5. Preclinical Stage Bispecific Antibody Therapeutics Landscape: Distribution by Stage of Development and Location of Developer Headquarters
- Figure 6.6. Bispecific Antibody Therapeutic Developers Landscape: Distribution by Stage of Development
- Figure 6.7. Bispecific Antibody Therapeutic Developers Landscape: Distribution by Stage of Development and Region of Developer Headquarters
- Figure 7.1. Technology Platforms for Approved and Clinical Bispecific Antibodies: Comparative Analysis
- Figure 7.2. Technology Platforms for Preclinical Bispecific Antibodies: Comparative Analysis
- Figure 7.3. Most Popular Technology Platforms: Distribution by Stage of Development
- Figure 7.4. Bispecific Antibody Technology Platform Developers: Distribution by Location of Headquarters
- Figure 8.1. Big Pharma Players: Benchmarking Analysis (Spider Web Representation)
- Figure 8.2. Big Pharma Players: Distribution by Target Antigen
- Figure 8.3. Big Pharma Players: Distribution by Antibody Format
- Figure 8.4. Big Pharma Players: Distribution by Mechanism of Action
- Figure 8.5. Big Pharma Players: Distribution by Therapeutic Area
- Figure 9.1. Akeso Biopharma: Annual Revenues, FY 2019 Onwards (RMB Million)
- Figure 9.2. Alphamab Oncology: Annual Revenues, FY 2019 Onwards (RMB Million)
- Figure 9.3. Amgen: Annual Revenues, FY 2019 Onwards (USD Billion)
- Figure 9.4. Merck: Annual Revenues, FY 2019 Onwards (EUR Billion)
- Figure 9.5. Regeneron: Annual Revenues, FY 2019 Onwards (USD Billion)
- Figure 9.6. Roche: Annual Revenues, FY 2019 Onwards (CHF Million)
- Figure 9.7. Xencor: Annual Revenues, FY 2019 Onwards (USD Million)
- Figure 10.1. Partnerships and Collaborations: Cumulative Year-wise Trend, since 2016
- Figure 10.2. Partnerships and Collaborations: Distribution by Type of Partnership
- Figure 10.3. Partnerships and Collaborations: Distribution by Year and Type of Partnership
- Figure 10.4. Partnerships and Collaborations: Distribution by Disease Segment
- Figure 10.5. Partnerships and Collaborations: Distribution by Type of Payment Model Employed and Deal Amount (USD Billion)
- Figure 10.6. Partnerships and Collaborations: Year-wise Distribution by Type of Payment Model Employed and Deal Amount (USD Billion, since 2016)
- Figure 10.7. Partnerships and Collaborations: Distribution by Disease Segment, Type of Payment Model Employed and Deal Amount (USD Billion)
- Figure 10.8. Most Active Players: Distribution by Number of Partnership Instances
- Figure 10.9. Most Popular Technologies: Distribution by Number of Partnership Instances
- Figure 10.10. Partnerships and Collaborations: Distribution by Region
- Figure 10.11. Partnerships and Collaborations: International and Intracontinental Agreements
- Figure 12.1. Clinical Trial Analysis: Cumulative Year-wise Trend of Trials by Trial Registration Year
- Figure 12.2. Clinical Trial Analysis: Distribution of Enrolled Patient Population by Trial Registration Year
- Figure 12.3. Clinical Trial Analysis: Distribution by Trial Phase
- Figure 12.4. Clinical Trial Analysis: Distribution of Enrolled Patient Population by Trial Phase
- Figure 12.5. Clinical Trial Analysis: Distribution by Trial Recruitment Status
- Figure 12.6. Clinical Trial Analysis: Cumulative Distribution by Trial Registration Year and Trial Recruitment Status
- Figure 12.7. Clinical Trial Analysis: Distribution by Type of Study
- Figure 12.8. Clinical Trial Analysis: Distribution by Study Design
- Figure 12.9. Clinical Trial Analysis: Distribution by Type of Sponsor / Collaborator
- Figure 12.10. Leading Industry Players: Distribution by Number of Registered Trials
- Figure 12.11. Leading Non-Industry Players: Distribution by Number of Registered Trials
- Figure 12.12. Clinical Trial Analysis: Key Focus Areas (Word Cloud Representation)
- Figure 12.13. Clinical Trial Analysis: Geographical Distribution by Number of Clinical Trials
- Figure 12.14. Clinical Trial Analysis: Geographical Distribution by Trial Recruitment Status
- Figure 12.15. Clinical Trial Analysis: Geographical Distribution of Enrolled Patient Population by Trial Recruitment Status
- Figure 13.1. FDA Considerations for Development of Bispecific Antibodies
- Figure 14.1. Key Channels Used for Promotional and Marketing Campaigns
- Figure 14.2. Blincyto(R): Product Website Snapshots (Messages for Healthcare Professionals, BLAST Study Results)
- Figure 14.3. Blincyto(R): Product Website Snapshots (Messages for Healthcare Professionals, TOWER Study Results)
- Figure 14.4. Blincyto(R): Product Website Snapshots (Messages for Healthcare Professionals, Ph (+) Relapsed / Refractory B-cell Precursor ALL)
- Figure 14.5. Blincyto(R): Product Website Snapshots (Messages for Healthcare Professionals, Relapsed / Refractory B-cell Precursor ALL (Pediatrics))
- Figure 14.6. Blincyto(R): Product Website Snapshots (Messages for Patients)
- Figure 14.7. Blincyto(R): Amgen Assist 360 Nurse Ambassador
- Figure 14.8. Blincyto(R): Presence in Conferences
- Figure 14.9. Hemlibra(R): Product Website Snapshots (Messages for Healthcare Professionals, Hemophilia A without Factor VIII Inhibitors)
- Figure 14.10. Hemlibra(R): Product Website Snapshots (Messages for Healthcare Professionals, Hemophilia A with Factor VIII Inhibitors)
- Figure 14.11. Hemlibra(R): Product Website Snapshots (Messages for Patients)
- Figure 14.12. Hemlibra(R): Presence in Conferences
- Figure 15.1. Bispecific Antibody Therapeutics Market, till 2035 (USD Million)
- Figure 15.2. Bispecific Antibody Therapeutics Market: Distribution by Therapeutic Area, Current Year and 2035 (USD Million)
- Figure 15.3. Bispecific Antibody Therapeutics Market: Distribution by Mechanism of Action, Current Year and 2035 (USD Million)
- Figure 15.4. Bispecific Antibody Therapeutics Market: Distribution by Target Antigen, Current Year and 2035 (USD Million)
- Figure 15.5. Bispecific Antibody Therapeutics Market: Distribution by Antibody Format, Current Year and 2035 (USD Million)
- Figure 15.6. Bispecific Antibody Therapeutics Market: Distribution by Key Players, Current Year and 2035 (USD Million)
- Figure 15.7. Bispecific Antibody Therapeutics Market: Distribution by Geography, Current Year and 2035 (USD Million)
- Figure 15.8. AK104 (Akeso Biopharma) Sales Forecast, Till 2035 (USD Million)
- Figure 15.9. Blincyto(R) (Amgen) Sales Forecast, Till 2035 (USD Million)
- Figure 15.10. Hemlibra(R) (Roche) Sales Forecast, Till 2035 (USD Million)
- Figure 15.11 Kimmtrak(R) (Immunocore) Sales Forecast, Till 2035 (USD Million)
- Figure 15.12. Lunsumio(R) (Roche) Sales Forecast, Till 2035 (USD Million)
- Figure 15.13. Nanozora(R) (Taisho Pharmaceutical) Sales Forecast, Till 2035 (USD Million)
- Figure 15.14. Rybrevant(TM) (Janssen Research & Development) Sales Forecast, Till 2035 (USD Million)
- Figure 15.15. Tecvayli(TM) (Janssen Research & Development) Sales Forecast, Till 2035 (USD Million)
- Figure 15.16. Vabysmo(TM) (Roche) Sales Forecast, Till 2035 (USD Million)
- Figure 15.17. AK112 (Akeso Biopharma) Sales Forecast, Till 2035 (USD Million)
- Figure 15.18. ALXN1720 (Alexion) Sales Forecast, Till 2035 (USD Million)
- Figure 15.19. GEN3013 (Genmab) Sales Forecast, Till 2035 (USD Million)
- Figure 15.20. Glofitamab (Roche) Sales Forecast, Till 2035 (USD Million)
- Figure 15.21. LP000 (Linton Pharm) Sales Forecast, Till 2035 (USD Million)
- Figure 15.22. M7824 (Merck) Sales Forecast, Till 2035 (USD Million)
- Figure 15.23. OMP 305B83 (Mereo BioPharma) Sales Forecast, Till 2035 (USD Million)
- Figure 15.24. PF-06863135 (Pfizer) Sales Forecast, Till 2035 (USD Million)
- Figure 15.25. ZW25 (Zymeworks) Sales Forecast, Till 2035 (USD Million)
Figure 16.1.Bispecific Antibody Therapeutics: SWOT Analysis
Figure 16.2.Comparison of SWOT Factors: Harvey Ball Analysis
 雙特異性抗體市場:依作用機制、結構、適應症、技術及最終用戶分類-2026-2032年全球市場預測
 雙特異性抗體的全球市場
 全球雙特異性抗體市場機會、劑量、專利、定價、銷售和臨床試驗展望(2031 年)
 雙特異性抗體市場分析及預測(至2035年):按類型、產品、技術、成分、應用、最終用戶、製程、部署、功能及階段分類全球雙特異性抗體市場規模、佔有率、趨勢和成長分析報告(2026-2034年)
 雙特異性抗體市場-全球產業規模、佔有率、趨勢、機會和預測:按適應症、地區和競爭格局分類,2021-2031年全球雙特異性抗體市場:市場規模、佔有率、成長率、產業分析、依類型、應用和地區劃分的考慮因素以及未來預測(2026-2034)
 美國雙特異性抗體市場規模、佔有率和趨勢分析報告:按類型和細分市場預測(2025-2033 年)
 雙特異性抗體市場,按藥物類型、按適應症、按配銷通路、按國家和地區 - 2025 年至 2032 年全球行業分析、市場規模、市場佔有率和預測