


 |
市場調查報告書
商品編碼
1817401
亞磷酰胺市場:產業趨勢及2035年全球預測 - 依亞磷酰胺類型、合成寡核苷酸類型、應用領域、治療領域及地區劃分Phosphoramidites Market: Industry Trends and Global Forecasts, till 2035 - Distribution by Type of Phosphoramidite, Type of Oligonucleotide synthesized, Application Area, Therapeutic Area and Geographical Regions |
||||||
亞磷酰胺市場:概覽
亞磷醯胺市場預計將從2024年的8億美元成長到2025年的10億美元,再到2035年的27億美元,預測期內複合年增長率為10.6%。
亞磷酰胺市場機會可分為以下幾個部分:
亞磷醯胺類型
- DNA亞磷醯胺
- RNA亞磷醯胺
- 2'-修飾亞磷醯胺
- 鎖核酸 (LNA)
- 其他亞磷醯胺
寡核苷酸型別
- siRNA寡核苷酸
- 反義寡核苷酸
- DNA寡核苷酸
- 其他寡核苷酸
應用程式
- 研究與診斷應用
- 商業治療應用
- 臨床治療應用
治療領域
- 傳染病
- 心血管疾病
- 遺傳性疾病
- 代謝性疾病
- 肝病
- 自體免疫疾病
- 腫瘤學
- 腎病
- 眼科
- 神經系統疾病疾病
- 血液學
- 其他
地區
- 北美
- 歐洲
- 亞太地區
- 拉丁美洲
- 中東和北非
北美市場
- 美國
- 加拿大
歐洲市場
- 德國
- 法國
- 英國
- 義大利
- 西班牙
- 其他歐洲市場
亞太市場
- 中國
- 日本
- 印度
- 韓國
- 澳大利亞
- 其他
拉丁美洲市場
- 巴西
- 阿根廷
- 墨西哥
- 其他
中東和北非市場
- 埃及
- 以色列
- 沙烏地阿拉伯
- 其他
亞磷酰胺市場成長與趨勢
亞磷醯胺(或amidites)是經過化學修飾的核苷,含有一個亞磷酸酯基團和多個保護基,可作為寡核苷酸合成的構建基塊。這些亞磷酰胺在構建客製化DNA和RNA序列方面發揮關鍵作用。亞磷酰胺化學於1981年問世,透過實現順序、可控和自動化的DNA/RNA合成,徹底改變了分子生物學。
亞磷酰胺化學的適應性體現在其高效性、高產率以及整合修飾核苷酸的能力。這使得它在分子生物學、生物技術和醫學等多個領域都不可或缺。亞磷酰胺在特定條件下表現出的獨特穩定性和反應性使其成為現代寡核苷酸合成的基本組成部分。這有助於生產用於各種應用的寡核苷酸,包括合成化學、分子診斷和個人化治療。
亞磷酰胺有望在基因治療、個人化醫療和新藥開發中發揮重要作用。隨著技術的進步,亞磷酰胺的應用領域將持續拓展,最終推動分子生物學研發的創新。
亞磷酰胺市場關鍵洞察
本報告分析了亞磷酰胺市場的現狀,並探討了該行業的潛在成長機會。報告的主要內容包括:
- 目前,全球各地有 85 家公司為包括寡核苷酸合成在內的眾多生化應用提供/生產亞磷酰胺。
- 超過 70% 的公司提供用於 DNA 寡核苷酸合成的亞磷酰胺,凸顯了 DNA 合成化學領域日益增長的需求。
- 近年來,各方建立的合作夥伴關係也顯示了人們對該領域的興趣日益濃厚,其中收購成為最常見的合作模式。
- 亞磷酰胺領域已公佈的專利中約有80%是專利申請,其中大部分(46%)是在去年公佈的。
- 到2035年,預計近45%的需求將來自北美。尤其是亞太地區,亞磷酰胺的需求預計將以15.2%的複合年增長率成長。
- 由於寡核苷酸合成中對亞磷酰胺的需求快速成長,預計到2035年,該市場的複合年增長率將達到10.6%。
亞磷酰胺市場的主要細分市場
依亞磷酰胺類型劃分,全球市場分為DNA亞磷酰胺、RNA亞磷酰胺、2'-修飾亞磷酰胺、鎖核酸 (LNA) 和其他亞磷酰胺。目前,DNA亞磷酰胺佔了40%的市佔率。這得益於其高反應性,使其成為寡核苷酸合成的熱門選擇,能夠生產用於診斷、治療和研究等各種應用的高品質寡核苷酸。
依合成寡核苷酸類型,全球市場分為siRNA寡核苷酸、反義寡核苷酸、DNA寡核苷酸及其他寡核苷酸。目前,siRNA寡核苷酸約佔總市場佔有率的45%。這些寡核苷酸的作用機制相對簡單,易於辨識有效分子。此外,這些寡核苷酸易於以未經修飾的高效RNA形式生產。
按應用,全球市場分為研究和診斷、商業治療和臨床治療。目前,研究和診斷佔總市場的60%以上。這是因為大多數亞磷酰胺因其效率高、可擴展且適用於高通量製程而用於研究和診斷。
依治療領域劃分,整個市場細分為傳染病、心血管疾病、遺傳性疾病、代謝性疾病、肝病、自體免疫疾病、腫瘤疾病、腎臟病、眼科疾病、神經系統疾病、血液疾病和其他疾病。這是因為亞磷酰胺在PCR等診斷測試中發揮至關重要的作用,這些測試可以實現病原體檢測和疾病管理。
按地區劃分,全球市場涵蓋多個地區,包括北美、歐洲、亞太、拉丁美洲、中東和北非。根據我們的預測,北美預計將在今年佔亞磷酰胺市場的大部分佔有率(45%),而這一趨勢不太可能改變。此外,預計亞太地區市場在預測期內將以相對較高的複合年增長率(11.8%)成長。
亞磷酰胺市場參與者
- Aurisco Pharmaceutical
- BOC Sciences
- Innovassynth Technologies
- 默克
- Meridian Biosciences
- Promega
- QIAGEN
- 羅氏
- 賽默飛世爾科技
- 藥明康德
- Yamasa
- 浙江恆康製藥
目錄
第一部分:報告概述
第一章:引言
第二章:研究方法
第三章:市場動態
- 章節概述
- 預測研究方法論
- 市場估值框架
- 預測工具與技術
- 關鍵考慮因素
- 局限性
第四章:宏觀經濟指標
- 章節概述
- 市場動態
- 結論
第二部分:質性洞察
第五章:摘要整理
第六章:引言
- 亞磷酰胺概述
- 用於寡核苷酸合成的亞磷酰胺方法
- 亞磷酰胺的優勢
- 亞磷酰胺的應用
- 與亞磷酰胺相關的課題
- 近期發展動態
第三部分:市場概覽
第七章:市場格局
- 亞磷酰胺供應商/製造商:市場格局
第八章:競爭分析
- 研究方法與關鍵參數
- 評分
- 同儕概覽
- 亞磷酰胺供應商/製造商:競爭分析
第四部分:公司簡介
第九章:公司簡介:北美公司
- Meridian Life Sciences
- Promega
- BOC Sciences
- Thermo Fisher科學
第 10 章:公司簡介:歐洲公司
- 羅氏
- 默克
- 凱傑
第 11 章公司簡介:亞太地區公司
- Aurisco Pharmaceuticals
- Innovassynth
- YAMASA
- WuXi AppTech
- 浙江恆康製藥
第五節 市場趨勢
第十二章 最新發展
- 章節概述
- 合作模式
- 亞磷酰胺:合作夥伴關係與合作
- 融資與投資模式
- 擴張模式
第十三章 專利分析
- 研究範圍與研究方法
- 亞磷酰胺:專利分析
- 專利基準分析
- 專利評估
- 高被引專利
第六節 市場機會分析
第十四章 市場影響分析:推動因素、阻礙因素、機會與課題
第15章 需求分析
- 關鍵假設與研究方法
- 全球亞磷醯胺年需求量(公噸)
第16章:全球亞磷醯胺市場
- 關鍵假設與研究方法
- 全球亞磷醯胺市場、歷史趨勢(2023年及以後)及預測(至2035年)
- 主要細分市場
第17章:亞磷醯胺市場(依亞磷醯胺類型劃分)
第18章:亞磷醯胺市場(依合成寡核苷酸類型劃分)
第19章:亞磷醯胺市場(依應用領域)
第20章:亞磷醯胺市場(依治療領域)
第21章:亞磷醯胺市場(依主要地區)
第22章:報告結論
第7節:附錄
第23章:表格資料
第24章:圖表列表
第25章:公司與組織清單
PHOSPHORAMIDITES MARKET: OVERVIEW
As per Roots Analysis, the phosphoramidites market is estimated to grow from USD 0.8 billion in 2024 to 1.0 billion in 2025 and USD 2.7 billion by 2035, representing a CAGR of 10.6% during the forecast period.
The opportunity for phosphoramidites market has been distributed across the following segments:
Type of Phosphoramidite
- DNA Phosphoramidites
- RNA Phosphoramidites
- 2'-Modified Phosphoramidites
- Locked Nucleic Acid (LNA)
- Other Phosphoramidites
Type of Oligonucleotide Synthesized
- siRNA Oligonucleotides
- Antisense Oligonucleotides
- DNA Oligonucleotides
- Other Oligonucleotides
Application Area
- Research and Diagnostic Applications
- Commercial Therapeutic Applications
- Clinical Therapeutic Applications
Therapeutic Area
- Infectious Diseases
- Cardiovascular Disorders
- Genetic Disorders
- Metabolic Disorders
- Liver Disorders
- Autoimmune Disorders
- Oncological Disorders
- Nephrological Disorders
- Ophthalmological Disorders
- Neurological Disorders
- Hematological Disorders
- Other Disorders
Geographical Regions
- North America
- Europe
- Asia-Pacific
- Latin America
- Middle East and North Africa
Market in North America
- US
- Canada
Market in Europe
- Germany
- France
- UK
- Italy
- Spain
- Rest of Europe
Market in Asia-Pacific
- China
- Japan
- India
- South Korea
- Australia
- Rest of Asia-Pacific
Market in Latin America
- Brazil
- Argentina
- Mexico
- Rest of Latin America
Market in Middle East and North Africa
- Egypt
- Israel
- Saudi Arabia
- Rest of Middle East and North Africa
Phosphoramidites Market: Growth and Trends
Phosphoramidites (or amidites) are chemically modified nucleosides that contain a phosphite group and several protecting groups serving as the building blocks of oligonucleotide synthesis. These phosphoramidites play a pivotal role in creating custom DNA and RNA sequences. Introduced in 1981, phosphoramidite chemistry has revolutionized molecular biology by enabling sequential, controlled and automated DNA / RNA synthesis.
The adaptability of phosphoramidite chemistry is demonstrated by its effectiveness, high yield, and capability to integrate modified nucleotides. This makes it indispensable in various fields, including molecular biology, biotechnology and medicine. The well-defined stability and reactivity of phosphoramidites under certain conditions have established them as fundamental components in modern oligonucleotide synthesis. This facilitates the production of oligonucleotides for various applications including synthetic chemistry, molecular diagnostics and personalized therapeutics.
We anticipate phosphoramidites to play a critical role in gene therapy and personalized medicine as well as in novel drug development. With the advancements in technology, the applications of phosphoramidites will continue to expand, ultimately driving the innovation in research and development within molecular biology.
Phosphoramidites Market: Key Insights
The report delves into the current state of the phosphoramidite market and identifies potential growth opportunities within the industry. The key takeaways of the report are:
- At present, 85 companies located across different regions are providing / manufacturing phosphoramidites for a myriad of biochemical applications, including oligonucleotide synthesis.
- More than 70% of the companies provide phosphoramidites for the synthesis of DNA oligonucleotides, highlighting their rising demand in DNA synthesis chemistry.
- The growing interest in this domain is evident from the partnerships established in recent years; notably, acquisitions emerged as the most common type of partnership model.
- Around 80% of the patents published in the phosphoramidites domain are patent applications; notably, majority (46%) of the patents were published last year.
- By 2035, close to 45% of the demand is anticipated to be generated in North America; notably, demand for phosphoramidites in Asia-Pacific is projected to grow at a CAGR of 15.2%.
- Given the rapid increase in the demand for phosphoramidites in oligonucleotide synthesis, the market is poised to grow at a CAGR of 10.6% till 2035.
Phosphoramidites Market: Key Segments
DNA Phosphoramidites Segment Holds the Largest Market Share
Based on the type of phosphoramidite, the global market is segmented DNA phosphoramidites, RNA phosphoramidites, 2'-modified phosphoramidites, locked nucleic acid (LNA) and other phosphoramidites. In the current year, DNA phosphoramidites capture 40% of the market share. This can be attributed to their vitality in oligonucleotide synthesis due to their reactivity, which enables the production of high-quality oligonucleotides for various applications, such as diagnostics, therapeutics and research.
siRNA Oligonucleotides Segment is likely to Dominate the Overall Market
Based on the type of oligonucleotide synthesized, the global market is segmented into siRNA oligonucleotides, antisense oligonucleotides, DNA oligonucleotides and other oligonucleotides. Currently, siRNA oligonucleotides hold nearly 45% of the overall market share, as these oligonucleotides have relatively simple mechanism of action for identifying potent molecules. In addition, these oligonucleotides offer an ease in producing unmodified RNA with high potency.
Research and Diagnostic Applications Segment to Hold the Highest Market Share
Based on the application areas, the global market is segmented into research and diagnostic applications, commercial therapeutic applications and clinical therapeutic applications. Presently, research and diagnostic applications segment captures more than 60% of the overall market share. This can be attributed to the fact that majority of phosphoramidites are utilized for research and diagnostic purposes, owing to their efficiency, scalability and compatibility for high-throughput processes.
Hematological Disorders Segment to Grow at a Higher CAGR
Based on the therapeutic area, the overall market is segmented across infectious diseases, cardiovascular disorders, genetic disorders, metabolic disorders, liver disorders, autoimmune disorders, oncological disorders, nephrological disorders, ophthalmological disorders, neurological disorders, hematological disorders and other disorders. In the current year, infectious diseases segment captures 25% of the overall market share, owing to the pivotal role of phosphoramidites in diagnostic tests like PCR, which enables pathogen detection and disease control.
Asia-Pacific to Propel in the Phosphoramidites Sector in the Coming Years
Based on the geographical regions, the global market across various geographies, such as North America, Europe, Asia-Pacific, Latin America and Middle East, and North Africa. According to our projections, we anticipate North America to capture the majority of the phosphoramidite market share (45%) in the current year and this trend is unlikely to change in the future. Further,
The market in Asia-Pacific is likely to grow at a relatively higher CAGR (11.8%), during the forecast period.
Example Players in the Phosphoramidites Market
- Aurisco Pharmaceutical
- BOC Sciences
- Innovassynth Technologies
- Merck
- Meridian Biosciences
- Promega
- QIAGEN
- Roche
- Thermo Fisher Scientific
- WuXi AppTech
- Yamasa
- Zhejiang Hengkang Pharmaceutical
PHOSPHORAMIDITES MARKET: RESEARCH COVERAGE
The report on Phosphoramidites Market features insights into various sections, including:
- Market Sizing and Opportunity Analysis: An in-depth analysis of current market opportunity and the future growth potential of phosphoramidites market, focusing on key market segments, including [A] type of phosphoramidite, [B] type of oligonucleotide synthesized, [C] application area, [D] therapeutic area, and [E] geographical regions.
- Market Landscape: A comprehensive evaluation of phosphoramidites, based on several relevant parameters, such as [A] type of offering, [B] type of building block offered, [C] type of molecule, [D] type of oligonucleotide synthesized, [E] application area [F] and type of service offered.
- Phosphoramidites Developer Landscape: The report features a list of system providers engaged in the phosphoramidites domain, along with analyses based on [A] year of establishment, [B] company size, and [C] location of headquarters.
- Company Competitiveness Analysis: An insightful competitiveness analysis of the phosphoramidite providers / manufacturers based across various geographies namely [A] North America [B] Europe, and [C] Asia-Pacific.
- Company Profiles: Comprehensive profiles of key industry players in the phosphoramidites domain based across various geographies, featuring information on [A] company overview, [B] financial information (if available), [C] service and product portfolio, [D] recent developments, and [E] future outlook statements.
- Recent Developments: A detailed analysis of partnerships inked between stakeholders in the phosphoramidites market, based on several relevant parameters, such as [A] year of partnership, [B] type of partnership, [C] and geography. In addition, the module also features information on funding and expansions reported in this domain.
- Patent Analysis: A detailed analysis of the various patents filed / granted in the phosphoramidites domain, based on several relevant parameters, such as [A] type of patent, [B] patent application year, [C] patent age, [D] type of applicant, [E] patent jurisdiction, [F] patent benchmarking analysis and [G] patent valuation.
- Market Impact Analysis: A thorough analysis of various factors, such as [A] drivers, [B] restraints, [C] opportunities, and [D] existing challenges that are likely to impact market growth.
Key Questions Answered in this Report
- How many companies are currently engaged in this market?
- Which are the leading companies in this market?
- What factors are likely to influence the evolution of this market?
- What is the current and future market size?
- What is the CAGR of this market?
- How is the current and future market opportunity likely to be distributed across key market segments?
Reasons to Buy this Report
- The report provides a comprehensive market analysis, offering detailed revenue projections of the overall market and its specific sub-segments. This information is valuable to both established market leaders and emerging entrants.
- Stakeholders can leverage the report to gain a deeper understanding of the competitive dynamics within the market. By analyzing the competitive landscape, businesses can make informed decisions to optimize their market positioning and develop effective go-to-market strategies.
- The report offers stakeholders a comprehensive overview of the market, including key drivers, barriers, opportunities, and challenges. This information empowers stakeholders to stay abreast of market trends and make data-driven decisions to capitalize on growth prospects.
Additional Benefits
- Complimentary Excel Data Packs for all Analytical Modules in the Report
- 15% Free Content Customization
- Detailed Report Walkthrough Session with Research Team
- Free Updated report if the report is 6-12 months old or older
TABLE OF CONTENTS
SECTION I: REPORT OVERVIEW
1. PREFACE
- 1.1. Introduction
- 1.2. Market Share Insights
- 1.3. Key Market Insights
- 1.4. Report Coverage
- 1.5. Key Questions Answered
- 1.6. Chapter Outlines
2. RESEARCH METHODOLOGY
- 2.1. Chapter Overview
- 2.2. Research Assumptions
- 2.2.1. Market Landscape and Market Trends
- 2.2.2. Market Forecast and Opportunity Analysis
- 2.2.3. Comparative Analysis
- 2.3. Database Building
- 2.3.1. Data Collection
- 2.3.2. Data Validation
- 2.3.3. Data Analysis
- 2.4. Project Methodology
- 2.4.1. Secondary Research
- 2.4.1.1. Annual Reports
- 2.4.1.2. Academic Research Papers
- 2.4.1.3. Company Websites
- 2.4.1.4. Investor Presentations
- 2.4.1.5. Regulatory Filings
- 2.4.1.6. White Papers
- 2.4.1.7. Industry Publications
- 2.4.1.8. Conferences and Seminars
- 2.4.1.9. Government Portals
- 2.4.1.10. Media and Press Releases
- 2.4.1.11. Newsletters
- 2.4.1.12. Industry Databases
- 2.4.1.13. Roots Proprietary Databases
- 2.4.1.14. Paid Databases and Sources
- 2.4.1.15. Social Media Portals
- 2.4.1.16. Other Secondary Sources
- 2.4.2. Primary Research
- 2.4.2.1. Types of Primary Research
- 2.4.2.1.1. Qualitative Research
- 2.4.2.1.2. Quantitative Research
- 2.4.2.1.3. Hybrid Approach
- 2.4.2.2. Advantages of Primary Research
- 2.4.2.3. Techniques for Primary Research
- 2.4.2.3.1. Interviews
- 2.4.2.3.2. Surveys
- 2.4.2.3.3. Focus Groups
- 2.4.2.3.4. Observational Research
- 2.4.2.3.5. Social Media Interactions
- 2.4.2.4. Key Opinion Leaders Considered in Primary Research
- 2.4.2.4.1. Company Executives (CXOs)
- 2.4.2.4.2. Board of Directors
- 2.4.2.4.3. Company Presidents and Vice Presidents
- 2.4.2.4.4. Research and Development Heads
- 2.4.2.4.5. Technical Experts
- 2.4.2.4.6. Subject Matter Experts
- 2.4.2.4.7. Scientists
- 2.4.2.4.8. Doctors and Other Healthcare Providers
- 2.4.2.5. Ethics and Integrity
- 2.4.2.5.1. Research Ethics
- 2.4.2.5.2. Data Integrity
- 2.4.2.1. Types of Primary Research
- 2.4.3. Analytical Tools and Databases
- 2.4.1. Secondary Research
- 2.5. Robust Quality Control
3. MARKET DYNAMICS
- 3.1. Chapter Overview
- 3.2. Forecast Methodology
- 3.2.1. Top-down Approach
- 3.2.2. Bottom-up Approach
- 3.2.3. Hybrid Approach
- 3.3. Market Assessment Framework
- 3.3.1. Total Addressable Market (TAM)
- 3.3.2. Serviceable Addressable Market (SAM)
- 3.3.3. Serviceable Obtainable Market (SOM)
- 3.3.4. Currently Acquired Market (CAM)
- 3.4. Forecasting Tools and Techniques
- 3.4.1. Qualitative Forecasting
- 3.4.2. Correlation
- 3.4.3. Regression
- 3.4.4. Extrapolation
- 3.4.5. Convergence
- 3.4.6. Sensitivity Analysis
- 3.4.7. Scenario Planning
- 3.4.8. Data Visualization
- 3.4.9. Time Series Analysis
- 3.4.10. Forecast Error Analysis
- 3.5. Key Considerations
- 3.5.1. Demographics
- 3.5.2. Government Regulations
- 3.5.3. Reimbursement Scenarios
- 3.5.4. Market Access
- 3.5.5. Supply Chain
- 3.5.6. Industry Consolidation
- 3.5.7. Pandemic / Unforeseen Disruptions Impact
- 3.6. Limitations
4. MACRO-ECONOMIC INDICATORS
- 4.1. Chapter Overview
- 4.2. Market Dynamics
- 4.2.1. Time Period
- 4.2.1.1. Historical Trends
- 4.2.1.2. Current and Forecasted Estimates
- 4.2.2. Currency Coverage
- 4.2.2.1. Major Currencies Affecting the Market
- 4.2.2.2. Factors Affecting Currency Fluctuations in the Industry
- 4.2.2.3. Impact of Currency Fluctuations on the Industry
- 4.2.3. Foreign Currency Exchange Rate
- 4.2.3.1. Impact of Foreign Exchange Rate Volatility on the Market
- 4.2.3.2. Strategies for Mitigating Foreign Exchange Risk
- 4.2.4. Recession
- 4.2.4.1. Assessment of Current Economic Conditions and Potential Impact on the Market
- 4.2.4.2. Historical Analysis of Past Recessions and Lessons Learnt
- 4.2.5. Inflation
- 4.2.5.1. Measurement and Analysis of Inflationary Pressures in the Economy
- 4.2.5.2. Potential Impact of Inflation on the Market Evolution
- 4.2.6. Interest Rates
- 4.2.6.1. Interest Rates and Their Impact on the Market
- 4.2.6.2. Strategies for Managing Interest Rate Risk
- 4.2.7. Commodity Flow Analysis
- 4.2.7.1. Type of Commodity
- 4.2.7.2. Origins and Destinations
- 4.2.7.3. Values and Weights
- 4.2.7.4. Modes of Transportation
- 4.2.8. Global Trade Dynamics
- 4.2.8.1. Import Scenario
- 4.2.8.2. Export Scenario
- 4.2.8.3. Trade Policies
- 4.2.8.4. Strategies for Mitigating the Risks Associated with Trade Barriers
- 4.2.8.5. Impact of Trade Barriers on the Market
- 4.2.9. War Impact Analysis
- 4.2.9.1. Russian-Ukraine War
- 4.2.9.2. Israel-Hamas War
- 4.2.10. COVID Impact / Related Factors
- 4.2.10.1. Global Economic Impact
- 4.2.10.2. Industry-specific Impact
- 4.2.10.3. Government Response and Stimulus Measures
- 4.2.10.4. Future Outlook and Adaptation Strategies
- 4.2.11. Other Indicators
- 4.2.11.1. Fiscal Policy
- 4.2.11.2. Consumer Spending
- 4.2.11.3. Gross Domestic Product
- 4.2.11.4. Employment
- 4.2.11.5. Taxes
- 4.2.11.6. Stock Market Performance
- 4.2.11.7. Cross Border Dynamics
- 4.2.1. Time Period
- 4.3. Conclusion
SECTION II: QUALITATIVE INSIGHTS
5. EXECUTIVE SUMMARY
6. INTRODUCTION
- 6.1. An Overview of Phosphoramidites
- 6.2. Phosphoramidite Method for Oligonucleotide Synthesis
- 6.3. Advantages of Phosphoramidites
- 6.4. Applications of Phosphoramidites
- 6.5. Challenges associated with Phosphoramidites
- 6.6. Recent Trends
SECTION III: MARKET OVERVIEW
7 MARKET LANDSCAPE
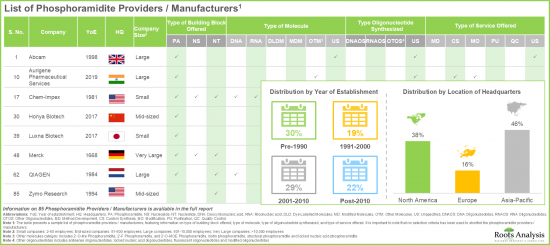
- 7.1. Phosphoramidite Providers / Manufacturers: Overall Market Landscape
- 7.1.1. Analysis by Year of Establishment
- 7.1.2. Analysis by Company Size
- 7.1.3. Analysis by Location of Headquarters
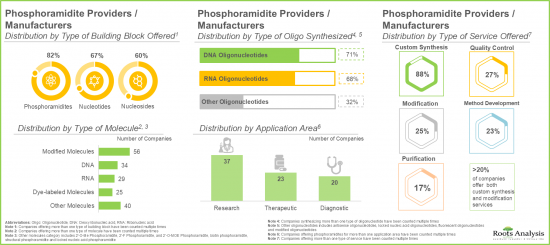
- 7.1.4. Analysis by Type of Offering
- 7.1.5. Analysis by Type of Building Block Offered
- 7.1.6. Analysis by Type of Molecule
- 7.1.7. Analysis by Type of Oligonucleotide Synthesized
- 7.1.8. Analysis by Application Area
- 7.1.9. Analysis by Type of Service Offered
8. COMPANY COMPETITIVENESS ANALYSIS
- 8.1. Methodology and Key Parameters
- 8.2. Scoring
- 8.3. Overview of Peer Groups
- 8.4. Phosphoramidite Providers / Manufacturers: Company Competitiveness Analysis
- 8.4.1. Phosphoramidite Providers / Manufacturers Based in North America
- 8.4.2. Phosphoramidite Providers / Manufacturers Based in Europe
- 8.4.3. Phosphoramidite Providers / Manufacturers Based in Asia-Pacific
SECTION IV: COMPANY PROFILES
9. COMPANY PROFILES: PLAYERS BASED IN NORTH AMERICA
- 9.1. Meridian Life Sciences
- 9.1.1. Company Details
- 9.1.2. Service and Product Portfolio
- 9.1.3. Financial Details, since 2018 (USD Million)
- 9.1.4. Recent Developments and Future Outlook
- 9.2. Promega
- 9.2.1. Company Details
- 9.2.2. Service and Product Portfolio
- 9.2.3. Recent Developments and Future Outlook
- 9.3. BOC Sciences
- 9.3.1. Company Details
- 9.3.2. Service and Product Portfolio
- 9.4. Thermo Fisher Scientific
- 9.4.1. Company Details
- 9.4.2. Service and Product Portfolio
10. COMPANY PROFILES: PLAYERS BASED IN EUROPE
- 10.1. Roche
- 10.1.1. Company Details
- 10.1.2. Service and Product Portfolio
- 10.1.3. Financial Details, since 2021 (CHF Billion)
- 10.1.4. Recent Developments and Future Outlook
- 10.2. Merck
- 10.2.1. Company Details
- 10.2.2. Service and Product Portfolio
- 10.2.3. Financial Details, since 2021 (EUR Billion)
- 10.2.4. Recent Developments and Future Outlook
- 10.3. QIAGEN
- 10.3.1. Company Details
- 10.3.2. Service and Product Portfolio
- 10.3.3. Financial Details, since 2022 (USD Million)
- 10.3.4. Recent Developments and Future Outlook
11. COMPANY PROFILES: PLAYERS IN ASIA-PACIFIC
- 11.1. Aurisco Pharmaceuticals
- 11.1.1. Company Details
- 11.1.2. Service and Product Portfolio
- 11.1.3. Recent Developments and Future Outlook
- 11.2. Innovassynth
- 11.2.1. Company Details
- 11.2.2. Service and Product Portfolio
- 11.2.3. Recent Developments and Future Outlook
- 11.3. YAMASA
- 11.3.1. Company Details
- 11.3.2. Service and Product Portfolio
- 11.3.3. Recent Developments and Future Outlook
- 11.4. WuXi AppTech
- 11.4.1. Company Details
- 11.4.2. Service and Product Portfolio
- 11.5. Zhejiang Hengkang Pharmaceutical
- 11.5.1. Company Details
- 11.5.2. Service and Product Portfolio
SECTION V: MARKET TRENDS
12. RECENT DEVELOPMENTS
- 12.1. Chapter Overview
- 12.2. Partnership Models
- 12.3. Phosphoramidites: Partnerships and Collaborations
- 12.3.1. Analysis by Year of Partnership
- 12.3.2. Analysis by Type of Partnership
- 12.3.3. Analysis by Geography
- 12.3.3.1. Local and International Agreements
- 12.3.3.2. Intracontinental and Intercontinental Agreements
- 12.4. Funding and Investments Models
- 12.5. Expansion Models
13. PATENT ANALYSIS
- 13.1. Scope and Methodology
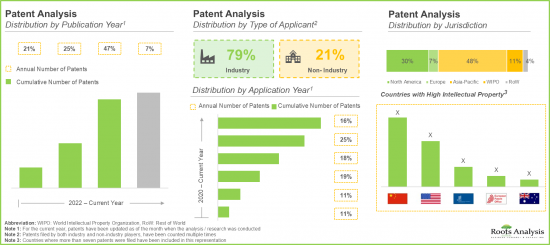
- 13.2. Phosphoramidites: Patent Analysis
- 13.2.1. Analysis by Patent Publication Year, Since 2022
- 13.2.2. Analysis by Type of Patent
- 13.2.3. Analysis by Type of Patent and Publication Year, Since 2022
- 13.2.4. Analysis by Patent Application Year, Since 2008
- 13.2.5. Analysis by Patent Age
- 13.2.6. Analysis by Type of Applicant
- 13.2.7. Analysis by Patent Jurisdiction
- 13.2.8. Analysis by CPC Symbols
- 13.2.9. Leading Industry Players: Analysis by Number of Patents
- 13.2.10. Leading Non-Industry Players: Analysis by Number of Patents
- 13.2.11. Leading Inventors: Analysis by Number of Patents
- 13.3. Patent Benchmarking Analysis
- 13.3.1. Analysis of Patent Characteristics (CPC Codes) by Leading Industry Players
- 13.3.2. Analysis of Leading Industry Players by Patent Characteristics (CPC Codes)
- 13.4. Patent Valuation
- 13.5. Leading Patents by Number of Citations
SECTION VI: MARKET OPPORTUNITY ANALYSIS
14. MARKET IMPACT ANALYSIS: DRIVERS, RESTRAINTS, OPPORTUNITIES AND CHALLENGES
- 14.1. Market Drivers
- 14.2. Market Restraints
- 14.3. Market Opportunities
- 14.4. Market Challenges
15. DEMAND ANALYSIS
- 15.1. Key Assumptions and Methodology
- 15.2. Global Annual Demand for Phosphoramidites (in Metric Tonnes)
- 15.2.1. Analysis by Type of Phosphoramidite
- 15.2.2. Analysis by Type of Oligonucleotide Synthesized
- 15.2.3. Analysis by Application Area
- 15.2.4. Analysis by Therapeutic Area
- 15.2.5. Analysis by geographical Regions
16. GLOBAL PHOSPHORAMIDITE MARKET
- 16.1. Key Assumptions and Methodology
- 16.2. Global Phosphoramidite Market, Historical Trends (since 2023) and Forecasted Estimates (till 2035) (USD Million)
- 16.2.1. Multivariate Scenario Analysis
- 16.2.1.1. Conservative Scenario
- 16.2.1.2. Optimistic Scenario
- 16.2.1. Multivariate Scenario Analysis
- 16.3. Key Market Segmentations
17. PHOSPHORAMIDITE MARKET, BY TYPE OF PHOSPHORAMIDITE
- 17.1. Key Assumptions and Methodology
- 17.2. Phosphoramidite Market: Distribution by Type of Phosphoramidite
- 17.2.1. Phosphoramidite Market for DNA Phosphoramidites, Historical Trends (since 2023) and Forecasted Estimates (till 2035) (USD Million)
- 17.2.2. Phosphoramidite Market for RNA Phosphoramidites, Historical Trends (since 2023) and Forecasted Estimates (till 2035) (USD Million)
- 17.2.3. Phosphoramidite Market for 2'-Modified Phosphoramidites, Historical Trends (since 2023) and Forecasted Estimates (till 2035) (USD Million)
- 17.2.4. Phosphoramidite Market for Locked Nucleic Acid (LNA), Historical Trends (since 2023) and Forecasted Estimates (till 2035) (USD Million)
- 17.2.5. Phosphoramidite Market for Other Phosphoramidites, Historical Trends (since 2023) and Forecasted Estimates (till 2035) (USD Million)
- 17.3. Data Triangulation and Validation
18. PHOSPHORAMIDITE MARKET, BY TYPE OF OLIGONUCLEOTIDE SYNTHESIZED
- 18.1. Key Assumptions and Methodology
- 18.2. Phosphoramidite Market: Distribution by Type of Oligonucleotide Synthesized
- 18.2.1. Phosphoramidite Market for siRNA Oligonucleotides, Historical Trends (since 2023) and Forecasted Estimates (till 2035) (USD Million)
- 18.2.2. Phosphoramidite Market for Antisense Oligonucleotides, Historical Trends (since 2023) and Forecasted Estimates (till 2035) (USD Million)
- 18.2.3. Phosphoramidite Market for DNA Oligonucleotides, Historical Trends (since 2023) and Forecasted Estimates (till 2035) (USD Million)
- 18.2.4. Phosphoramidite Market for Other Oligonucleotides, Historical Trends (since 2023) and Forecasted Estimates (till 2035) (USD Million)
- 18.3. Data Triangulation and Validation
19. PHOSPHORAMIDITE MARKET, BY APPLICATION AREA
- 19.1. Key Assumptions and Methodology
- 19.2. Phosphoramidite Market: Distribution by Application Area
- 19.2.1. Phosphoramidite Market for Research and Diagnostic Applications, Historical Trends (since 2023) and Forecasted Estimates (till 2035) (USD Million)
- 19.2.2. Phosphoramidite Market for Commercial Therapeutic Applications, Historical Trends (since 2023) and Forecasted Estimates (till 2035) (USD Million)
- 19.2.3. Phosphoramidite Market for Clinical Therapeutic Applications, Historical Trends (since 2023) and Forecasted Estimates (till 2035) (USD Million)
- 19.3. Data Triangulation and Validation
20. PHOSPHORAMIDITE MARKET, BY THERAPEUTIC AREA
- 20.1. Key Assumptions and Methodology
- 20.2. Phosphoramidite Market: Distribution by Application Area
- 20.2.1. Phosphoramidite Market for Infectious Diseases, Historical Trends (since 2023) and Forecasted Estimates (till 2035) (USD Million)
- 20.2.2. Phosphoramidite Market for Cardiovascular Disorders, Historical Trends (since 2023) and Forecasted Estimates (till 2035) (USD Million)
- 20.2.3. Phosphoramidite Market for Genetic Disorders, Historical Trends (since 2023) and Forecasted Estimates (till 2035) (USD Million)
- 20.2.4. Phosphoramidite Market for Metabolic Disorders, Historical Trends (since 2023) and Forecasted Estimates (till 2035) (USD Million)
- 20.2.5. Phosphoramidite Market for Liver Disorders, Historical Trends (since 2023) and Forecasted Estimates (till 2035) (USD Million)
- 20.2.6. Phosphoramidite Market for Autoimmune Disorders, Historical Trends (since 2023) and Forecasted Estimates (till 2035) (USD Million)
- 20.2.7. Phosphoramidite Market for Oncological Disorders, Historical Trends (since 2023) and Forecasted Estimates (till 2035) (USD Million)
- 20.2.8. Phosphoramidite Market for Nephrological Disorders, Historical Trends (since 2023) and Forecasted Estimates (till 2035) (USD Million)
- 20.2.9. Phosphoramidite Market for Ophthalmological Disorders, Historical Trends (since 2023) and Forecasted Estimates (till 2035) (USD Million)
- 20.2.10. Phosphoramidite Market for Neurological Disorders, Historical Trends (since 2023) and Forecasted Estimates (till 2035) (USD Million)
- 20.2.11. Phosphoramidite Market for Hematological Disorders, Historical Trends (since 2023) and Forecasted Estimates (till 2035) (USD Million)
- 20.2.12. Phosphoramidite Market for Other Disorders, Historical Trends (since 2023) and Forecasted Estimates (till 2035) (USD Million)
- 20.3. Data Triangulation and Validation
21. PHOSPHORAMIDITE MARKET, BY KEY GEOGRAPHICAL REGIONS
- 21.1. Key Assumptions and Methodology
- 21.2. Phosphoramidite Market: Distribution by Key Geographical Regions
- 21.2.1. Phosphoramidite Market in North America, Historical Trends (since 2023) and Forecasted Estimates (till 2035) (USD Million)
- 21.2.1.1. Phosphoramidite Market in the US, Historical Trends (since 2023) and Forecasted Estimates (till 2035) (USD Million)
- 21.2.1.2. Phosphoramidite Market in Canada, Historical Trends (since 2023) and Forecasted Estimates (till 2035) (USD Million)
- 21.2.2. Phosphoramidite Market in Europe, Historical Trends (since 2023) and Forecasted Estimates (till 2035) (USD Million)
- 21.2.2.1. Phosphoramidite Market in Germany, Historical Trends (since 2023) and Forecasted Estimates (till 2035) (USD Million)
- 21.2.2.2. Phosphoramidite Market in France, Historical Trends (since 2023) and Forecasted Estimates (till 2035) (USD Million)
- 21.2.2.3. Phosphoramidite Market in Italy, Historical Trends (since 2023) and Forecasted Estimates (till 2035) (USD Million)
- 21.2.2.4. Phosphoramidite Market in Spain, Historical Trends (since 2023) and Forecasted Estimates (till 2035) (USD Million)
- 21.2.2.5. Phosphoramidite Market in the UK, Historical Trends (since 2023) and Forecasted Estimates (till 2035) (USD Million)
- 21.2.2.6. Phosphoramidite Market in Rest of Europe, Historical Trends (since 2023) and Forecasted Estimates (till 2035) (USD Million)
- 21.2.3. Phosphoramidite Market in Asia-Pacific, Historical Trends (since 2023) and Forecasted Estimates (till 2035) (USD Million)
- 21.2.3.1. Phosphoramidite Market in China, Historical Trends (since 2023) and Forecasted Estimates (till 2035) (USD Million)
- 21.2.3.2. Phosphoramidite Market in India, Historical Trends (since 2023) and Forecasted Estimates (till 2035) (USD Million)
- 21.2.3.3. Phosphoramidite Market in Japan, Historical Trends (since 2023) and Forecasted Estimates (till 2035) (USD Million)
- 21.2.3.4. Phosphoramidite Market in South Korea, Historical Trends (since 2023) and Forecasted Estimates (till 2035) (USD Million)
- 21.2.3.5. Phosphoramidite Market in Australia, Historical Trends (since 2023) and Forecasted Estimates (till 2035) (USD Million)
- 21.2.3.6. Phosphoramidite Market in Rest of Asia-Pacific, Historical Trends (since 2023) and Forecasted Estimates (till 2035) (USD Million)
- 21.2.4. Phosphoramidite Market in Latin America, Historical Trends (since 2023) and Forecasted Estimates (till 2035) (USD Million)
- 21.2.4.1. Phosphoramidite Market in Brazil, Historical Trends (since 2023) and Forecasted Estimates (till 2035) (USD Million)
- 21.2.4.2. Phosphoramidite Market in Argentina, Historical Trends (since 2023) and Forecasted Estimates (till 2035) (USD Million)
- 21.2.4.3. Phosphoramidite Market in Mexico, Historical Trends (since 2023) and Forecasted Estimates (till 2035) (USD Million)
- 21.2.4.4. Phosphoramidite Market in Rest of Latin America, Historical Trends (since 2023) and Forecasted Estimates (till 2035) (USD Million)
- 21.2.5. Phosphoramidite Market in Middle East and North Africa, Historical Trends (since 2023) and Forecasted Estimates (till 2035) (USD Million)
- 21.2.5.1. Phosphoramidite Market in Egypt, Historical Trends (since 2023) and Forecasted Estimates (till 2035) (USD Million)
- 21.2.5.2. Phosphoramidite Market in Israel, Historical Trends (since 2023) and Forecasted Estimates (till 2035) (USD Million)
- 21.2.5.3. Phosphoramidite Market in Saudi Arabia, Historical Trends (since 2023) and Forecasted Estimates (till 2035) (USD Million)
- 21.2.5.4. Phosphoramidite Market in Rest of Middle East and North Africa, Historical Trends (since 2023) and Forecasted Estimates (till 2035) (USD Million)
- 21.2.1. Phosphoramidite Market in North America, Historical Trends (since 2023) and Forecasted Estimates (till 2035) (USD Million)
- 21.3. Market Movement Analysis
- 21.4. Penetration-Growth (P-G) Matrix
- 21.5. Data Triangulation and Validation
22. REPORT CONCLUSION
SECTION VII: APPENDIX
23. TABULATED DATA
24. LIST OF FIGURES AND TABLES
25. LIST OF COMPANIES AND ORGANIZATIONS
List of Tables
- Table 7.1 Phosphoramidite Providers / Manufacturers: Information on Year of Establishment, Location of Headquarters, Company Size, Type of Offering
- Table 7.2 Phosphoramidite Providers / Manufacturers: Information on Type of Building Block Offered, Type of Molecule, Type of Oligonucleotide Synthesized, Application Area, Type of Service Offered
- Table 9.1 Meridian Life Sciences: Product Portfolio
- Table 9.2 Promega: Service and Product Portfolio
- Table 10.1 Roche: Service and Product Portfolio
- Table 11.1 Aurisco Pharmaceuticals: Service and Product Portfolio
- Table 11.2 Innovassynth: Service and Product Portfolio
- Table 12.1 List of Partnerships and Collaborations (2020-2025)
- Table 12.2 List of Funding and Investments (2020-2025)
- Table 12.3 List of Expansions
- Table 13.1 Phosphoramidite Market: List of Published Patents
- Table 23.1 Phosphoramidite Providers / Manufacturers: Distribution by Year of Establishment
- Table 23.2 Phosphoramidite Providers / Manufacturers: Distribution by Company Size
- Table 23.3 Phosphoramidite Providers / Manufacturers: Distribution by Location of Headquarters
- Table 23.4 Phosphoramidite Providers / Manufacturers: Distribution by Type of Offering
- Table 23.5 Phosphoramidite Providers / Manufacturers: Distribution by Type of Building Block Offered
- Table 23.6 Phosphoramidite Providers / Manufacturers: Distribution by Type of Molecule
- Table 23.7 Phosphoramidite Providers / Manufacturers: Distribution by Type of Oligonucleotide Synthesized
- Table 23.8 Phosphoramidite Providers / Manufacturers: Distribution by Application Area
- Table 23.9 Phosphoramidite Providers / Manufacturers: Distribution by Type of Service Offered
- Table 23.10 Meridian Life Sciences: Business Segment-wise Revenues and Consolidated Financial Details, FY 2018 - FY 2022 (USD Million)
- Table 23.11 Roche: Business Segment-wise Revenues and Consolidated Financial Details, FY 2021 - Q1 FY 2025 (CHF Billion)
- Table 23.12 Merck: Business Segment-wise Revenues and Consolidated Financial Details, FY 2021 - Q1 FY 2025 (EUR Billion)
- Table 23.13 Qiagen: Business Segment-wise Revenues and Consolidated Financial Details, FY 2022 - FY 2024 (USD Million)
- Table 23.14 Recent Developments: Cumulative Year-wise Trend
- Table 23.15 Recent Developments: Distribution by Type of Partnership
- Table 23.16 Recent Developments: Local and International Agreements
- Table 23.17 Recent Developments: Intercontinental and Intracontinental Agreements
- Table 23.18 Patent Analysis: Distribution by Patent Publication Year
- Table 23.19 Patent Analysis: Distribution by Type of Patent
- Table 23.20 Patent Analysis: Distribution by Type of Patent and Publication Year
- Table 23.21 Patent Analysis: Distribution by Patent Application Year
- Table 23.22 Patent Analysis: Distribution by Patent Age
- Table 23.23 Patent Analysis: Distribution by Type of Applicant
- Table 23.24 Cumulative Year-wise Distribution by Type of Applicant
- Table 23.25 Patent Analysis: Distribution by Patent Jurisdiction
- Table 23.26 Leading Industry Players: Distribution by Number of Patents
- Table 23.27 Leading Non-Industry Players: Distribution by Number of Patents
- Table 23.28 Leading Inventors: Distribution by Number of Patents
- Table 23.29 Patent Analysis: Patent Valuation
- Table 23.30 Global Annual Demand for Phosphoramidites, (Till 2035) (Metric Tonnes)
- Table 23.31 Global Annual Demand for Phosphoramidites: Distribution by Type of Phosphoramidite, (Till 2035) (Metric Tonnes)
- Table 23.32 Global Annual Demand for Phosphoramidites: Distribution by Type of Oligonucleotide Synthesized, (Till 2035) (MetricTonnes)
- Table 23.33 Global Annual Demand for Phosphoramidites: Distribution by Application Area, (Till 2035) (Metric Tonnes)
- Table 23.34 Global Annual Demand for Phosphoramidites: Distribution by Therapeutic Area, (Till 2035) (Metric Tonnes)
- Table 23.35 Global Annual Demand for Phosphoramidites: Distribution by Geographical Regions, (Till 2035) (Metric Tonnes)
- Table 23.36 Global Phosphoramidite Market, Historical Trends (Since 2023) and Forecasted Estimates (Till 2035) (USD Million)
- Table 23.37 Global Phosphoramidite Market, Forecasted Estimates (Till 2035): Conservative Scenario (USD Million)
- Table 23.38 Global Phosphoramidite Market, Forecasted Estimates (Till 2035): Optimistic Scenario (USD Million)
- Table 23.39 Phosphoramidite Market: Distribution by Type of Phosphoramidite
- Table 23.40 Phosphoramidite Market for DNA Phosphoramidites, Historical Trends (Since 2023) and Forecasted Estimates (Till 2035) (USD Million)
- Table 23.41 Phosphoramidite Market for RNA Phosphoramidites, Historical Trends (Since 2023) and Forecasted Estimates (Till 2035) (USD Million)
- Table 23.42 Phosphoramidite Market for 2'-Modified Phosphoramidites, Historical Trends (Since 2023) and Forecasted Estimates (Till 2035) (USD Million)
- Table 23.43 Phosphoramidite Market for Locked Nucleic Acid (LNA), Historical Trends (Since 2023) and Forecasted Estimates (Till 2035) (USD Million)
- Table 23.44 Phosphoramidite Market for Other Phosphoramidites, Historical Trends (Since 2023) and Forecasted Estimates (Till 2035) (USD Million)
- Table 23.45 Phosphoramidite Market: Distribution by Type of Oligonucleotide Synthesized
- Table 23.46 Phosphoramidite Market for siRNA Oligonucleotides, Historical Trends (Since 2023) and Forecasted Estimates (Till 2035) (USD Million)
- Table 23.47 Phosphoramidite Market for Antisense Oligonucleotides, Historical Trends (Since 2023) and Forecasted Estimates (Till 2035) (USD Million)
- Table 23.48 Phosphoramidite Market for DNA Oligonucleotides, Historical Trends (Since 2023) and Forecasted Estimates (Till 2035) (USD Million)
- Table 23.49 Phosphoramidite Market for Other Oligonucleotides, Historical Trends (Since 2023) and Forecasted Estimates (Till 2035) (USD Million)
- Table 23.50 Phosphoramidite Market: Distribution by Application Area
- Table 23.51 Phosphoramidite Market for Research and Diagnostic Applications, Historical Trends (Since 2023) and Forecasted Estimates (Till 2035) (USD Million)
- Table 23.52 Phosphoramidite Market for Commercial Therapeutic Applications, Historical Trends (Since 2023) and Forecasted Estimates (Till 2035) (USD Million)
- Table 23.53 Phosphoramidite Market for Clinical Therapeutic Applications, Historical Trends (Since 2023) and Forecasted Estimates (Till 2035) (USD Million)
- Table 23.54 Phosphoramidite Market: Distribution by Therapeutic Area
- Table 23.55 Phosphoramidite Market for Infectious Diseases, Historical Trends (Since 2023) and Forecasted Estimates (Till 2035) (USD Million)
- Table 23.56 Phosphoramidite Market for Cardiovascular Disorders, Historical Trends (Since 2023) and Forecasted Estimates (Till 2035) (USD Million)
- Table 23.57 Phosphoramidite Market for Genetic Disorders, Historical Trends (Since 2023) and Forecasted Estimates (Till 2035) (USD Million)
- Table 23.58 Phosphoramidite Market for Metabolic Disorders, Historical Trends (Since 2023) and Forecasted Estimates (Till 2035) (USD Million)
- Table 23.59 Phosphoramidite Market for Liver Disorders, Historical Trends (Since 2023) and Forecasted Estimates (Till 2035) (USD Million)
- Table 23.60 Phosphoramidite Market for Autoimmune Disorders, Historical Trends (Since 2023) and Forecasted Estimates (Till 2035) (USD Million)
- Table 23.61 Phosphoramidite Market for Oncological Disorders, Historical Trends (Since 2023) and Forecasted Estimates (Till 2035) (USD Million)
- Table 23.62 Phosphoramidite Market for Nephrological Disorders, Historical Trends (Since 2023) and Forecasted Estimates (Till 2035) (USD Million)
- Table 23.63 Phosphoramidite Market for Ophthalmological Disorders, Historical Trends (Since 2023) and Forecasted Estimates (Till 2035) (USD Million)
- Table 23.64 Phosphoramidite Market for Neurological Disorders, Historical Trends (Since 2023) and Forecasted Estimates (Till 2035) (USD Million)
- Table 23.65 Phosphoramidite Market for Hematological Disorders, Historical Trends (Since 2023) and Forecasted Estimates (Till 2035) (USD Million)
- Table 23.66 Phosphoramidite Market for Other Disorders, Historical Trends (Since 2023) and Forecasted Estimates (Till 2035) (USD Million)
- Table 23.67 Phosphoramidite Market: Distribution by Geographical Regions
- Table 23.68 Phosphoramidite Market in North America, Historical Trends (Since 2023) and Forecasted Estimates (Till 2035) (USD Million)
- Table 23.69 Phosphoramidite Market in the US, Historical Trends (Since 2023) and Forecasted Estimates (Till 2035) (USD Million)
- Table 23.70 Phosphoramidite Market in Canada, Historical Trends (Since 2023) and Forecasted Estimates (Till 2035) (USD Million)
- Table 23.71 Phosphoramidite Market in Europe, Historical Trends (Since 2023) and Forecasted Estimates (Till 2035) (USD Million)
- Table 23.72 Phosphoramidite Market in Germany, Historical Trends (Since 2023) and Forecasted Estimates (Till 2035) (USD Million)
- Table 23.73 Phosphoramidite Market in France, Historical Trends (Since 2023) and Forecasted Estimates (Till 2035) (USD Million)
- Table 23.74 Phosphoramidite Market in Italy, Historical Trends (Since 2023) and Forecasted Estimates (Till 2035) (USD Million)
- Table 23.75 Phosphoramidite Market in Spain, Historical Trends (Since 2023) and Forecasted Estimates (Till 2035) (USD Million)
- Table 23.76 Phosphoramidite Market in the UK, Historical Trends (Since 2023) and Forecasted Estimates (Till 2035) (USD Million)
- Table 23.77 Phosphoramidite Market in Rest of Europe, Historical Trends (Since 2023) and Forecasted Estimates (Till 2035) (USD Million)
- Table 23.78 Phosphoramidite Market in Asia-Pacific, Historical Trends (Since 2023) and Forecasted Estimates (Till 2035) (USD Million)
- Table 23.79 Phosphoramidite Market in China, Historical Trends (Since 2023) and Forecasted Estimates (Till 2035) (USD Million)
- Table 23.80 Phosphoramidite Market in India, Historical Trends (Since 2023) and Forecasted Estimates (Till 2035) (USD Million)
- Table 23.81 Phosphoramidite Market in Japan, Historical Trends (Since 2023) and Forecasted Estimates (Till 2035) (USD Million)
- Table 23.82 Phosphoramidite Market in South Korea, Historical Trends (Since 2023) and Forecasted Estimates (Till 2035) (USD Million)
- Table 23.83 Phosphoramidite Market in Australia, Historical Trends (Since 2023) and Forecasted Estimates (Till 2035) (USD Million)
- Table 23.84 Phosphoramidite Market in Rest of Asia-Pacific, Historical Trends (Since 2023) and Forecasted Estimates (Till 2035) (USD Million)
- Table 23.85 Phosphoramidite Market in Latin America, Historical Trends (Since 2023) and Forecasted Estimates (Till 2035) (USD Million)
- Table 23.86 Phosphoramidite Market in Brazil, Historical Trends (Since 2023) and Forecasted Estimates (Till 2035) (USD Million)
- Table 23.87 Phosphoramidite Market in Argentina, Historical Trends (Since 2023) and Forecasted Estimates (Till 2035) (USD Million)
- Table 23.88 Phosphoramidite Market in Mexico, Historical Trends (Since 2023) and Forecasted Estimates (Till 2035) (USD Million)
- Table 23.89 Phosphoramidite Market in Rest of Latin America, Historical Trends (Since 2023) and Forecasted Estimates (Till 2035) (USD Million)
- Table 23.90 Phosphoramidite Market in Middle East and North Africa, Historical Trends (Since 2023) and Forecasted Estimates (Till 2035) (USD Million)
- Table 23.91 Phosphoramidite Market in Egypt, Historical Trends (Since 2023) and Forecasted Estimates (Till 2035) (USD Million)
- Table 23.92 Phosphoramidite Market in Israel, Historical Trends (Since 2023) and Forecasted Estimates (Till 2035) (USD Million)
- Table 23.93 Phosphoramidite Market in Saudi Arabia, Historical Trends (Since 2023) and Forecasted Estimates (Till 2035) (USD Million)
- Table 23.94 Phosphoramidite Market in Rest of Middle East and North Africa, Historical Trends (Since 2023) and Forecasted Estimates (Till 2035) (USD Million)
List of Figures
- Figure 2.1 Research Methodology: Project Methodology
- Figure 2.2 Research Methodology: Data Sources for Secondary Research
- Figure 2.3 Research Methodology: Robust Quality Control Framework
- Figure 3.1 Market Dynamics: Forecast Methodology
- Figure 3.2 Market Dynamics: Market Assessment Framework
- Figure 3.3 Market Dynamics: Example List of Parameters
- Figure 4.1 Historical Analysis of Past Recessions and Lessons Learnt
- Figure 5.1 Executive Summary: Market Landscape
- Figure 5.2 Executive Summary: Market Trends
- Figure 5.3 Executive Summary: Market Sizing and Opportunity Analysis
- Figure 6.1 Challenges associated with Phosphoramidites
- Figure 7.1 Phosphoramidite Providers / Manufacturers: Distribution by Year of Establishment
- Figure 7.2 Phosphoramidite Providers / Manufacturers: Distribution by Company Size
- Figure 7.3 Phosphoramidite Providers / Manufacturers: Distribution by Location of Headquarters
- Figure 7.4 Phosphoramidite Providers / Manufacturers: Distribution by Type of Offering
- Figure 7.5 Phosphoramidite Providers / Manufacturers: Distribution by Type of Building Block Offered
- Figure 7.6 Phosphoramidite Providers / Manufacturers: Distribution by Type of Molecule
- Figure 7.7 Phosphoramidite Providers / Manufacturers: Distribution by Type of Oligonucleotide Synthesized
- Figure 7.8 Phosphoramidite Providers / Manufacturers: Distribution by Application Area
- Figure 7.9 Phosphoramidite Providers / Manufacturers: Distribution by Type of Service Offered
- Figure 8.1 Phosphoramidite Providers / Manufacturers based in North America: Distribution by Company Size
- Figure 8.2 Phosphoramidite Providers / Manufacturers based in North America: Distribution by Type of Building Block Offered
- Figure 8.3 Phosphoramidite Providers / Manufacturers based in North America: Distribution by Type of Oligonucleotide Synthesized
- Figure 8.4 Competitive Analysis of Providers / Manufacturers based in North America
- Figure 8.5 Phosphoramidite Providers / Manufacturers based in Europe: Distribution by Company Size
- Figure 8.6 Phosphoramidite Providers / Manufacturers based in Europe: Distribution by Type of Building Block Offered
- Figure 8.7 Phosphoramidite Providers / Manufacturers based in Europe: Distribution by Type of Oligonucleotide Synthesized
- Figure 8.8 Competitive Analysis of Providers / Manufacturers based in Europe
- Figure 8.9 Phosphoramidite Providers / Manufacturers based in Asia-Pacific: Distribution by Company Size
- Figure 8.10 Phosphoramidite Providers / Manufacturers based in Asia-Pacific: Distribution by Type of Building Block Offered
- Figure 8.11 Phosphoramidite Providers / Manufacturers based in Asia-Pacific: Distribution by Type of Oligonucleotide Synthesized
- Figure 8.12 Competitive Analysis of Providers / Manufacturers based in Asia-Pacific
- Figure 9.1 Meridian Life Sciences: Business Segment-wise Revenues and Consolidated Financial Details, Since FY 2018 (USD Million)
- Figure 10.1 Roche: Business Segment-wise Revenues and Consolidated Financial Details, Since FY 2021 (CHF Billion)
- Figure 10.2 Merck: Business Segment-wise Revenues and Consolidated Financial Details, Since FY 2021 (EUR Billion)
- Figure 10.3 Qiagen: Business Segment-wise Revenues and Consolidated Financial Details, Since FY 2022 (USD Million)
- Figure 12.1 Recent Developments: Cumulative Year-wise Trend
- Figure 12.2 Recent Developments: Distribution by Type of Partnership
- Figure 12.3 Recent Developments: Local and International Agreements
- Figure 12.4 Recent Developments: Intercontinental and Intracontinental Agreements
- Figure 13.1 Patent Analysis: Distribution by Patent Publication Year
- Figure 13.2 Patent Analysis: Distribution by Type of Patent
- Figure 13.3 Patent Analysis: Distribution by Type of Patent and Publication Year
- Figure 13.4 Patent Analysis: Distribution by Patent Application Year
- Figure 13.5 Patent Analysis: Distribution by Patent Age
- Figure 13.6 Patent Analysis: Distribution by Type of Applicant
- Figure 13.7 Cumulative Year-wise Distribution by Type of Applicant
- Figure 13.8 Patent Analysis: Distribution by Patent Jurisdiction
- Figure 13.9 Leading Industry Players: Distribution by Number of Patents
- Figure 13.10 Leading Non-Industry Players: Distribution by Number of Patents
- Figure 13.11 Leading Inventors: Distribution by Number of Patents
- Figure 13.12 Patent Analysis: Distribution by CPC Symbols
- Figure 13.13 Patent Benchmarking Analysis: Distribution of Patent Characteristics (CPC Codes) by Leading Industry Players
- Figure 13.14 Patent Benchmarking Analysis: Distribution of Leading Industry Players by Patent Characteristics (CPC Codes)
- Figure 13.15 Patent Analysis: Patent Valuation
- Figure 15.1 Global Annual Demand for Phosphoramidites, (Metric Tonnes)
- Figure 15.2 Global Annual Demand for Phosphoramidites: Distribution by Type of Phosphoramidite, (Metric Tonnes)
- Figure 15.3 Global Annual Demand for Phosphoramidites: Distribution by Type of Oligonucleotide Synthesized, (Metric Tonnes)
- Figure 15.4 Global Annual Demand for Phosphoramidites: Distribution by Application Area, (Metric Tonnes)
- Figure 15.5 Global Annual Demand for Phosphoramidites: Distribution by Therapeutic Area, (Metric Tonnes)
- Figure 15.6 Global Annual Demand for Phosphoramidites: Distribution by Geographical Regions, (Metric Tonnes)
- Figure 16.1 Global Phosphoramidite Market, Historical Trends (Since 2023) and Forecasted Estimates (Till 2035) (USD Million)
- Figure 16.2 Global Phosphoramidite Market, Forecasted Estimates (Till 2035): Conservative Scenario (USD Million)
- Figure 16.3 Global Phosphoramidite Market, Forecasted Estimates (Till 2035): Optimistic Scenario (USD Million)
- Figure 17.1 Phosphoramidite Market: Distribution by Type of Phosphoramidite
- Figure 17.2 Phosphoramidite Market for DNA Phosphoramidites, Historical Trends (Since 2023) and Forecasted Estimates (Till 2035) (USD Million)
- Figure 17.3 Phosphoramidite Market for RNA Phosphoramidites, Historical Trends (Since 2023) and Forecasted Estimates (Till 2035) (USD Million)
- Figure 17.4 Phosphoramidite Market for 2'-Modified Phosphoramidites, Historical Trends (Since 2023) and Forecasted Estimates (Till 2035) (USD Million)
- Figure 17.5 Phosphoramidite Market for Locked Nucleic Acid (LNA), Historical Trends (Since 2023) and Forecasted Estimates (Till 2035) (USD Million)
- Figure 17.6 Phosphoramidite Market for Other Phosphoramidites, Historical Trends (Since 2023) and Forecasted Estimates (Till 2035) (USD Million)
- Figure 18.1 Phosphoramidite Market: Distribution by Type of Oligonucleotide Synthesized
- Figure 18.2 Phosphoramidite Market for siRNA Oligonucleotides, Historical Trends (Since 2023) and Forecasted Estimates (Till 2035) (USD Million)
- Figure 18.3 Phosphoramidite Market for Antisense Oligonucleotides, Historical Trends (Since 2023) and Forecasted Estimates (Till 2035) (USD Million)
- Figure 18.4 Phosphoramidite Market for DNA Oligonucleotides, Historical Trends (Since 2023) and Forecasted Estimates (Till 2035) (USD Million)
- Figure 18.5 Phosphoramidite Market for Other Oligonucleotides, Historical Trends (Since 2023) and Forecasted Estimates (Till 2035) (USD Million)
- Figure 19.1 Phosphoramidite Market: Distribution by Application Area
- Figure 19.2 Phosphoramidite Market for Research and Diagnostic Applications, Historical Trends (Since 2023) and Forecasted Estimates (Till 2035) (USD Million)
- Figure 19.3 Phosphoramidite Market for Commercial Therapeutic Applications, Historical Trends (Since 2023) and Forecasted Estimates (Till 2035) (USD Million)
- Figure 19.4 Phosphoramidite Market for Clinical Therapeutic Applications, Historical Trends (Since 2023) and Forecasted Estimates (Till 2035) (USD Million)
- Figure 20.1 Phosphoramidite Market: Distribution by Therapeutic Area
- Figure 20.2 Phosphoramidite Market for Infectious Diseases, Historical Trends (Since 2023) and Forecasted Estimates (Till 2035) (USD Million)
- Figure 20.3 Phosphoramidite Market for Cardiovascular Disorders, Historical Trends (Since 2023) and Forecasted Estimates (Till 2035) (USD Million)
- Figure 20.4 Phosphoramidite Market for Genetic Disorders, Historical Trends (Since 2023) and Forecasted Estimates (Till 2035) (USD Million)
- Figure 20.5 Phosphoramidite Market for Metabolic Disorders, Historical Trends (Since 2023) and Forecasted Estimates (Till 2035) (USD Million)
- Figure 20.6 Phosphoramidite Market for Liver Disorders, Historical Trends (Since 2023) and Forecasted Estimates (Till 2035) (USD Million)
- Figure 20.7 Phosphoramidite Market for Autoimmune Disorders, Historical Trends (Since 2023) and Forecasted Estimates (Till 2035) (USD Million)
- Figure 20.8 Phosphoramidite Market for Oncological Disorders, Historical Trends (Since 2023) and Forecasted Estimates (Till 2035) (USD Million)
- Figure 20.9 Phosphoramidite Market for Nephrological Disorders, Historical Trends (Since 2023) and Forecasted Estimates (Till 2035) (USD Million)
- Figure 20.10 Phosphoramidite Market for Ophthalmological Disorders, Historical Trends (Since 2023) and Forecasted Estimates (Till 2035) (USD Million)
- Figure 20.11 Phosphoramidite Market for Neurological Disorders, Historical Trends (Since 2023) and Forecasted Estimates (Till 2035) (USD Million)
- Figure 20.12 Phosphoramidite Market for Hematological Disorders, Historical Trends (Since 2023) and Forecasted Estimates (Till 2035) (USD Million)
- Figure 20.13 Phosphoramidite Market for Other Disorders, Historical Trends (Since 2023) and Forecasted Estimates (Till 2035) (USD Million)
- Figure 21.1 Phosphoramidite Market: Distribution by Geographical Regions
- Figure 21.2 Phosphoramidite Market in North America, Historical Trends (Since 2023) and Forecasted Estimates (Till 2035) (USD Million)
- Figure 21.3 Phosphoramidite Market in the US, Historical Trends (Since 2023) and Forecasted Estimates (Till 2035) (USD Million)
- Figure 21.4 Phosphoramidite Market in Canada, Historical Trends (Since 2023) and Forecasted Estimates (Till 2035) (USD Million)
- Figure 21.5 Phosphoramidite Market in Europe, Historical Trends (Since 2023) and Forecasted Estimates (Till 2035) (USD Million)
- Figure 21.6 Phosphoramidite Market in Germany, Historical Trends (Since 2023) and Forecasted Estimates (Till 2035) (USD Million)
- Figure 21.7 Phosphoramidite Market in France, Historical Trends (Since 2023) and Forecasted Estimates (Till 2035) (USD Million)
- Figure 21.8 Phosphoramidite Market in Italy, Historical Trends (Since 2023) and Forecasted Estimates (Till 2035) (USD Million)
- Figure 21.9 Phosphoramidite Market in Spain, Historical Trends (Since 2023) and Forecasted Estimates (Till 2035) (USD Million)
- Figure 21.10 Phosphoramidite Market in the UK, Historical Trends (Since 2023) and Forecasted Estimates (Till 2035) (USD Million)
- Figure 21.11 Phosphoramidite Market in Rest of Europe, Historical Trends (Since 2023) and Forecasted Estimates (Till 2035) (USD Million)
- Figure 21.12 Phosphoramidite Market in Asia-Pacific, Historical Trends (Since 2023) and Forecasted Estimates (Till 2035) (USD Million)
- Figure 21.13 Phosphoramidite Market in China, Historical Trends (Since 2023) and Forecasted Estimates (Till 2035) (USD Million)
- Figure 21.14 Phosphoramidite Market in India, Historical Trends (Since 2023) and Forecasted Estimates (Till 2035) (USD Million)
- Figure 21.15 Phosphoramidite Market in Japan, Historical Trends (Since 2023) and Forecasted Estimates (Till 2035) (USD Million)
- Figure 21.16 Phosphoramidite Market in South Korea, Historical Trends (Since 2023) and Forecasted Estimates (Till 2035) (USD Million)
- Figure 21.17 Phosphoramidite Market in Australia, Historical Trends (Since 2023) and Forecasted Estimates (Till 2035) (USD Million)
- Figure 21.18 Phosphoramidite Market in Rest of Asia-Pacific, Historical Trends (Since 2023) and Forecasted Estimates (Till 2035) (USD Million)
- Figure 21.19 Phosphoramidite Market in Latin America, Historical Trends (Since 2023) and Forecasted Estimates (Till 2035) (USD Million)
- Figure 21.20 Phosphoramidite Market in Brazil, Historical Trends (Since 2023) and Forecasted Estimates (Till 2035) (USD Million)
- Figure 21.21 Phosphoramidite Market in Argentina, Historical Trends (Since 2023) and Forecasted Estimates (Till 2035) (USD Million)
- Figure 21.22 Phosphoramidite Market in Mexico, Historical Trends (Since 2023) and Forecasted Estimates (Till 2035) (USD Million)
- Figure 21.23 Phosphoramidite Market in Rest of Latin America, Historical Trends (Since 2023) and Forecasted Estimates (Till 2035) (USD Million)
- Figure 21.24 Phosphoramidite Market in Middle East and North Africa, Historical Trends (Since 2023) and Forecasted Estimates (Till 2035) (USD Million)
- Figure 21.25 Phosphoramidite Market in Egypt, Historical Trends (Since 2023) and Forecasted Estimates (Till 2035) (USD Million)
- Figure 21.26 Phosphoramidite Market in Israel, Historical Trends (Since 2023) and Forecasted Estimates (Till 2035) (USD Million)
- Figure 21.27 Phosphoramidite Market in Saudi Arabia, Historical Trends (Since 2023) and Forecasted Estimates (Till 2035) (USD Million)
- Figure 21.28 Phosphoramidite Market in Rest of Middle East and North Africa, Historical Trends (Since 2023) and Forecasted Estimates (Till 2035) (USD Million)
- Figure 21.29 Market Movement Analysis: Geographical Regions
- Figure 21.30 Penetration Growth Matrix: Geographical Regions
 亞磷醯胺市場:按類型、形態、應用和最終用戶分類-2026-2032年全球市場預測
 2026年全球亞磷醯胺市場報告
 亞磷醯胺市場分析及預測(至2035年):依類型、產品、服務、技術、應用、形態、最終用戶及功能分類2'-OMe-C 淋巴醯胺市場按產品類型、應用、最終用戶和分銷管道分類,全球預測,2026-2032 年2'-OMe-G亞磷醯胺市場按產品類型、應用、最終用戶和分銷管道分類,全球預測,2026-2032年2'-OMe-Ibu-G亞磷醯胺市場按純度等級、產品形式、方法、應用和最終用戶分類 - 全球預測(2026-2032)DMT-dG亞磷醯胺市場按純度等級、合成規模、技術、應用和最終用戶分類,全球預測,2026-2032年
 亞磷醯胺:市場佔有率分析、產業趨勢與統計、成長預測(2026-2031)
 亞磷醯胺市場-全球產業規模、佔有率、趨勢、機會和預測,按類型、應用、地區和競爭細分,2020-2030 年
 亞磷醯胺市場規模、佔有率和趨勢分析報告:按類型、應用、最終用途、地區和細分市場預測,2025 年至 2033 年