


 |
市場調查報告書
商品編碼
1771410
碳足跡管理市場:產業趨勢及全球預測(~2035年):依組件、部署類型、組織規模、垂直產業和地區Carbon Footprint Management Market, Till 2035: Distribution by Type of Component, Type of Deployment, Organization Size, Type of Vertical, and Geographical Regions: Industry Trends and Global Forecast |
||||||
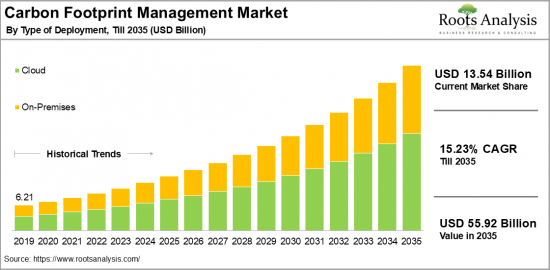
預計全球碳足跡管理市場規模將從目前的135.4億美元成長至2035年的559.2億美元,預測期內的年複合成長率為 15.23%。
碳足跡管理市場機會(依細分市場)
元件類型
- 解決方案
- 服務
依部署類型
- 雲端
- 本地部署
依組織規模
- 大型企業
- 中型企業
- 中小企業
依產業領域
- 能源公用事業
- 金融服務
- 政府
- IT 與通信
- 製造業
- 住宅與商業建築
- 運輸與物流
依地區
- 北美
- 美國
- 加拿大
- 墨西哥
- 其他北美地區國家
- 歐洲
- 奧地利
- 比利時
- 丹麥
- 法國
- 德國
- 愛爾蘭
- 義大利
- 荷蘭
- 挪威
- 俄羅斯
- 西班牙
- 瑞典
- 瑞士
- 英國
- 其他歐洲國家
- 亞洲
- 中國
- 印度
- 日本
- 新加坡
- 韓國
- 其他亞洲國家
- 拉丁美洲
- 巴西
- 智利
- 哥倫比亞
- 委內瑞拉
- 其他拉丁美洲國家
- 中東和北非
- 埃及
- 伊朗
- 伊拉克
- 以色列
- 科威特
- 沙烏地阿拉伯
- 阿拉伯聯合大公國
- 其他中東和北非國家
- 世界其他地區
- 澳洲
- 紐西蘭
- 其他國家
碳足跡管理市場:成長與趨勢
碳足跡是指人類日常活動排放的溫室氣體總量。借助先進的碳足跡測量軟體和工具,可以對碳足跡進行技術管理。這些管理解決方案包括追蹤、減少和抵消溫室氣體排放的過程。此外,這些全面的解決方案可以幫助企業、政府和個人參與氣候變遷行動,使他們能夠設定減排目標、實施策略、監測和報告進度等。
因此,全球碳足跡管理市場經歷了顯著成長。根據聯合國報告,約佔全球溫室氣體排放量82%的107個國家已透過法律和國家氣候行動計畫等政策設定了淨零排放目標。
這主要是因為政府政策對碳排放有顯著影響,而減排是透過推廣再生能源、制定排放標準和推動永續發展努力來實現的。此外,聯合國環境規劃署(UNEP)呼籲各國在2030年將溫室氣體排放量減少42%。 這主要是因為政府政策對碳排放有顯著影響。法規和政策可以發揮減排作用,例如推廣再生能源、制定排放標準以及在各行業推廣永續實踐。此外,聯合國環境規劃署(UNEP)建議各國到2030年將溫室氣體排放量減少42%。
在此背景下,各國政府實施氣候變遷減緩策略以實現這些目標,顯示各國對溫室氣體排放管理的重視程度提升。此外,人們對引進人工智慧等數位工具和技術(例如用於碳追蹤的人工智慧)的興趣日益濃厚,以及對碳核算服務的需求不斷成長,都是推動碳足跡管理市場成長的主要因素。
本報告調查了全球碳足跡管理市場,並總結了市場概況、背景、市場影響因素分析、市場規模趨勢和預測、各細分市場和地區的詳細分析、競爭狀況以及主要公司的概況。
目錄
第一部分:報告概述
第1章 引言
第2章 研究方法
第3章 市場動態
第4章 宏觀經濟指標
第二部分:定性洞察
第5章 執行摘要
第6章 介紹
第7章 監理情境
第三部分:市場概況
第8章 關鍵資料綜合資料庫參與者
第9章 競爭格局
第10章 空白領域分析
第11章 競爭分析
第12章 碳足跡管理市場新創企業生態系
第四部分:公司簡介
第13章 公司簡介
- 章節概述
- Accuvio
- Carbon Footprint
- Carbon Trust
- Dakota Software
- Eco Tack
- Enablon
- EnergyCap
- ENGIE
- Enviance
- Envirsoft
- ESP
- IBM
- Intelex
- Isometrix
- Locus Technologies
- NativeEnergy
- ProcessMap
- Salesforce
- SAP
- Schneider
- Trinity
第五部分:市場趨勢
第14章 大趨勢分析
第15章 未滿足的需求分析
第16章 專利分析
第17章 近期趨勢
第六部分:市場機會分析
第18章 全球碳足跡管理市場
第19章 依組件劃分的市場機會
第20章 依部署類型劃分的市場機會
第21章 依組織規模劃分的市場機會
第22章 依垂直產業劃分的市場機會
第23章 北美碳足跡管理的市場機會
第24章 歐洲碳足跡管理的市場機會
第25章 亞洲碳足跡管理的市場機會
第26章 中東和北非碳足跡管理的市場機會
第27章 拉丁美洲碳足跡管理的市場機會
第28章 世界其他地區碳足跡管理的市場機會
第29章 鄰近市場分析
第七部分:策略工具
第30章 致勝策略
第31章 波特五力分析
第32章 SWOT分析
第33章 價值鏈分析
第34章 ROOTS策略建議
第八部分:其他獨家見解
第35章 初步研究見解
第36章 報告結論
第九部分:附錄
第37章 表格資料
第38章 公司與組織清單
第39章 客製化機會
第40章 ROOTS訂閱服務
第41章 作者詳情
Carbon Footprint Management Market Overview
As per Roots Analysis, the global carbon footprint management market size is estimated to grow from USD 13.54 billion in the current year to USD 55.92 billion by 2035, at a CAGR of 15.23% during the forecast period, till 2035.
The opportunity for carbon footprint management market has been distributed across the following segments:
Type of Component
- Solution
- Service
Type of Deployment
- Cloud
- On-Premises
Organization Size
- Corporate Enterprises
- Mid-Tier Enterprises
- Small Business
Type of Vertical
- Energy Utilities
- Financial Service
- Government
- IT and Telecom
- Manufacturing
- Residential and Commercial Buildings
- Transportation and Logistics
Geographical Regions
- North America
- US
- Canada
- Mexico
- Other North American countries
- Europe
- Austria
- Belgium
- Denmark
- France
- Germany
- Ireland
- Italy
- Netherlands
- Norway
- Russia
- Spain
- Sweden
- Switzerland
- UK
- Other European countries
- Asia
- China
- India
- Japan
- Singapore
- South Korea
- Other Asian countries
- Latin America
- Brazil
- Chile
- Colombia
- Venezuela
- Other Latin American countries
- Middle East and North Africa
- Egypt
- Iran
- Iraq
- Israel
- Kuwait
- Saudi Arabia
- UAE
- Other MENA countries
- Rest of the World
- Australia
- New Zealand
- Other countries
CARBON FOOTPRINT MANAGEMENT MARKET: GROWTH AND TRENDS
The term "carbon footprint" refers to the overall quantity of greenhouse gases produced by everyday human activities. Through the use of technology, this can be managed with advanced software and tools designed for measuring carbon footprints. These management solutions encompass tracking, reducing, and offsetting greenhouse gas emissions. Additionally, these comprehensive solutions help businesses, governments, and individuals participate in combating climate change by establishing reduction targets, implementing strategies, and monitoring as well as reporting on progress.
Consequently, the market for carbon footprint management is experiencing significant growth worldwide. A report from the UN indicates that approximately 107 countries, responsible for about 82% of greenhouse gas emissions, have committed to net-zero targets either through legislation or policies, such as national climate action plans.
This is largely because government policies have a considerable impact on carbon emissions; regulations and incentives can lead to reductions by promoting renewable energy, imposing emission standards, and fostering sustainable practices across various industries. Additionally, the UN Environmental Program (UNEP) suggests that nations should aim to reduce greenhouse gas emissions by 42% by the year 2030.
As a result, governments are implementing climate change mitigation strategies to achieve these objectives, indicating a focus on managing greenhouse gas emissions. Moreover, the increasing emphasis on the integration of technology, including digital tools and AI for carbon tracking, as well as the rising demand for carbon accounting services, are key drivers for the growth of carbon footprint management market during the forecast period.
CARBON FOOTPRINT MANAGEMENT MARKET: KEY SEGMENTS
Market Share by Type of Component
Based on type of component, the global carbon footprint management market is segmented into solutions and service. According to our estimates, currently, the service segment captures the majority share of the market. This can be attributed to the increasing demand for consulting training alongside the need for cost-effective operational and implementation support.
However, the solutions segment is expected to grow at a relatively higher CAGR during the forecast period. This growth can be attributed to fact that these tools assist organizations in efficiently monitoring, analyzing, and reporting their carbon emissions. Additionally, software solutions facilitate real-time emissions tracking across different operations, offering valuable insights for minimizing carbon emissions and aiding in compliance with regulatory reporting requirements.
Market Share by Type of Deployment
Based on type of deployment, the carbon footprint management market is segmented into cloud and on-premises. According to our estimates, currently, lithium captures the majority of the market. Additionally, this segment is likely to grow at a higher CAGR during the forecast period. This can be attributed to the widespread adoption of cloud-based carbon footprint management software and services.
These solutions offer secure and cost-effective tools for tracking carbon emissions and reliable support. Further, their flexibility, scalability, and ease of implementation is fueling the expansion of this market
Market Share by Organization Size
Based on organization size, the carbon footprint management market is segmented into corporate enterprises, mid-tier enterprises, and small businesses. According to our estimates, currently, corporate enterprise segment captures the majority share of the market. This can be attributed to their complicated operations, extensive emissions, and growing demands from investors. Carbon management solutions are essential for their operations in fulfilling ESG requirements.
However, small businesses segment is expected to experience the highest compound annual growth rate (CAGR) during the forecast period, owing to the strict regulatory compliance and government pressure that urge companies to invest in carbon offset initiatives and adopt effective practices for minimizing carbon emissions.
Market Share by Type of Vertical
Based on type of vertical, the carbon footprint management market is segmented into energy utilities, financial services, government, IT and telecom, manufacturing, residential and commercial buildings, and transportation and logistics. According to our estimates, currently, energy and utilities segment captures the majority share of the market. However, the manufacturing sector is expected to grow at a higher compound annual growth rate (CAGR) during the forecast period.
Market Share by Geographical Regions
Based on geographical regions, the carbon footprint management market is segmented into North America, Europe, Asia, Latin America, Middle East and North Africa, and the rest of the world. According to our estimates, currently, North America captures the majority share of the market. However, the market in Asia is expected to grow at a higher compound annual growth rate (CAGR) during the forecast period. This can be attributed to the rapid industrial development and urbanization in the region, which have resulted in high carbon emissions. To mitigate emissions, developing nations are increasingly investing in carbon footprint management solutions and services.
Example Players in Carbon Footprint Management Market
- Accuvio
- Carbon Footprint
- Carbon Trust
- Dakota Software
- Eco Tack
- Enablon
- EnergyCap
- ENGIE
- Enviance
- Envirsoft
- ESP
- IBM
- Intelex
- Isometrix
- Locus Technologies
- NativeEnergy
- ProcessMap
- Salesforce
- SAP
- Schneider
- Trinity
CARBON FOOTPRINT MANAGEMENT MARKET: RESEARCH COVERAGE
The report on the carbon footprint management market features insights on various sections, including:
- Market Sizing and Opportunity Analysis: An in-depth analysis of the carbon footprint management market, focusing on key market segments, including [A] type of component, [B] type of deployment, [C] organization size, [D] type of vertical, and [E] geographical regions.
- Competitive Landscape: A comprehensive analysis of the companies engaged in the carbon footprint management market, based on several relevant parameters, such as [A] year of establishment, [B] company size, [C] location of headquarters and [D] ownership structure.
- Company Profiles: Elaborate profiles of prominent players engaged in the carbon footprint management market, providing details on [A] location of headquarters, [B] company size, [C] company mission, [D] company footprint, [E] management team, [F] contact details, [G] financial information, [H] operating business segments, [I] service / product portfolio, [J] moat analysis, [K] recent developments, and an informed future outlook.
- Megatrends: An evaluation of ongoing megatrends in the carbon footprint management industry.
- Patent Analysis: An insightful analysis of patents filed / granted in the carbon footprint management domain, based on relevant parameters, including [A] type of patent, [B] patent publication year, [C] patent age and [D] leading players.
- Recent Developments: An overview of the recent developments made in the carbon footprint management market, along with analysis based on relevant parameters, including [A] year of initiative, [B] type of initiative, [C] geographical distribution and [D] most active players.
- Porter's Five Forces Analysis: An analysis of five competitive forces prevailing in the carbon footprint management market, including threats of new entrants, bargaining power of buyers, bargaining power of suppliers, threats of substitute products and rivalry among existing competitors.
- SWOT Analysis: An insightful SWOT framework, highlighting the strengths, weaknesses, opportunities and threats in the domain. Additionally, it provides Harvey ball analysis, highlighting the relative impact of each SWOT parameter.
- Value Chain Analysis: A comprehensive analysis of the value chain, providing information on the different phases and stakeholders involved in the carbon footprint management domain.
KEY QUESTIONS ANSWERED IN THIS REPORT
- How many companies are currently engaged in carbon footprint management market?
- Which are the leading companies in this market?
- What factors are likely to influence the evolution of this market?
- What is the current and future market size?
- What is the CAGR of this market?
- How is the current and future market opportunity likely to be distributed across key market segments?
REASONS TO BUY THIS REPORT
- The report provides a comprehensive market analysis, offering detailed revenue projections of the overall market and its specific sub-segments. This information is valuable to both established market leaders and emerging entrants.
- Stakeholders can leverage the report to gain a deeper understanding of the competitive dynamics within the market. By analyzing the competitive landscape, businesses can make informed decisions to optimize their market positioning and develop effective go-to-market strategies.
- The report offers stakeholders a comprehensive overview of the market, including key drivers, barriers, opportunities, and challenges. This information empowers stakeholders to stay abreast of market trends and make data-driven decisions to capitalize on growth prospects.
ADDITIONAL BENEFITS
- Complimentary Excel Data Packs for all Analytical Modules in the Report
- 15% Free Content Customization
- Detailed Report Walkthrough Session with Research Team
- Free Updated report if the report is 6-12 months old or older
TABLE OF CONTENTS
SECTION I: REPORT OVERVIEW
1. PREFACE
- 1.1. Introduction
- 1.2. Market Share Insights
- 1.3. Key Market Insights
- 1.4. Report Coverage
- 1.5. Key Questions Answered
- 1.6. Chapter Outlines
2. RESEARCH METHODOLOGY
- 2.1. Chapter Overview
- 2.2. Research Assumptions
- 2.3. Database Building
- 2.3.1. Data Collection
- 2.3.2. Data Validation
- 2.3.3. Data Analysis
- 2.4. Project Methodology
- 2.4.1. Secondary Research
- 2.4.1.1. Annual Reports
- 2.4.1.2. Academic Research Papers
- 2.4.1.3. Company Websites
- 2.4.1.4. Investor Presentations
- 2.4.1.5. Regulatory Filings
- 2.4.1.6. White Papers
- 2.4.1.7. Industry Publications
- 2.4.1.8. Conferences and Seminars
- 2.4.1.9. Government Portals
- 2.4.1.10. Media and Press Releases
- 2.4.1.11. Newsletters
- 2.4.1.12. Industry Databases
- 2.4.1.13. Roots Proprietary Databases
- 2.4.1.14. Paid Databases and Sources
- 2.4.1.15. Social Media Portals
- 2.4.1.16. Other Secondary Sources
- 2.4.2. Primary Research
- 2.4.2.1. Introduction
- 2.4.2.2. Types
- 2.4.2.2.1. Qualitative
- 2.4.2.2.2. Quantitative
- 2.4.2.3. Advantages
- 2.4.2.4. Techniques
- 2.4.2.4.1. Interviews
- 2.4.2.4.2. Surveys
- 2.4.2.4.3. Focus Groups
- 2.4.2.4.4. Observational Research
- 2.4.2.4.5. Social Media Interactions
- 2.4.2.5. Stakeholders
- 2.4.2.5.1. Company Executives (CXOs)
- 2.4.2.5.2. Board of Directors
- 2.4.2.5.3. Company Presidents and Vice Presidents
- 2.4.2.5.4. Key Opinion Leaders
- 2.4.2.5.5. Research and Development Heads
- 2.4.2.5.6. Technical Experts
- 2.4.2.5.7. Subject Matter Experts
- 2.4.2.5.8. Scientists
- 2.4.2.5.9. Doctors and Other Healthcare Providers
- 2.4.2.6. Ethics and Integrity
- 2.4.2.6.1. Research Ethics
- 2.4.2.6.2. Data Integrity
- 2.4.3. Analytical Tools and Databases
- 2.4.1. Secondary Research
3. MARKET DYNAMICS
- 3.1. Forecast Methodology
- 3.1.1. Top-Down Approach
- 3.1.2. Bottom-Up Approach
- 3.1.3. Hybrid Approach
- 3.2. Market Assessment Framework
- 3.2.1. Total Addressable Market (TAM)
- 3.2.2. Serviceable Addressable Market (SAM)
- 3.2.3. Serviceable Obtainable Market (SOM)
- 3.2.4. Currently Acquired Market (CAM)
- 3.3. Forecasting Tools and Techniques
- 3.3.1. Qualitative Forecasting
- 3.3.2. Correlation
- 3.3.3. Regression
- 3.3.4. Time Series Analysis
- 3.3.5. Extrapolation
- 3.3.6. Convergence
- 3.3.7. Forecast Error Analysis
- 3.3.8. Data Visualization
- 3.3.9. Scenario Planning
- 3.3.10. Sensitivity Analysis
- 3.4. Key Considerations
- 3.4.1. Demographics
- 3.4.2. Market Access
- 3.4.3. Reimbursement Scenarios
- 3.4.4. Industry Consolidation
- 3.5. Robust Quality Control
- 3.6. Key Market Segmentations
- 3.7. Limitations
4. MACRO-ECONOMIC INDICATORS
- 4.1. Chapter Overview
- 4.2. Market Dynamics
- 4.2.1. Time Period
- 4.2.1.1. Historical Trends
- 4.2.1.2. Current and Forecasted Estimates
- 4.2.2. Currency Coverage
- 4.2.2.1. Overview of Major Currencies Affecting the Market
- 4.2.2.2. Impact of Currency Fluctuations on the Industry
- 4.2.3. Foreign Exchange Impact
- 4.2.3.1. Evaluation of Foreign Exchange Rates and Their Impact on Market
- 4.2.3.2. Strategies for Mitigating Foreign Exchange Risk
- 4.2.4. Recession
- 4.2.4.1. Historical Analysis of Past Recessions and Lessons Learnt
- 4.2.4.2. Assessment of Current Economic Conditions and Potential Impact on the Market
- 4.2.5. Inflation
- 4.2.5.1. Measurement and Analysis of Inflationary Pressures in the Economy
- 4.2.5.2. Potential Impact of Inflation on the Market Evolution
- 4.2.6. Interest Rates
- 4.2.6.1. Overview of Interest Rates and Their Impact on the Market
- 4.2.6.2. Strategies for Managing Interest Rate Risk
- 4.2.7. Commodity Flow Analysis
- 4.2.7.1. Type of Commodity
- 4.2.7.2. Origins and Destinations
- 4.2.7.3. Values and Weights
- 4.2.7.4. Modes of Transportation
- 4.2.8. Global Trade Dynamics
- 4.2.8.1. Import Scenario
- 4.2.8.2. Export Scenario
- 4.2.9. War Impact Analysis
- 4.2.9.1. Russian-Ukraine War
- 4.2.9.2. Israel-Hamas War
- 4.2.10. COVID Impact / Related Factors
- 4.2.10.1. Global Economic Impact
- 4.2.10.2. Industry-specific Impact
- 4.2.10.3. Government Response and Stimulus Measures
- 4.2.10.4. Future Outlook and Adaptation Strategies
- 4.2.11. Other Indicators
- 4.2.11.1. Fiscal Policy
- 4.2.11.2. Consumer Spending
- 4.2.11.3. Gross Domestic Product (GDP)
- 4.2.11.4. Employment
- 4.2.11.5. Taxes
- 4.2.11.6. R&D Innovation
- 4.2.11.7. Stock Market Performance
- 4.2.11.8. Supply Chain
- 4.2.11.9. Cross-Border Dynamics
- 4.2.1. Time Period
SECTION II: QUALITATIVE INSIGHTS
5. EXECUTIVE SUMMARY
6. INTRODUCTION
- 6.1. Chapter Overview
- 6.2. Overview of Carbon Footprint Management Market
- 6.2.1. Type of Component
- 6.2.2. Type of Deployment
- 6.2.3. Organization Size
- 6.2.4. Type of Vertical
- 6.3. Future Perspective
7. REGULATORY SCENARIO
SECTION III: MARKET OVERVIEW
8. COMPREHENSIVE DATABASE OF LEADING PLAYERS
9. COMPETITIVE LANDSCAPE
- 9.1. Chapter Overview
- 9.2. Carbon Footprint Management: Overall Market Landscape
- 9.2.1. Analysis by Year of Establishment
- 9.2.2. Analysis by Company Size
- 9.2.3. Analysis by Location of Headquarters
- 9.2.4. Analysis by Ownership Structure
10. WHITE SPACE ANALYSIS
11. COMPANY COMPETITIVENESS ANALYSIS
12. STARTUP ECOSYSTEM IN THE CARBON FOOTPRINT MANAGEMENT MARKET
- 12.1. Carbon Footprint Management: Market Landscape of Startups
- 12.1.1. Analysis by Year of Establishment
- 12.1.2. Analysis by Company Size
- 12.1.3. Analysis by Company Size and Year of Establishment
- 12.1.4. Analysis by Location of Headquarters
- 12.1.5. Analysis by Company Size and Location of Headquarters
- 12.1.6. Analysis by Ownership Structure
- 12.2. Key Findings
SECTION IV: COMPANY PROFILES
13. COMPANY PROFILES
- 13.1. Chapter Overview
- 13.2. Accuvio*
- 13.2.1. Company Overview
- 13.2.2. Company Mission
- 13.2.3. Company Footprint
- 13.2.4. Management Team
- 13.2.5. Contact Details
- 13.2.6. Financial Performance
- 13.2.7. Operating Business Segments
- 13.2.8. Service / Product Portfolio (project specific)
- 13.2.9. MOAT Analysis
- 13.2.10. Recent Developments and Future Outlook
- 13.3. Carbon Footprint
- 13.4. Carbon Trust
- 13.5. Dakota Software
- 13.6. Eco Tack
- 13.7. Enablon
- 13.8. EnergyCap
- 13.9. ENGIE
- 13.10. Enviance
- 13.11. Envirsoft
- 13.12. ESP
- 13.13. IBM
- 13.14. Intelex
- 13.15. Isometrix
- 13.16. Locus Technologies
- 13.17. NativeEnergy
- 13.18. ProcessMap
- 13.19. Salesforce
- 13.20. SAP
- 13.21. Schneider
- 13.22. Trinity
SECTION V: MARKET TRENDS
14. MEGA TRENDS ANALYSIS
15. UNMEET NEED ANALYSIS
16. PATENT ANALYSIS
17. RECENT DEVELOPMENTS
- 17.1. Chapter Overview
- 17.2. Recent Funding
- 17.3. Recent Partnerships
- 17.4. Other Recent Initiatives
SECTION VI: MARKET OPPORTUNITY ANALYSIS
18. GLOBAL CARBON FOOTPRINT MANAGEMENT MARKET
- 18.1. Chapter Overview
- 18.2. Key Assumptions and Methodology
- 18.3. Trends Disruption Impacting Market
- 18.4. Demand Side Trends
- 18.5. Supply Side Trends
- 18.6. Global Carbon Footprint Management Market, Historical Trends (Since 2019) and Forecasted Estimates (Till 2035)
- 18.7. Multivariate Scenario Analysis
- 18.7.1. Conservative Scenario
- 18.7.2. Optimistic Scenario
- 18.8. Investment Feasibility Index
- 18.9. Key Market Segmentations
19. MARKET OPPORTUNITIES BASED ON TYPE OF COMPONENT
- 19.1. Chapter Overview
- 19.2. Key Assumptions and Methodology
- 19.3. Revenue Shift Analysis
- 19.4. Market Movement Analysis
- 19.5. Penetration-Growth (P-G) Matrix
- 19.6. Carbon Footprint Management Market for Solution: Historical Trends (Since 2019) and Forecasted Estimates (Till 2035)
- 19.7. Carbon Footprint Management Market for Service: Historical Trends (Since 2019) and Forecasted Estimates (Till 2035)
- 19.8. Data Triangulation and Validation
- 19.8.1. Secondary Sources
- 19.8.2. Primary Sources
- 19.8.3. Statistical Modeling
20. MARKET OPPORTUNITIES BASED ON TYPE OF DEPLOYMENT
- 20.1. Chapter Overview
- 20.2. Key Assumptions and Methodology
- 20.3. Revenue Shift Analysis
- 20.4. Market Movement Analysis
- 20.5. Penetration-Growth (P-G) Matrix
- 20.6. Carbon Footprint Management Market for Cloud: Historical Trends (Since 2019) and Forecasted Estimates (Till 2035)
- 20.7. Carbon Footprint Management Market for On-Premises: Historical Trends (Since 2019) and Forecasted Estimates (Till 2035)
- 20.8. Data Triangulation and Validation
- 20.8.1. Secondary Sources
- 20.8.2. Primary Sources
- 20.8.3. Statistical Modeling
21. MARKET OPPORTUNITIES BASED ON ORGANIZATION SIZE
- 21.1. Chapter Overview
- 21.2. Key Assumptions and Methodology
- 21.3. Revenue Shift Analysis
- 21.4. Market Movement Analysis
- 21.5. Penetration-Growth (P-G) Matrix
- 21.6. Carbon Footprint Management Market for Corporate Enterprises: Historical Trends (Since 2019) and Forecasted Estimates (Till 2035)
- 21.7. Carbon Footprint Management Market for Mid-Tier Enterprises: Historical Trends (Since 2019) and Forecasted Estimates (Till 2035)
- 21.8. Carbon Footprint Management Market for Small Business: Historical Trends (Since 2019) and Forecasted Estimates (Till 2035)
- 21.9. Data Triangulation and Validation
- 21.9.1. Secondary Sources
- 21.9.2. Primary Sources
- 21.9.3. Statistical Modeling
22. MARKET OPPORTUNITIES BASED ON TYPE OF VERTICAL
- 22.1. Chapter Overview
- 22.2. Key Assumptions and Methodology
- 22.3. Revenue Shift Analysis
- 22.4. Market Movement Analysis
- 22.5. Penetration-Growth (P-G) Matrix
- 22.6. Carbon Footprint Management Market for Energy Utilities: Historical Trends (Since 2019) and Forecasted Estimates (Till 2035)
- 22.7. Carbon Footprint Management Market for Financial Service: Historical Trends (Since 2019) and Forecasted Estimates (Till 2035)
- 22.8. Carbon Footprint Management Market for Government: Historical Trends (Since 2019) and Forecasted Estimates (Till 2035)
- 22.9. Carbon Footprint Management Market for IT and Telecom: Historical Trends (Since 2019) and Forecasted Estimates (Till 2035)
- 22.10. Carbon Footprint Management Market for Manufacturing: Historical Trends (Since 2019) and Forecasted Estimates (Till 2035)
- 22.11. Carbon Footprint Management Market for Residential & Commercial Buildings: Historical Trends (Since 2019) and Forecasted Estimates (Till 2035)
- 22.12. Carbon Footprint Management Market for Transportation and Logistics: Historical Trends (Since 2019) and Forecasted Estimates (Till 2035)
- 22.13. Data Triangulation and Validation
- 22.13.1. Secondary Sources
- 22.13.2. Primary Sources
- 22.13.3. Statistical Modeling
23. MARKET OPPORTUNITIES FOR CARBON FOOTPRINT MANAGEMENT IN NORTH AMERICA
- 23.1. Chapter Overview
- 23.2. Key Assumptions and Methodology
- 23.3. Revenue Shift Analysis
- 23.4. Market Movement Analysis
- 23.5. Penetration-Growth (P-G) Matrix
- 23.6. Carbon Footprint Management Market in North America: Historical Trends (Since 2019) and Forecasted Estimates (Till 2035)
- 23.6.1. Carbon Footprint Management Market in the US: Historical Trends (Since 2019) and Forecasted Estimates (Till 2035)
- 23.6.2. Carbon Footprint Management Market in Canada: Historical Trends (Since 2019) and Forecasted Estimates (Till 2035)
- 23.6.3. Carbon Footprint Management Market in Mexico: Historical Trends (Since 2019) and Forecasted Estimates (Till 2035)
- 23.6.4. Carbon Footprint Management Market in Other North American Countries: Historical Trends (Since 2019) and Forecasted Estimates (Till 2035)
- 23.7. Data Triangulation and Validation
24. MARKET OPPORTUNITIES FOR CARBON FOOTPRINT MANAGEMENT IN EUROPE
- 24.1. Chapter Overview
- 24.2. Key Assumptions and Methodology
- 24.3. Revenue Shift Analysis
- 24.4. Market Movement Analysis
- 24.5. Penetration-Growth (P-G) Matrix
- 24.6. Carbon Footprint Management Market in Europe: Historical Trends (Since 2019) and Forecasted Estimates (Till 2035)
- 24.6.1. Carbon Footprint Management Market in Austria: Historical Trends (Since 2019) and Forecasted Estimates (Till 2035)
- 24.6.2. Carbon Footprint Management Market in Belgium: Historical Trends (Since 2019) and Forecasted Estimates (Till 2035)
- 24.6.3. Carbon Footprint Management Market in Denmark: Historical Trends (Since 2019) and Forecasted Estimates (Till 2035)
- 24.6.4. Carbon Footprint Management Market in France: Historical Trends (Since 2019) and Forecasted Estimates (Till 2035)
- 24.6.5. Carbon Footprint Management Market in Germany: Historical Trends (Since 2019) and Forecasted Estimates (Till 2035)
- 24.6.6. Carbon Footprint Management Market in Ireland: Historical Trends (Since 2019) and Forecasted Estimates (Till 2035)
- 24.6.7. Carbon Footprint Management Market in Italy: Historical Trends (Since 2019) and Forecasted Estimates (Till 2035)
- 24.6.8. Carbon Footprint Management Market in Netherlands: Historical Trends (Since 2019) and Forecasted Estimates (Till 2035)
- 24.6.9. Carbon Footprint Management Market in Norway: Historical Trends (Since 2019) and Forecasted Estimates (Till 2035)
- 24.6.10. Carbon Footprint Management Market in Russia: Historical Trends (Since 2019) and Forecasted Estimates (Till 2035)
- 24.6.11. Carbon Footprint Management Market in Spain: Historical Trends (Since 2019) and Forecasted Estimates (Till 2035)
- 24.6.12. Carbon Footprint Management Market in Sweden: Historical Trends (Since 2019) and Forecasted Estimates (Till 2035)
- 24.6.13. Carbon Footprint Management Market in Sweden: Historical Trends (Since 2019) and Forecasted Estimates (Till 2035)
- 24.6.14. Carbon Footprint Management Market in Switzerland: Historical Trends (Since 2019) and Forecasted Estimates (Till 2035)
- 24.6.15. Carbon Footprint Management Market in the UK: Historical Trends (Since 2019) and Forecasted Estimates (Till 2035)
- 24.6.16. Carbon Footprint Management Market in Other European Countries: Historical Trends (Since 2019) and Forecasted Estimates (Till 2035)
- 24.7. Data Triangulation and Validation
25. MARKET OPPORTUNITIES FOR CARBON FOOTPRINT MANAGEMENT IN ASIA
- 25.1. Chapter Overview
- 25.2. Key Assumptions and Methodology
- 25.3. Revenue Shift Analysis
- 25.4. Market Movement Analysis
- 25.5. Penetration-Growth (P-G) Matrix
- 25.6. Carbon Footprint Management Market in Asia: Historical Trends (Since 2019) and Forecasted Estimates (Till 2035)
- 25.6.1. Carbon Footprint Management Market in China: Historical Trends (Since 2019) and Forecasted Estimates (Till 2035)
- 25.6.2. Carbon Footprint Management Market in India: Historical Trends (Since 2019) and Forecasted Estimates (Till 2035)
- 25.6.3. Carbon Footprint Management Market in Japan: Historical Trends (Since 2019) and Forecasted Estimates (Till 2035)
- 25.6.4. Carbon Footprint Management Market in Singapore: Historical Trends (Since 2019) and Forecasted Estimates (Till 2035)
- 25.6.5. Carbon Footprint Management Market in South Korea: Historical Trends (Since 2019) and Forecasted Estimates (Till 2035)
- 25.6.6. Carbon Footprint Management Market in Other Asian Countries: Historical Trends (Since 2019) and Forecasted Estimates (Till 2035)
- 25.7. Data Triangulation and Validation
26. MARKET OPPORTUNITIES FOR CARBON FOOTPRINT MANAGEMENT IN MIDDLE EAST AND NORTH AFRICA (MENA)
- 26.1. Chapter Overview
- 26.2. Key Assumptions and Methodology
- 26.3. Revenue Shift Analysis
- 26.4. Market Movement Analysis
- 26.5. Penetration-Growth (P-G) Matrix
- 26.6. Carbon Footprint Management Market in Middle East and North Africa (MENA): Historical Trends (Since 2019) and Forecasted Estimates (Till 2035)
- 26.6.1. Carbon Footprint Management Market in Egypt: Historical Trends (Since 2019) and Forecasted Estimates (Till 205)
- 26.6.2. Carbon Footprint Management Market in Iran: Historical Trends (Since 2019) and Forecasted Estimates (Till 2035)
- 26.6.3. Carbon Footprint Management Market in Iraq: Historical Trends (Since 2019) and Forecasted Estimates (Till 2035)
- 26.6.4. Carbon Footprint Management Market in Israel: Historical Trends (Since 2019) and Forecasted Estimates (Till 2035)
- 26.6.5. Carbon Footprint Management Market in Kuwait: Historical Trends (Since 2019) and Forecasted Estimates (Till 2035)
- 26.6.6. Carbon Footprint Management Market in Saudi Arabia: Historical Trends (Since 2019) and Forecasted Estimates (Till 2035)
- 26.6.7. Neuromorphic Computing Marke in United Arab Emirates (UAE): Historical Trends (Since 2019) and Forecasted Estimates (Till 2035)
- 26.6.8. Carbon Footprint Management Market in Other MENA Countries: Historical Trends (Since 2019) and Forecasted Estimates (Till 2035)
- 26.7. Data Triangulation and Validation
27. MARKET OPPORTUNITIES FOR CARBON FOOTPRINT MANAGEMENT IN LATIN AMERICA
- 27.1. Chapter Overview
- 27.2. Key Assumptions and Methodology
- 27.3. Revenue Shift Analysis
- 27.4. Market Movement Analysis
- 27.5. Penetration-Growth (P-G) Matrix
- 27.6. Carbon Footprint Management Market in Latin America: Historical Trends (Since 2019) and Forecasted Estimates (Till 2035)
- 27.6.1. Carbon Footprint Management Market in Argentina: Historical Trends (Since 2019) and Forecasted Estimates (Till 2035)
- 27.6.2. Carbon Footprint Management Market in Brazil: Historical Trends (Since 2019) and Forecasted Estimates (Till 2035)
- 27.6.3. Carbon Footprint Management Market in Chile: Historical Trends (Since 2019) and Forecasted Estimates (Till 2035)
- 27.6.4. Carbon Footprint Management Market in Colombia Historical Trends (Since 2019) and Forecasted Estimates (Till 2035)
- 27.6.5. Carbon Footprint Management Market in Venezuela: Historical Trends (Since 2019) and Forecasted Estimates (Till 2035)
- 27.6.6. Carbon Footprint Management Market in Other Latin American Countries: Historical Trends (Since 2019) and Forecasted Estimates (Till 2035)
- 27.7. Data Triangulation and Validation
28. MARKET OPPORTUNITIES FOR CARBON FOOTPRINT MANAGEMENT IN REST OF THE WORLD
- 28.1. Chapter Overview
- 28.2. Key Assumptions and Methodology
- 28.3. Revenue Shift Analysis
- 28.4. Market Movement Analysis
- 28.5. Penetration-Growth (P-G) Matrix
- 28.6. Carbon Footprint Management Market in Rest of the World: Historical Trends (Since 2019) and Forecasted Estimates (Till 2035)
- 28.6.1. Carbon Footprint Management Market in Australia: Historical Trends (Since 2019) and Forecasted Estimates (Till 2035)
- 28.6.2. Carbon Footprint Management Market in New Zealand: Historical Trends (Since 2019) and Forecasted Estimates (Till 2035)
- 28.6.3. Carbon Footprint Management Market in Other Countries
- 28.7. Data Triangulation and Validation
29. ADJACENT MARKET ANALYSIS
SECTION VII: STRATEGIC TOOLS
30. KEY WINNING STRATEGIES
31. PORTER'S FIVE FORCES ANALYSIS
32. SWOT ANALYSIS
33. VALUE CHAIN ANALYSIS
34. ROOTS STRATEGIC RECOMMENDATIONS
SECTION VIII: OTHER EXCLUSIVE INSIGHTS
35. INSIGHTS FROM PRIMARY RESEARCH
36. REPORT CONCLUSION
SECTION IX: APPENDIX
37. TABULATED DATA
38. LIST OF COMPANIES AND ORGANIZATIONS
39. CUSTOMIZATION OPPORTUNITIES
40. ROOTS SUBSCRIPTION SERVICES
41. AUTHOR DETAILs
 2025年全球碳足跡管理軟體市場報告2025年碳足跡管理全球市場報告
 2025 年至 2033 年碳足跡管理市場報告(按產品、部署模式、最終用途產業和地區分類)
 碳足跡管理市場(按組件、組織規模、最終用戶、部署模型和應用)—2025-2030 年全球預測
 全球碳足跡管理市場(至 2030 年)按組件(解決方案/服務)、部署模式(本地/雲端)、組織規模(企業/中型/小型企業)、行業垂直和地區分類
 2025-2029年全球人工智慧碳足跡管理市場
 碳足跡管理市場 - 全球及區域分析:按組件、部署模型、垂直和地理 - 分析與預測(2025-2034)
 碳足跡管理市場分析與預測(至 2034 年):類型、產品、服務、技術、組件、應用、流程、最終用戶、解決方案、部署
 碳足跡管理市場規模、佔有率、趨勢分析報告:按部署、類型、最終用途、地區、細分市場預測,2025-2030 年2025年碳足跡檢驗全球市場報告