


 |
市場調查報告書
商品編碼
1790690
全球碳足跡管理市場(至 2030 年)按組件(解決方案/服務)、部署模式(本地/雲端)、組織規模(企業/中型/小型企業)、行業垂直和地區分類Carbon Footprint Management Market by Component (Solutions, Services), Deployment Mode (On-premises, Cloud), Organization Size (Corporate Enterprises, Mid-Tier Enterprises, Small Businesses), Vertical, and Region - Global Forecast to 2030 |
||||||
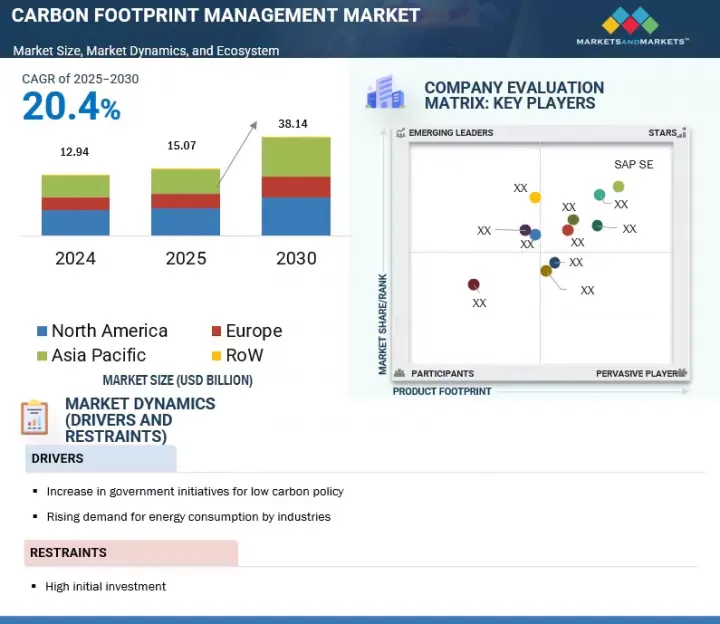
預計碳足跡管理市場將從 2025 年的 150.7 億美元成長到 2030 年的 381.4 億美元,預測期內的複合年成長率為 20.4%。
政府措施減少碳排放的舉措不斷增加、工業能源消費量不斷增加以及企業對永續性報告的日益重視是推動碳足跡管理市場的主要因素。
| 調查範圍 | |
|---|---|
| 調查年份 | 2021-2030 |
| 基準年 | 2024 |
| 預測期 | 2025-2030 |
| 對價單位 | 金額(美元) |
| 按部門 | 按組件、部署模式、組織規模、行業和地區 |
| 目標區域 | 亞太地區、北美、歐洲、中東和非洲、南美 |
世界各國政府正在實施嚴格的環境法規,鼓勵各行各業採用碳監測解決方案。同時,各行各業日益成長的能源需求也迫使企業提高能源利用效率並減少排放。此外,企業越來越重視環境、社會和管治(ESG) 合規性,這進一步加速了碳足跡管理解決方案的採用。
根據行業垂直度,預計製造業在預測期內將實現最高的複合年成長率。
這是由於政府和業界推出了各種法規來支持綠色和永續的經濟活動。許多國家、地區和地方政府都推出了碳排放稅和能源稅等相關措施,以減少溫室氣體排放。截至2024年,全球整體已實施或計畫實施的碳定價舉措(碳排放稅)超過65項,約佔全球排放的22%。此外,許多國家正在對其商業和工業部門徵收嚴格的稅收和法規,以鼓勵它們減少碳足跡,從而支持製造業的成長。
根據部署情況,預計雲端技術部門將在 2030 年佔據最大的市場佔有率。
雲端運算需求的快速成長是碳足跡管理的主要驅動力,其驅動力源自於能源最佳化、先進的冷卻技術、伺服器虛擬以及主要供應商對可再生能源的日益依賴等因素。這種轉變使企業在擴展數位化業務的同時,能夠大幅減少碳足跡。雲端運算的採用帶來了許多優勢,包括更高的IT安全、全天候支援、擴充性和更快的業務速度。這些優勢使得雲端基礎的解決方案對各行各業都極具吸引力。此外,根據需求靈活地擴展或縮減資源,可以最佳化成本並提高效率。
按地區分類,預計北美將在預測期內佔據市場主導地位。
北美引領碳足跡管理市場,預計在預測期內仍將維持強勁地位。這一領先地位歸功於該地區積極應對氣候變遷的立場,包括更嚴格的環境法規、企業永續發展計畫以及對綠色技術的投資。此外,快速的經濟變化和公眾對碳排放上升的認知不斷提高,也推動了對有效碳管理解決方案的需求。隨著越來越多的公司和政府將氣候行動放在首位,預計該地區將繼續成長,支持向永續、低碳未來的轉型。
本報告調查了全球碳足跡管理市場,並提供了市場概況、影響市場成長的各種因素分析、技術和專利趨勢、法律制度、案例研究、市場規模趨勢和預測、各個細分市場、地區/主要國家的詳細分析、競爭格局和主要企業的概況。
目錄
第1章 引言
第2章調查方法
第3章執行摘要
第4章重要考察
第5章市場概述
- 市場動態
- 驅動程式
- 抑制因素
- 機會
- 任務
- 價值鏈分析
- 生態系統
- 案例研究分析
- 技術分析
- 定價分析
- 2025-2026年重要會議和活動
- 監管機構、政府機構和其他組織
- 碳足跡管理法規
- 碳足跡管理標準
- 專利分析
- 波特五力分析
- 主要相關利益者和採購標準
- 採購標準
- 產生人工智慧/人工智慧對碳足跡管理市場的影響
- 全球宏觀經濟展望
- 2025年美國關稅的影響—概述
6. 碳足跡管理市場(依組織規模)
- 主要企業
- 中型公司
- 小型企業
7. 碳足跡管理市場(依產業垂直分類)
- 製造業
- 食品/飲料
- 金屬和採礦
- 化學/材料
- 電子設備/消費品
- 車
- 製藥和醫療保健
- 其他
- 能源公用事業
- 住宅及商業建築
- 運輸/物流
- 資訊科技/通訊
- 金融服務
- 政府
8. 碳足跡管理市場(按組件)
- 解決方案
- 服務
- 諮詢
- 整合和部署
- 支援和維護
9. 碳足跡管理市場(依部署模式)
- 雲
- 本地
第10章 碳足跡管理市場(按地區)
- 北美洲
- 歐洲
- 亞太地區
- 中東和非洲
- 南美洲
第11章競爭格局
- 主要企業招募策略
- 前五大公司市場佔有率分析
- 前五大公司收益分析
- 品牌/產品比較
- 估值和財務指標
- 公司評估矩陣:主要企業
- Start-Ups/小型企業估值象限
- 競爭場景
第12章:公司簡介
- 主要企業
- SAP SE
- SALESFORCE, INC.
- ENGIE
- SCHNEIDER ELECTRIC
- IBM
- CARBON FOOTPRINT LTD.
- ISOMETRIX
- INTELEX
- TRINITY CONSULTANTS, INC.
- DAKOTA SOFTWARE CORPORATION
- ENABLON
- ENVIROSOFT
- ENVIANCE
- ACCUVIO
- ESP
- 其他公司
- PROCESSMAP
- NATIVE
- ENERGYCAP, LLC.
- LOCUS TECHNOLOGIES
- ECOTRACK
- CARBON TRUST
第13章 附錄
The carbon footprint management market is estimated to be valued at USD 15.07 billion in 2025 and USD 38.14 billion by 2030, recording a CAGR of 20.4% during the forecast period. Increasing government initiatives to reduce carbon emissions, rising industrial energy consumption, and growing corporate emphasis on sustainability reporting are key factors driving the carbon footprint management market.
| Scope of the Report | |
|---|---|
| Years Considered for the Study | 2021-2030 |
| Base Year | 2024 |
| Forecast Period | 2025-2030 |
| Units Considered | Value (USD Million/USD Billion) |
| Segments | By Component, By Deployment Mode, By Organization Size, By Vertical, and Region |
| Regions covered | Asia Pacific, North America, Europe, the Middle East & Africa, and South America |
Governments worldwide implement strict environmental rules, prompting industries to adopt carbon monitoring solutions. Meanwhile, higher energy demands across different sectors force organizations to improve their usage and reduce emissions. Additionally, businesses are putting more emphasis on environmental, social, and governance (ESG) compliance, further accelerating the adoption of carbon footprint management solutions.
"By vertical, the manufacturing segment is expected to record the highest CAGR in the carbon footprint management market during the forecast period."
The manufacturing industry, by vertical, is expected to grow at the highest CAGR from 2025 to 2030, owing to various government and industry regulations to support green and sustainable economic activities. Several national, regional, and local governments have enacted carbon taxes and related measures, such as energy taxes, to reduce greenhouse gas emissions. As of 2024, over 65 carbon pricing initiatives-carbon taxes-are in place or scheduled globally, covering about 22% of world emissions. Additionally, to reduce their carbon footprint, many nations impose strict tax rules and regulations on their business and industrial sectors, contributing to the segmental growth.
"Based on deployment mode, the cloud technology segment is projected to hold the largest market share in 2030."
The cloud technology segment is expected to hold the largest share of the carbon footprint management market in 2030. The surge in cloud computing demand is a major boon for carbon footprint management, due to optimized energy use, advanced cooling, server virtualization, and increasing reliance on renewable energy by major providers. This shift enables companies to significantly cut their carbon footprint as they scale digital operations. Cloud deployment offers numerous benefits, including enhanced IT security, around-the-clock support, greater scalability, and increased operational speed. These advantages make cloud-based solutions highly attractive to organizations across various sectors. It provides flexibility by allowing businesses to scale their resources up or down based on demand, which optimizes costs and improves efficiency.
"North America is expected to dominate the carbon footprint management market between 2025 and 2030."
North America led the carbon footprint management market and is expected to maintain its strong position during the forecast period. This leadership stems from the region's proactive approach to tackling climate change through stricter environmental regulations, corporate sustainability initiatives, and investments in green technologies. Additionally, rapid economic shifts and a growing public awareness of the increasing carbon emissions augment the demand for effective carbon management solutions. As more businesses and governments prioritize climate action, the region is likely to see continued growth in this sector, supporting its transition toward a more sustainable and low-carbon future.
In-depth interviews have been conducted with various key industry participants, subject-matter experts, C-level executives of key market players, and industry consultants, among other experts, to obtain and verify critical qualitative and quantitative information and to assess future market prospects. The distribution of primary interviews is as follows:
By Company Type: Tier 1 - 40%, Tier 2 - 35%, and Tier 3 - 25%
By Designation: C-Level - 35%, Directors - 25%, and Others - 40%
By Region: Asia Pacific - 60%, North America - 10%, Europe - 15%, and RoW - 15%
Others include sales managers, engineers, and regional managers.
Note: Tier 1 Company-Revenue > USD 5 billion, Tier 2 Company-Revenue between USD 50 million and USD 5 billion, and Tier 3 Company-Revenue < USD 50 million
The global carbon footprint management market is dominated by a few major players with an extensive regional presence and many local players. Players in the carbon footprint management market include SAP SE (Germany), Salesforce, Inc. (US), ENGIE (France), Schneider Electric (France), IBM (US), Carbon Footprint Ltd. (UK), IsoMetrix (Australia), Intelex Technologies (Canada), Trinity Consultants, Inc. (US), Dakota Software Corporation (US), Enablon (France), Envirosift (UK), Enviance (US), Accuvio (Ireland), ESP (UK), Ideagen (UK), Native (US), EnergyCAP, LLC. (US), Locus Technologies (US), EcoTrack (US), and The Carbon Trust (UK).
Research Coverage:
The report defines, describes, and forecasts the carbon footprint management market by component, deployment mode, organization size, vertical, and region. It also offers a detailed qualitative and quantitative analysis of the market. The report provides a comprehensive review of the major market drivers, restraints, opportunities, and challenges. It also covers various important aspects of the market, including the analysis of the competitive landscape, market dynamics, market estimates in terms of value and volume, and future trends in the carbon footprint management market.
Key Benefits of Buying the Report
- Analysis of key drivers (Increasing government initiatives to reduce carbon emissions, Rising demand for energy consumption by industries, COP27 implementation to limit global warming), restraints (High upfront costs), opportunities (shift toward cloud computing and paperless economy), and challenges (comprehensive measuring, monitoring, and reporting scope) influencing the growth of the carbon footprint management market.
- Product Development/Innovation: Product development and innovation in the carbon footprint management market increasingly rely on AI-powered analytics, IoT-enabled real-time monitoring, and blockchain for transparent carbon tracking. Companies launch platforms that automate emissions measurement, improve predictive capabilities, and connect with ESG frameworks. This allows for more precise, scalable, and practical industry carbon reduction strategies.
- Market Development: Google Cloud and SAP announced the expansion of their relationship, unveiling new integrations between Google Workspace and SAP's flagship cloud ERP, SAP S/4HANA Cloud. These native integrations are expected to enable customers to connect core SAP software designed for running all mission-critical processes in the cloud with the collaborative capabilities of Google Docs and Google Sheets to innovate how work gets done across the enterprise.
- Market Diversification: SAP entered an agreement to acquire Signavio, a leader in enterprise business process intelligence and process management. This acquisition aimed to help companies rapidly understand, improve, transform, and manage their business processes at scale and was integrated into SAP's Business Process Intelligence portfolio. Signavio's solutions can support risk management and compliance efforts and provide greater visibility into third-party-related processes.
- Competitive Assessment: In-depth assessment of market shares, growth strategies, and service offerings of leading players, such as SAP SE (Germany), Salesforce, Inc. (US), ENGIE (France), Schneider Electric (France), IBM (US), and Carbon Footprint Ltd. (UK), is conducted.
TABLE OF CONTENTS
1 INTRODUCTION
- 1.1 STUDY OBJECTIVES
- 1.2 MARKET DEFINITION
- 1.3 STUDY SCOPE
- 1.3.1 MARKETS SEGMENTATION AND REGIONAL SCOPE
- 1.3.2 INCLUSIONS AND EXCLUSIONS
- 1.3.3 YEARS CONSIDERED
- 1.4 CURRENCY CONSIDERED
- 1.5 LIMITATIONS
- 1.6 STAKEHOLDERS
- 1.7 SUMMARY OF CHANGES
2 RESEARCH METHODOLOGY
- 2.1 RESEARCH DATA
- 2.2 MARKET BREAKDOWN AND DATA TRIANGULATION
- 2.2.1 SECONDARY DATA
- 2.2.1.1 Key data from secondary sources
- 2.2.2 PRIMARY DATA
- 2.2.2.1 Breakdown of primaries
- 2.2.2.2 Key data from primary sources
- 2.2.1 SECONDARY DATA
- 2.3 MARKET SIZE ESTIMATION
- 2.3.1 BOTTOM-UP APPROACH
- 2.3.2 TOP-DOWN APPROACH
- 2.3.3 DEMAND-SIDE ANALYSIS
- 2.3.3.1 Regional analysis
- 2.3.3.2 Country analysis
- 2.3.3.3 Demand-side assumptions
- 2.3.3.4 Demand-side calculations
- 2.3.4 SUPPLY-SIDE ANALYSIS
- 2.3.4.1 Supply-side calculations
- 2.3.4.2 Supply-side assumptions
- 2.3.5 FORECAST
3 EXECUTIVE SUMMARY
4 PREMIUM INSIGHTS
- 4.1 ATTRACTIVE OPPORTUNITIES FOR KEY PLAYERS IN CARBON FOOTPRINT MANAGEMENT MARKET
- 4.2 CARBON FOOTPRINT MANAGEMENT MARKET, BY REGION
- 4.3 NORTH AMERICA: CARBON FOOTPRINT MANAGEMENT MARKET, BY DEPLOYMENT MODE AND COUNTRY, 2024
- 4.4 CARBON FOOTPRINT MANAGEMENT MARKET, BY COMPONENT
- 4.5 CARBON FOOTPRINT MANAGEMENT MARKET, BY SERVICE
- 4.6 CARBON FOOTPRINT MANAGEMENT MARKET, BY DEPLOYMENT MODE
- 4.7 CARBON FOOTPRINT MANAGEMENT MARKET, BY ORGANIZATION SIZE
- 4.8 CARBON FOOTPRINT MANAGEMENT MARKET, BY VERTICAL
- 4.9 CARBON FOOTPRINT MANAGEMENT MARKET, BY MANUFACTURING INDUSTRY
5 MARKET OVERVIEW
- 5.1 INTRODUCTION
- 5.2 MARKET DYNAMICS
- 5.2.1 DRIVERS
- 5.2.1.1 Increasing government initiatives to reduce carbon emissions
- 5.2.1.2 Rising demand for energy consumption by industries
- 5.2.1.3 COP27 implementation to limit global warming
- 5.2.2 RESTRAINTS
- 5.2.2.1 High initial investment
- 5.2.3 OPPORTUNITIES
- 5.2.3.1 Shift toward cloud computing and paperless economy
- 5.2.4 CHALLENGES
- 5.2.4.1 Challenges in comprehensively measuring, monitoring, and reporting Scope 3 emissions
- 5.2.1 DRIVERS
- 5.3 VALUE CHAIN ANALYSIS
- 5.3.1 CARBON FOOTPRINT MANAGEMENT SOFTWARE VENDORS
- 5.3.2 SYSTEM INTEGRATORS AND SERVICE PROVIDERS
- 5.3.3 END USERS
- 5.3.4 POST-SALE SERVICES
- 5.4 ECOSYSTEM
- 5.5 CASE STUDY ANALYSIS
- 5.5.1 SASFIN BANK LTD USES ISOMETRIX SOFTWARE TO MITIGATE RISK
- 5.5.2 BEN & JERRY'S OFFSET PROVIDES SEED FUNDING FOR MORE SUSTAINABLE AGRICULTURE
- 5.6 TECHNOLOGY ANALYSIS
- 5.6.1 BLOCKCHAIN-BASED CARBON FOOTPRINT MANAGEMENT DEVELOPMENT
- 5.7 PRICING ANALYSIS
- 5.7.1 AVERAGE SELLING PRICE OF CARBON FOOTPRINT SOFTWARE SUBSCRIPTIONS, BY COMPANY
- 5.8 KEY CONFERENCES & EVENTS, 2025-2026
- 5.9 REGULATORY BODIES, GOVERNMENT AGENCIES, AND OTHER ORGANIZATIONS
- 5.10 REGULATIONS RELATED TO CARBON FOOTPRINT MANAGEMENT
- 5.11 STANDARDS RELATED TO CARBON FOOTPRINT MANAGEMENT
- 5.12 PATENT ANALYSIS
- 5.13 PORTER'S FIVE FORCES ANALYSIS
- 5.13.1 THREAT OF SUBSTITUTES
- 5.13.2 BARGAINING POWER OF SUPPLIERS
- 5.13.3 BARGAINING POWER OF BUYERS
- 5.13.4 THREAT OF NEW ENTRANTS
- 5.13.5 INTENSITY OF COMPETITIVE RIVALRY
- 5.14 KEY STAKEHOLDERS AND BUYING CRITERIA
- 5.14.1 KEY STAKEHOLDERS IN BUYING PROCESS
- 5.15 BUYING CRITERIA
- 5.16 IMPACT OF GEN AI/AI ON CARBON FOOTPRINT MANAGEMENT MARKET
- 5.16.1 ADOPTION OF GEN AI/AI IN CARBON FOOTPRINT MANAGEMENT MARKET
- 5.16.2 IMPACT OF GEN AI/AI, BY VERTICAL
- 5.16.3 IMPACT OF GEN AI/AI ON CARBON FOOTPRINT MANAGEMENT MARKET, BY REGION
- 5.17 GLOBAL MACROECONOMIC OUTLOOK
- 5.17.1 INTRODUCTION
- 5.17.2 GDP TRENDS AND FORECAST
- 5.17.3 IMPACT OF INFLATION ON CARBON FOOTPRINT MANAGEMENT MARKET
- 5.18 IMPACT OF 2025 US TARIFF - OVERVIEW
- 5.18.1 INTRODUCTION
- 5.18.2 KEY TARIFF RATES
- 5.18.3 IMPACT ON REGION
6 CARBON FOOTPRINT MANAGEMENT MARKET, BY ORGANIZATION SIZE
- 6.1 INTRODUCTION
- 6.2 CORPORATES/ENTERPRISES
- 6.2.1 RISING PRESSURE TO ADOPT SUSTAINABLE SOLUTIONS TO DRIVE MARKET
- 6.3 MID-TIER ENTERPRISES
- 6.3.1 STAKEHOLDER SUPPORT TO GOVERN ADOPTION TO BOOST MARKET
- 6.4 SMALL BUSINESSES
- 6.4.1 LACK OF AWARENESS AMONG SMALL BUSINESSES TO LIMIT GROWTH
7 CARBON FOOTPRINT MANAGEMENT MARKET, BY VERTICAL
- 7.1 INTRODUCTION
- 7.2 MANUFACTURING
- 7.2.1 RISKS RELATED TO NON-COMPLIANCE TO INCREASE IMPLEMENTATION
- 7.2.2 FOOD & BEVERAGES
- 7.2.2.1 Elimination of waste and inefficiency in production, distribution, and consumption - key drivers
- 7.2.3 METALS & MINING
- 7.2.3.1 Significant role in reducing global carbon footprint to drive segment
- 7.2.4 CHEMICAL & MATERIALS
- 7.2.4.1 Importance of Scope 3 emission reporting to fuel adoption
- 7.2.5 ELECTRONICS & CONSUMER GOODS
- 7.2.5.1 Solutions to help set near-term and long-term carbon emission targets
- 7.2.6 AUTOMOTIVE
- 7.2.6.1 Rising demand due to pressure from investors and government
- 7.2.7 PHARMACEUTICAL & HEALTHCARE
- 7.2.7.1 Automation to increase adoption
- 7.2.8 OTHERS
- 7.3 ENERGY & UTILITIES
- 7.3.1 RISING DEMAND FOR ENERGY TO LEAD TO INCREASING EMISSIONS
- 7.4 RESIDENTIAL & COMMERCIAL BUILDINGS
- 7.4.1 BENEFITS OF SIMULATION IN BUILDING ENERGY EFFICIENCY TO DRIVE MARKET
- 7.5 TRANSPORTATION & LOGISTICS
- 7.5.1 IMPROVED EFFICIENCY AND REDUCED COMPLEXITY TO DRIVE DEMAND
- 7.6 IT & TELECOM
- 7.6.1 SHIFT TO GREEN INFRASTRUCTURE AND SUPPLY CHAIN DECARBONIZATION TO DRIVE MARKET
- 7.7 FINANCIAL SERVICES
- 7.7.1 HIGH EMPHASIS ON LOWERING CARBON EMISSIONS TO BOOST MARKET
- 7.8 GOVERNMENT
- 7.8.1 HIGHER CONTRIBUTION TOWARD CARBON REDUCTION OBJECTIVES
8 CARBON FOOTPRINT MANAGEMENT MARKET, BY COMPONENT
- 8.1 INTRODUCTION
- 8.2 SOLUTIONS
- 8.2.1 INCREASING FOCUS ON EMISSION REDUCTION PLANS TO FUEL SEGMENT
- 8.3 SERVICES
- 8.3.1 NEED FOR HIGH EXPERTISE AND KNOWLEDGE ABOUT CARBON FOOTPRINT MANAGEMENT
- 8.3.2 CONSULTING
- 8.3.3 INTEGRATION & DEPLOYMENT
- 8.3.4 SUPPORT & MAINTENANCE
9 CARBON FOOTPRINT MANAGEMENT MARKET, BY DEPLOYMENT MODE
- 9.1 INTRODUCTION
- 9.2 CLOUD
- 9.2.1 EASE OF EXECUTION AND INCREASED DATA SECURITY
- 9.3 ON-PREMISES
- 9.3.1 LOWER ADOPTION RATES DUE TO INCREASING AUTOMATION
10 CARBON FOOTPRINT MANAGEMENT MARKET, BY REGION
- 10.1 INTRODUCTION
- 10.2 NORTH AMERICA
- 10.2.1 BY COMPONENT
- 10.2.2 BY SERVICE
- 10.2.3 BY DEPLOYMENT MODE
- 10.2.4 BY ORGANIZATION SIZE
- 10.2.5 BY VERTICAL
- 10.2.6 BY MANUFACTURING INDUSTRY
- 10.2.7 BY COUNTRY
- 10.2.7.1 US
- 10.2.7.1.1 Regulations on ESG disclosure and NDC targets to drive market
- 10.2.7.2 Canada
- 10.2.7.2.1 Sector-wise emission reduction strategy to boost demand
- 10.2.7.3 Mexico
- 10.2.7.3.1 Move toward energy-efficient and low-carbon footprint sustainable buildings and cities to boost market
- 10.2.7.1 US
- 10.3 EUROPE
- 10.3.1 BY COMPONENT
- 10.3.2 BY SERVICE
- 10.3.3 BY DEPLOYMENT MODE
- 10.3.4 BY ORGANIZATION SIZE
- 10.3.5 BY VERTICAL
- 10.3.6 BY MANUFACTURING INDUSTRY
- 10.3.7 BY COUNTRY
- 10.3.7.1 Germany
- 10.3.7.1.1 Federal carbon and GHG neutrality act to boost deployment
- 10.3.7.2 France
- 10.3.7.2.1 Initiatives to support decarbonization of emission-intensive sectors to boost market
- 10.3.7.3 UK
- 10.3.7.3.1 Focus on reducing emissions from power, transport, and building sectors to propel market
- 10.3.7.4 Rest of Europe
- 10.3.7.1 Germany
- 10.4 ASIA PACIFIC
- 10.4.1 BY COMPONENT
- 10.4.2 BY SERVICES
- 10.4.3 BY DEPLOYMENT MODE
- 10.4.4 BY ORGANIZATION SIZE
- 10.4.5 BY VERTICAL
- 10.4.6 BY MANUFACTURING INDUSTRY
- 10.4.7 BY COUNTRY
- 10.4.7.1 China
- 10.4.7.1.1 High returns associated with development and production of low-carbon technologies to drive market
- 10.4.7.2 India
- 10.4.7.2.1 Goals to reduce carbon emissions by 1 billion tons by 2030 to fuel market growth
- 10.4.7.3 Japan
- 10.4.7.3.1 Active participation by companies to achieve carbon neutrality goals to propel market
- 10.4.7.4 Singapore
- 10.4.7.4.1 Active participation in multinational emission control efforts to drive market
- 10.4.7.5 Australia
- 10.4.7.5.1 National framework on greenhouse gases and energy reporting to boost market growth
- 10.4.7.6 Rest of Asia Pacific
- 10.4.7.1 China
- 10.5 MIDDLE EAST & AFRICA
- 10.5.1 BY COMPONENT
- 10.5.2 BY SERVICE
- 10.5.3 BY DEPLOYMENT MODE
- 10.5.4 BY ORGANIZATION SIZE
- 10.5.5 BY VERTICAL
- 10.5.6 BY MANUFACTURING INDUSTRY
- 10.5.7 BY COUNTRY
- 10.5.7.1 Saudi Arabia
- 10.5.7.1.1 Launch of government initiatives to tackle emissions to propel market
- 10.5.7.2 UAE
- 10.5.7.2.1 Initiatives to improve quality of environment to boost market growth
- 10.5.7.3 Rest of Middle East & Africa
- 10.5.7.1 Saudi Arabia
- 10.6 SOUTH AMERICA
- 10.6.1 BY COMPONENT
- 10.6.2 BY SERVICE
- 10.6.3 BY DEPLOYMENT MODE
- 10.6.4 BY ORGANIZATION SIZE
- 10.6.5 BY VERTICAL
- 10.6.6 BY MANUFACTURING INDUSTRY
- 10.6.7 BY COUNTRY
- 10.6.7.1 Brazil
- 10.6.7.1.1 Focus on CO2 emission reduction to meet climate neutrality goals to drive demand
- 10.6.7.2 Rest of South America
- 10.6.7.1 Brazil
11 COMPETITIVE LANDSCAPE
- 11.1 STRATEGIES ADOPTED BY KEY PLAYERS
- 11.2 MARKET SHARE ANALYSIS OF TOP FIVE PLAYERS
- 11.3 REVENUE ANALYSIS OF TOP FIVE PLAYERS
- 11.4 BRAND/PRODUCT COMPARISON
- 11.5 COMPANY VALUATION AND FINANCIAL METRICS
- 11.6 COMPANY EVALUATION MATRIX: KEY PLAYERS, 2024
- 11.6.1 STARS
- 11.6.2 PERVASIVE PLAYERS
- 11.6.3 EMERGING LEADERS
- 11.6.4 PARTICIPANTS
- 11.6.5 COMPANY FOOTPRINT: KEY PLAYERS, 2024
- 11.6.5.1 Company footprint
- 11.6.5.2 Region footprint
- 11.6.5.3 Component footprint
- 11.6.5.4 Deployment mode footprint
- 11.6.5.5 Vertical footprint
- 11.7 STARTUP/SME EVALUATION QUADRANT, 2024
- 11.7.1 PROGRESSIVE COMPANIES
- 11.7.2 RESPONSIVE COMPANIES
- 11.7.3 DYNAMIC COMPANIES
- 11.7.4 STARTING BLOCKS
- 11.7.5 COMPETITIVE BENCHMARKING: STARTUPS/SMES, 2024
- 11.7.5.1 Detailed list of key startups/SMEs
- 11.7.5.2 Competitive benchmarking of key startups/SMEs
- 11.8 COMPETITIVE SCENARIO
- 11.8.1 PRODUCT LAUNCHES
- 11.8.2 DEALS
- 11.8.3 EXPANSIONS
12 COMPANY PROFILES
- 12.1 KEY PLAYERS
- 12.1.1 SAP SE
- 12.1.1.1 Business overview
- 12.1.1.2 Products/Solutions/Services offered
- 12.1.1.3 Recent developments
- 12.1.1.3.1 Deals
- 12.1.1.4 MnM view
- 12.1.1.4.1 Right to win
- 12.1.1.4.2 Strategic choices
- 12.1.1.4.3 Weaknesses and competitive threats
- 12.1.2 SALESFORCE, INC.
- 12.1.2.1 Business overview
- 12.1.2.2 Products/Solutions/Services offered
- 12.1.2.3 MnM view
- 12.1.2.3.1 Right to win
- 12.1.2.3.2 Strategic choices
- 12.1.2.3.3 Weaknesses and competitive threats
- 12.1.3 ENGIE
- 12.1.3.1 Business overview
- 12.1.3.2 Products/Solutions/Services offered
- 12.1.3.3 MnM view
- 12.1.3.3.1 Right to win
- 12.1.3.3.2 Strategic choices
- 12.1.3.3.3 Weaknesses and competitive threats
- 12.1.4 SCHNEIDER ELECTRIC
- 12.1.4.1 Business overview
- 12.1.4.2 Products/Solutions/Services offered
- 12.1.4.3 Recent developments
- 12.1.4.3.1 Deals
- 12.1.4.4 MnM view
- 12.1.4.4.1 Right to win
- 12.1.4.4.2 Strategic choices
- 12.1.4.4.3 Weaknesses and competitive threats
- 12.1.5 IBM
- 12.1.5.1 Business overview
- 12.1.5.2 Products/Solutions/Services offered
- 12.1.5.3 Recent developments
- 12.1.5.3.1 Product launches
- 12.1.5.4 MnM view
- 12.1.5.4.1 Right to win
- 12.1.5.4.2 Strategic choices
- 12.1.5.4.3 Weaknesses and competitive threats
- 12.1.6 CARBON FOOTPRINT LTD.
- 12.1.6.1 Business overview
- 12.1.6.2 Products/Solutions/Services offered
- 12.1.7 ISOMETRIX
- 12.1.7.1 Business overview
- 12.1.7.2 Products/Solutions/Services offered
- 12.1.7.3 Recent developments
- 12.1.7.3.1 Product launches
- 12.1.7.3.2 Deals
- 12.1.8 INTELEX
- 12.1.8.1 Business overview
- 12.1.8.2 Products/Solutions/Services offered
- 12.1.8.3 Recent developments
- 12.1.8.3.1 Deals
- 12.1.8.3.2 Expansions
- 12.1.9 TRINITY CONSULTANTS, INC.
- 12.1.9.1 Business overview
- 12.1.9.2 Products/Solutions/Services offered
- 12.1.9.3 Recent developments
- 12.1.9.3.1 Deals
- 12.1.10 DAKOTA SOFTWARE CORPORATION
- 12.1.10.1 Business overview
- 12.1.10.2 Products/Solutions/Services offered
- 12.1.10.3 Recent developments
- 12.1.10.3.1 Deals
- 12.1.11 ENABLON
- 12.1.11.1 Business overview
- 12.1.11.2 Products/Solutions/Services offered
- 12.1.11.3 Recent developments
- 12.1.11.3.1 Deals
- 12.1.12 ENVIROSOFT
- 12.1.12.1 Business overview
- 12.1.12.2 Products/Solutions/Services offered
- 12.1.13 ENVIANCE
- 12.1.13.1 Business overview
- 12.1.13.2 Products/Solutions/Services offered
- 12.1.13.3 Recent developments
- 12.1.13.3.1 Product launches
- 12.1.13.3.2 Deals
- 12.1.14 ACCUVIO
- 12.1.14.1 Business overview
- 12.1.14.2 Products/Solutions/Services offered
- 12.1.14.3 Recent developments
- 12.1.14.3.1 Deals
- 12.1.15 ESP
- 12.1.15.1 Business overview
- 12.1.15.2 Products/Solutions/Services offered
- 12.1.1 SAP SE
- 12.2 OTHER PLAYERS
- 12.2.1 PROCESSMAP
- 12.2.2 NATIVE
- 12.2.3 ENERGYCAP, LLC.
- 12.2.4 LOCUS TECHNOLOGIES
- 12.2.5 ECOTRACK
- 12.2.6 CARBON TRUST
13 APPENDIX
- 13.1 INSIGHTS FROM INDUSTRY EXPERTS
- 13.2 DISCUSSION GUIDE
- 13.3 KNOWLEDGESTORE: MARKETSANDMARKETS' SUBSCRIPTION PORTAL
- 13.4 CUSTOMIZATION OPTIONS
- 13.5 RELATED REPORTS
- 13.6 AUTHOR DETAILS
List of Tables
- TABLE 1 CARBON FOOTPRINT MANAGEMENT MARKET, BY COMPONENT
- TABLE 2 CARBON FOOTPRINT MANAGEMENT MARKET, BY DEPLOYMENT MODE
- TABLE 3 CARBON FOOTPRINT MANAGEMENT MARKET, BY ORGANIZATION SIZE
- TABLE 4 CARBON FOOTPRINT MANAGEMENT MARKET, BY VERTICAL
- TABLE 5 CARBON FOOTPRINT MANAGEMENT MARKET, BY REGION
- TABLE 6 CARBON FOOTPRINT MANAGEMENT MARKET SNAPSHOT
- TABLE 7 ROLE OF CARBON FOOTPRINT MANAGEMENT IN ECOSYSTEM
- TABLE 8 AVERAGE SELLING PRICES OF CARBON FOOTPRINT SUBSCRIPTIONS, 2024
- TABLE 9 INDICATIVE SELLING PRICE OF CARBON FOOTPRINT SOFTWARE SUBSCRIPTIONS, 2024
- TABLE 10 CARBON FOOTPRINT MANAGEMENT MARKET: CONFERENCES & EVENTS, 2025-2026
- TABLE 11 NORTH AMERICA: REGULATORY BODIES, GOVERNMENT AGENCIES, AND OTHER ORGANIZATIONS
- TABLE 12 EUROPE: REGULATORY BODIES, GOVERNMENT AGENCIES, AND OTHER ORGANIZATIONS
- TABLE 13 ASIA PACIFIC: REGULATORY BODIES, GOVERNMENT AGENCIES, AND OTHER ORGANIZATIONS
- TABLE 14 REST OF THE WORLD: REGULATORY BODIES, GOVERNMENT AGENCIES, AND OTHER ORGANIZATIONS
- TABLE 15 REGULATIONS FOR CARBON FOOTPRINT MANAGEMENT
- TABLE 16 STANDARDS FOR CARBON FOOTPRINT MANAGEMENT
- TABLE 17 CARBON FOOTPRINT MANAGEMENT MARKET: KEY PATENTS
- TABLE 18 PORTER'S FIVE FORCES ANALYSIS
- TABLE 19 INFLUENCE OF KEY STAKEHOLDERS ON BUYING PROCESS FOR TOP THREE VERTICALS
- TABLE 20 KEY BUYING CRITERIA FOR TOP THREE VERTICALS
- TABLE 21 WORLD GDP GROWTH, 2021-2028 (USD TRILLION)
- TABLE 22 INFLATION RATE (ANNUAL PERCENT CHANGE), 2024
- TABLE 23 US-ADJUSTED RECIPROCAL TARIFF RATES, 2024 (USD BILLION)
- TABLE 24 CARBON FOOTPRINT MANAGEMENT MARKET, BY ORGANIZATION SIZE, 2021-2024 (USD MILLION)
- TABLE 25 CARBON FOOTPRINT MANAGEMENT MARKET, BY ORGANIZATION SIZE, 2025-2030 (USD MILLION)
- TABLE 26 CORPORATES/ENTERPRISES: CARBON FOOTPRINT MANAGEMENT MARKET, BY REGION, 2021-2024 (USD MILLION)
- TABLE 27 CORPORATES/ENTERPRISES: CARBON FOOTPRINT MANAGEMENT MARKET, BY REGION, 2025-2030 (USD MILLION)
- TABLE 28 MID-TIER ENTERPRISES: CARBON FOOTPRINT MANAGEMENT MARKET, BY REGION, 2021-2024 (USD MILLION)
- TABLE 29 MID-TIER ENTERPRISES: CARBON FOOTPRINT MANAGEMENT MARKET, BY REGION, 2025-2030 (USD MILLION)
- TABLE 30 SMALL BUSINESSES: CARBON FOOTPRINT MANAGEMENT MARKET, BY REGION, 2021-2024 (USD MILLION)
- TABLE 31 SMALL BUSINESSES: CARBON FOOTPRINT MANAGEMENT MARKET, BY REGION, 2025-2030 (USD MILLION)
- TABLE 32 CARBON FOOTPRINT MANAGEMENT MARKET, BY VERTICAL, 2021-2024 (USD MILLION)
- TABLE 33 CARBON FOOTPRINT MANAGEMENT MARKET, BY VERTICAL, 2025-2030 (USD MILLION)
- TABLE 34 MANUFACTURING: CARBON FOOTPRINT MANAGEMENT MARKET, BY REGION, 2021-2024 (USD MILLION)
- TABLE 35 MANUFACTURING: CARBON FOOTPRINT MANAGEMENT MARKET, BY REGION, 2025-2030 (USD MILLION)
- TABLE 36 MANUFACTURING: CARBON FOOTPRINT MANAGEMENT MARKET, BY INDUSTRY, 2021-2024 (USD MILLION)
- TABLE 37 MANUFACTURING: CARBON FOOTPRINT MANAGEMENT MARKET, BY INDUSTRY, 2025-2030 (USD MILLION)
- TABLE 38 FOOD & BEVERAGES: CARBON FOOTPRINT MANAGEMENT MARKET, BY REGION, 2021-2024 (USD MILLION)
- TABLE 39 FOOD & BEVERAGES: CARBON FOOTPRINT MANAGEMENT MARKET, BY REGION, 2025-2030 (USD MILLION)
- TABLE 40 METALS & MINING: CARBON FOOTPRINT MANAGEMENT MARKET, BY REGION, 2021-2024 (USD MILLION)
- TABLE 41 METALS & MINING: CARBON FOOTPRINT MANAGEMENT MARKET, BY REGION, 2025-2030 (USD MILLION)
- TABLE 42 CHEMICAL & MATERIALS: CARBON FOOTPRINT MANAGEMENT MARKET, BY REGION, 2021-2024 (USD MILLION)
- TABLE 43 CHEMICAL & MATERIALS: CARBON FOOTPRINT MANAGEMENT MARKET, BY REGION, 2025-2030 (USD MILLION)
- TABLE 44 ELECTRONICS & CONSUMER GOODS: CARBON FOOTPRINT MANAGEMENT MARKET, BY REGION, 2021-2024 (USD MILLION)
- TABLE 45 ELECTRONICS & CONSUMER GOODS: CARBON FOOTPRINT MANAGEMENT MARKET, BY REGION, 2025-2030 (USD MILLION)
- TABLE 46 AUTOMOTIVE: CARBON FOOTPRINT MANAGEMENT MARKET, BY REGION, 2021-2024 (USD MILLION)
- TABLE 47 AUTOMOTIVE: CARBON FOOTPRINT MANAGEMENT MARKET, BY REGION, 2025-2030 (USD MILLION)
- TABLE 48 PHARMACEUTICAL & HEALTHCARE: CARBON FOOTPRINT MANAGEMENT MARKET, BY REGION, 2021-2024 (USD MILLION)
- TABLE 49 PHARMACEUTICAL & HEALTHCARE: CARBON FOOTPRINT MANAGEMENT MARKET, BY REGION, 2025-2030 (USD MILLION)
- TABLE 50 OTHERS: CARBON FOOTPRINT MANAGEMENT MARKET, BY REGION, 2021-2024 (USD MILLION)
- TABLE 51 OTHERS: CARBON FOOTPRINT MANAGEMENT MARKET, BY REGION, 2025-2030 (USD MILLION)
- TABLE 52 ENERGY & UTILITIES: CARBON FOOTPRINT MANAGEMENT MARKET, BY REGION, 2021-2024 (USD MILLION)
- TABLE 53 ENERGY & UTILITIES: CARBON FOOTPRINT MANAGEMENT MARKET, BY REGION, 2025-2030 (USD MILLION)
- TABLE 54 RESIDENTIAL & COMMERCIAL BUILDINGS: CARBON FOOTPRINT MANAGEMENT MARKET, BY REGION, 2021-2024 (USD MILLION)
- TABLE 55 RESIDENTIAL & COMMERCIAL BUILDINGS: CARBON FOOTPRINT MANAGEMENT MARKET, BY REGION, 2025-2030 (USD MILLION)
- TABLE 56 TRANSPORTATION & LOGISTICS: CARBON FOOTPRINT MANAGEMENT MARKET, BY REGION, 2021-2024 (USD MILLION)
- TABLE 57 TRANSPORTATION & LOGISTICS: CARBON FOOTPRINT MANAGEMENT MARKET, BY REGION, 2025-2030 (USD MILLION)
- TABLE 58 IT & TELECOM: CARBON FOOTPRINT MANAGEMENT MARKET, BY REGION, 2021-2024 (USD MILLION)
- TABLE 59 IT & TELECOM: CARBON FOOTPRINT MANAGEMENT MARKET, BY REGION, 2025-2030 (USD MILLION)
- TABLE 60 FINANCIAL SERVICES: CARBON FOOTPRINT MANAGEMENT MARKET, BY REGION, 2021-2024 (USD MILLION)
- TABLE 61 FINANCIAL SERVICES: CARBON FOOTPRINT MANAGEMENT MARKET, BY REGION, 2025-2030 (USD MILLION)
- TABLE 62 GOVERNMENT: CARBON FOOTPRINT MANAGEMENT MARKET, BY REGION, 2021-2024 (USD MILLION)
- TABLE 63 GOVERNMENT: CARBON FOOTPRINT MANAGEMENT MARKET, BY REGION, 2025-2030 (USD MILLION)
- TABLE 64 CARBON FOOTPRINT MANAGEMENT MARKET, BY COMPONENT, 2021-2024 (USD MILLION)
- TABLE 65 CARBON FOOTPRINT MANAGEMENT MARKET, BY COMPONENT, 2025-2030 (USD MILLION)
- TABLE 66 SOLUTIONS: CARBON FOOTPRINT MANAGEMENT MARKET, BY REGION, 2021-2024 (USD MILLION)
- TABLE 67 SOLUTIONS: CARBON FOOTPRINT MANAGEMENT MARKET, BY REGION, 2025-2030 (USD MILLION)
- TABLE 68 SERVICES: CARBON FOOTPRINT MANAGEMENT MARKET, BY REGION, 2021-2024 (USD MILLION)
- TABLE 69 SERVICES: CARBON FOOTPRINT MANAGEMENT MARKET, BY REGION, 2025-2030 (USD MILLION)
- TABLE 70 CARBON FOOTPRINT MANAGEMENT MARKET, BY SERVICE, 2021-2024 (USD MILLION)
- TABLE 71 CARBON FOOTPRINT MANAGEMENT MARKET, BY SERVICE, 2025-2030 (USD MILLION)
- TABLE 72 CONSULTING: CARBON FOOTPRINT MANAGEMENT MARKET, BY REGION, 2021-2024 (USD MILLION)
- TABLE 73 CONSULTING: CARBON FOOTPRINT MANAGEMENT MARKET, BY REGION, 2025-2030 (USD MILLION)
- TABLE 74 INTEGRATION & DEPLOYMENT: CARBON FOOTPRINT MANAGEMENT MARKET, BY REGION, 2021-2024 (USD MILLION)
- TABLE 75 INTEGRATION & DEPLOYMENT: CARBON FOOTPRINT MANAGEMENT MARKET, BY REGION, 2025-2030 (USD MILLION)
- TABLE 76 SUPPORT & MAINTENANCE: CARBON FOOTPRINT MANAGEMENT MARKET, BY REGION, 2021-2024 (USD MILLION)
- TABLE 77 SUPPORT & MAINTENANCE: CARBON FOOTPRINT MANAGEMENT MARKET, BY REGION, 2025-2030 (USD MILLION)
- TABLE 78 CARBON FOOTPRINT MANAGEMENT MARKET, BY DEPLOYMENT MODE, 2021-2024 (USD MILLION)
- TABLE 79 CARBON FOOTPRINT MANAGEMENT MARKET, BY DEPLOYMENT MODE, 2025-2030 (USD MILLION)
- TABLE 80 CLOUD: CARBON FOOTPRINT MANAGEMENT MARKET, BY REGION, 2021-2024 (USD MILLION)
- TABLE 81 CLOUD: CARBON FOOTPRINT MANAGEMENT MARKET, BY REGION, 2025-2030 (USD MILLION)
- TABLE 82 ON-PREMISES: CARBON FOOTPRINT MANAGEMENT MARKET, BY REGION, 2021-2024 (USD MILLION)
- TABLE 83 ON-PREMISES: CARBON FOOTPRINT MANAGEMENT MARKET, BY REGION, 2025-2030 (USD MILLION)
- TABLE 84 CARBON FOOTPRINT MANAGEMENT MARKET, BY REGION, 2021-2024 (USD MILLION)
- TABLE 85 CARBON FOOTPRINT MANAGEMENT MARKET, BY REGION, 2025-2030 (USD MILLION)
- TABLE 86 NORTH AMERICA: CARBON FOOTPRINT MANAGEMENT MARKET, BY COMPONENT, 2021-2024 (USD MILLION)
- TABLE 87 NORTH AMERICA: CARBON FOOTPRINT MANAGEMENT MARKET, BY COMPONENT, 2025-2030 (USD MILLION)
- TABLE 88 NORTH AMERICA: CARBON FOOTPRINT MANAGEMENT MARKET, BY SERVICE, 2021-2024 (USD MILLION)
- TABLE 89 NORTH AMERICA: CARBON FOOTPRINT MANAGEMENT MARKET, BY SERVICE, 2025-2030 (USD MILLION)
- TABLE 90 NORTH AMERICA: CARBON FOOTPRINT MANAGEMENT MARKET, BY DEPLOYMENT MODE, 2021-2024 (USD MILLION)
- TABLE 91 NORTH AMERICA: CARBON FOOTPRINT MANAGEMENT MARKET, BY DEPLOYMENT MODE, 2025-2030 (USD MILLION)
- TABLE 92 NORTH AMERICA: CARBON FOOTPRINT MANAGEMENT MARKET, BY ORGANIZATION SIZE, 2021-2024 (USD MILLION)
- TABLE 93 NORTH AMERICA: CARBON FOOTPRINT MANAGEMENT MARKET, BY ORGANIZATION SIZE, 2025-2030 (USD MILLION)
- TABLE 94 NORTH AMERICA: CARBON FOOTPRINT MANAGEMENT MARKET, BY VERTICAL, 2021-2024 (USD MILLION)
- TABLE 95 NORTH AMERICA: CARBON FOOTPRINT MANAGEMENT MARKET, BY VERTICAL, 2025-2030 (USD MILLION)
- TABLE 96 NORTH AMERICA: CARBON FOOTPRINT MANAGEMENT MARKET, BY MANUFACTURING INDUSTRY, 2021-2024 (USD MILLION)
- TABLE 97 NORTH AMERICA: CARBON FOOTPRINT MANAGEMENT MARKET, BY MANUFACTURING INDUSTRY, 2025-2030 (USD MILLION)
- TABLE 98 NORTH AMERICA: CARBON FOOTPRINT MANAGEMENT MARKET, BY COUNTRY, 2021-2024 (USD MILLION)
- TABLE 99 NORTH AMERICA: CARBON FOOTPRINT MANAGEMENT MARKET, BY COUNTRY, 2025-2030 (USD MILLION)
- TABLE 100 US: CARBON FOOTPRINT MANAGEMENT MARKET, BY COMPONENT, 2021-2024 (USD MILLION)
- TABLE 101 US: CARBON FOOTPRINT MANAGEMENT MARKET, BY COMPONENT, 2025-2030 (USD MILLION)
- TABLE 102 US: CARBON FOOTPRINT MANAGEMENT MARKET, BY SERVICE, 2021-2024 (USD MILLION)
- TABLE 103 US: CARBON FOOTPRINT MANAGEMENT MARKET, BY SERVICE, 2025-2030 (USD MILLION)
- TABLE 104 US: CARBON FOOTPRINT MANAGEMENT MARKET, BY DEPLOYMENT MODE, 2021-2024 (USD MILLION)
- TABLE 105 US: CARBON FOOTPRINT MANAGEMENT MARKET, BY DEPLOYMENT MODE, 2025-2030 (USD MILLION)
- TABLE 106 US: CARBON FOOTPRINT MANAGEMENT MARKET, BY ORGANIZATION SIZE, 2021-2024 (USD MILLION)
- TABLE 107 US: CARBON FOOTPRINT MANAGEMENT MARKET, BY ORGANIZATION SIZE, 2025-2030 (USD MILLION)
- TABLE 108 CANADA: CARBON FOOTPRINT MANAGEMENT MARKET, BY COMPONENT, 2021-2024 (USD MILLION)
- TABLE 109 CANADA: CARBON FOOTPRINT MANAGEMENT MARKET, BY COMPONENT, 2025-2030 (USD MILLION)
- TABLE 110 CANADA: CARBON FOOTPRINT MANAGEMENT MARKET, BY SERVICE, 2021-2024 (USD MILLION)
- TABLE 111 CANADA: CARBON FOOTPRINT MANAGEMENT MARKET, BY SERVICE, 2025-2030 (USD MILLION)
- TABLE 112 CANADA: CARBON FOOTPRINT MANAGEMENT MARKET, BY DEPLOYMENT MODE, 2021-2024 (USD MILLION)
- TABLE 113 CANADA: CARBON FOOTPRINT MANAGEMENT MARKET, BY DEPLOYMENT MODE, 2025-2030 (USD MILLION)
- TABLE 114 CANADA: CARBON FOOTPRINT MANAGEMENT MARKET, BY ORGANIZATION SIZE, 2021-2024 (USD MILLION)
- TABLE 115 CANADA: CARBON FOOTPRINT MANAGEMENT MARKET, BY ORGANIZATION SIZE, 2025-2030 (USD MILLION)
- TABLE 116 MEXICO: CARBON FOOTPRINT MANAGEMENT MARKET, BY COMPONENT, 2021-2024 (USD MILLION)
- TABLE 117 MEXICO: CARBON FOOTPRINT MANAGEMENT MARKET, BY COMPONENT, 2025-2030 (USD MILLION)
- TABLE 118 MEXICO: CARBON FOOTPRINT MANAGEMENT MARKET, BY SERVICE, 2021-2024 (USD MILLION)
- TABLE 119 MEXICO: CARBON FOOTPRINT MANAGEMENT MARKET, BY SERVICE, 2025-2030 (USD MILLION)
- TABLE 120 MEXICO: CARBON FOOTPRINT MANAGEMENT MARKET, BY DEPLOYMENT MODE, 2021-2024 (USD MILLION)
- TABLE 121 MEXICO: CARBON FOOTPRINT MANAGEMENT MARKET, BY DEPLOYMENT MODE, 2025-2030 (USD MILLION)
- TABLE 122 MEXICO: CARBON FOOTPRINT MANAGEMENT MARKET, BY ORGANIZATION SIZE, 2021-2024 (USD MILLION)
- TABLE 123 MEXICO: CARBON FOOTPRINT MANAGEMENT MARKET, BY ORGANIZATION SIZE, 2025-2030 (USD MILLION)
- TABLE 124 EUROPE: CARBON FOOTPRINT MANAGEMENT MARKET, BY COMPONENT, 2021-2024 (USD MILLION)
- TABLE 125 EUROPE: CARBON FOOTPRINT MANAGEMENT MARKET, BY COMPONENT, 2025-2030 (USD MILLION)
- TABLE 126 EUROPE: CARBON FOOTPRINT MANAGEMENT MARKET, BY SERVICE, 2021-2024 (USD MILLION)
- TABLE 127 EUROPE: CARBON FOOTPRINT MANAGEMENT MARKET, BY SERVICE, 2025-2030 (USD MILLION)
- TABLE 128 EUROPE: CARBON FOOTPRINT MANAGEMENT MARKET, BY DEPLOYMENT MODE, 2021-2024 (USD MILLION)
- TABLE 129 EUROPE: CARBON FOOTPRINT MANAGEMENT MARKET, BY DEPLOYMENT MODE, 2025-2030 (USD MILLION)
- TABLE 130 EUROPE: CARBON FOOTPRINT MANAGEMENT MARKET, BY ORGANIZATION SIZE, 2021-2024 (USD MILLION)
- TABLE 131 EUROPE: CARBON FOOTPRINT MANAGEMENT MARKET, BY ORGANIZATION SIZE, 2025-2030 (USD MILLION)
- TABLE 132 EUROPE: CARBON FOOTPRINT MANAGEMENT MARKET, BY VERTICAL, 2021-2024 (USD MILLION)
- TABLE 133 EUROPE: CARBON FOOTPRINT MANAGEMENT MARKET, BY VERTICAL, 2025-2030 (USD MILLION)
- TABLE 134 EUROPE: CARBON FOOTPRINT MANAGEMENT MARKET, BY MANUFACTURING INDUSTRY, 2021-2024 (USD MILLION)
- TABLE 135 EUROPE: CARBON FOOTPRINT MANAGEMENT MARKET, BY MANUFACTURING INDUSTRY, 2025-2030 (USD MILLION)
- TABLE 136 EUROPE: CARBON FOOTPRINT MANAGEMENT MARKET, BY COUNTRY, 2021-2024 (USD MILLION)
- TABLE 137 EUROPE: CARBON FOOTPRINT MANAGEMENT MARKET, BY COUNTRY, 2025-2030 (USD MILLION)
- TABLE 138 GERMANY: CARBON FOOTPRINT MANAGEMENT MARKET, BY COMPONENT, 2021-2024 (USD MILLION)
- TABLE 139 GERMANY: CARBON FOOTPRINT MANAGEMENT MARKET, BY COMPONENT, 2025-2030 (USD MILLION)
- TABLE 140 GERMANY: CARBON FOOTPRINT MANAGEMENT MARKET, BY SERVICE, 2021-2024 (USD MILLION)
- TABLE 141 GERMANY: CARBON FOOTPRINT MANAGEMENT MARKET, BY SERVICE, 2025-2030 (USD MILLION)
- TABLE 142 GERMANY: CARBON FOOTPRINT MANAGEMENT MARKET, BY DEPLOYMENT MODE, 2021-2024 (USD MILLION)
- TABLE 143 GERMANY: CARBON FOOTPRINT MANAGEMENT MARKET, BY DEPLOYMENT MODE, 2025-2030 (USD MILLION)
- TABLE 144 GERMANY: CARBON FOOTPRINT MANAGEMENT MARKET, BY ORGANIZATION SIZE, 2021-2024 (USD MILLION)
- TABLE 145 GERMANY: CARBON FOOTPRINT MANAGEMENT MARKET, BY ORGANIZATION SIZE, 2025-2030 (USD MILLION)
- TABLE 146 FRANCE: CARBON FOOTPRINT MANAGEMENT MARKET, BY COMPONENT, 2021-2024 (USD MILLION)
- TABLE 147 FRANCE: CARBON FOOTPRINT MANAGEMENT MARKET, BY COMPONENT, 2025-2030 (USD MILLION)
- TABLE 148 FRANCE: CARBON FOOTPRINT MANAGEMENT MARKET, BY SERVICE, 2021-2024 (USD MILLION)
- TABLE 149 FRANCE: CARBON FOOTPRINT MANAGEMENT MARKET, BY SERVICE, 2025-2030 (USD MILLION)
- TABLE 150 FRANCE: CARBON FOOTPRINT MANAGEMENT MARKET, BY DEPLOYMENT MODE, 2021-2024 (USD MILLION)
- TABLE 151 FRANCE: CARBON FOOTPRINT MANAGEMENT MARKET, BY DEPLOYMENT MODE, 2025-2030 (USD MILLION)
- TABLE 152 FRANCE: CARBON FOOTPRINT MANAGEMENT MARKET, BY ORGANIZATION SIZE, 2021-2024 (USD MILLION)
- TABLE 153 FRANCE: CARBON FOOTPRINT MANAGEMENT MARKET, BY ORGANIZATION SIZE, 2025-2030 (USD MILLION)
- TABLE 154 UK: CARBON FOOTPRINT MANAGEMENT MARKET, BY COMPONENT, 2021-2024 (USD MILLION)
- TABLE 155 UK: CARBON FOOTPRINT MANAGEMENT MARKET, BY COMPONENT, 2025-2030 (USD MILLION)
- TABLE 156 UK: CARBON FOOTPRINT MANAGEMENT MARKET, BY SERVICE, 2021-2024 (USD MILLION)
- TABLE 157 UK: CARBON FOOTPRINT MANAGEMENT MARKET, BY SERVICE, 2025-2030 (USD MILLION)
- TABLE 158 UK: CARBON FOOTPRINT MANAGEMENT MARKET, BY DEPLOYMENT MODE, 2021-2024 (USD MILLION)
- TABLE 159 UK: CARBON FOOTPRINT MANAGEMENT MARKET, BY DEPLOYMENT MODE, 2025-2030 (USD MILLION)
- TABLE 160 UK: CARBON FOOTPRINT MANAGEMENT MARKET, BY ORGANIZATION SIZE, 2021-2024 (USD MILLION)
- TABLE 161 UK: CARBON FOOTPRINT MANAGEMENT MARKET, BY ORGANIZATION SIZE, 2025-2030 (USD MILLION)
- TABLE 162 REST OF EUROPE: CARBON FOOTPRINT MANAGEMENT MARKET, BY COMPONENT, 2021-2024 (USD MILLION)
- TABLE 163 REST OF EUROPE: CARBON FOOTPRINT MANAGEMENT MARKET, BY COMPONENT, 2025-2030 (USD MILLION)
- TABLE 164 REST OF EUROPE: CARBON FOOTPRINT MANAGEMENT MARKET, BY SERVICE, 2021-2024 (USD MILLION)
- TABLE 165 REST OF EUROPE: CARBON FOOTPRINT MANAGEMENT MARKET, BY SERVICE, 2025-2030 (USD MILLION)
- TABLE 166 REST OF EUROPE: CARBON FOOTPRINT MANAGEMENT MARKET, BY DEPLOYMENT MODE, 2021-2024 (USD MILLION)
- TABLE 167 REST OF EUROPE: CARBON FOOTPRINT MANAGEMENT MARKET, BY DEPLOYMENT MODE, 2025-2030 (USD MILLION)
- TABLE 168 REST OF EUROPE: CARBON FOOTPRINT MANAGEMENT MARKET, BY ORGANIZATION SIZE, 2021-2024 (USD MILLION)
- TABLE 169 REST OF EUROPE: CARBON FOOTPRINT MANAGEMENT MARKET, BY ORGANIZATION SIZE, 2025-2030 (USD MILLION)
- TABLE 170 ASIA PACIFIC: CARBON FOOTPRINT MANAGEMENT MARKET, BY COMPONENT, 2021-2024 (USD MILLION)
- TABLE 171 ASIA PACIFIC: CARBON FOOTPRINT MANAGEMENT MARKET, BY COMPONENT, 2025-2030 (USD MILLION)
- TABLE 172 ASIA PACIFIC: CARBON FOOTPRINT MANAGEMENT MARKET, BY SERVICE, 2021-2024 (USD MILLION)
- TABLE 173 ASIA PACIFIC: CARBON FOOTPRINT MANAGEMENT MARKET, BY SERVICE, 2025-2030 (USD MILLION)
- TABLE 174 ASIA PACIFIC: CARBON FOOTPRINT MANAGEMENT MARKET, BY DEPLOYMENT MODE, 2021-2024 (USD MILLION)
- TABLE 175 ASIA PACIFIC: CARBON FOOTPRINT MANAGEMENT MARKET, BY DEPLOYMENT MODE, 2025-2030 (USD MILLION)
- TABLE 176 ASIA PACIFIC: CARBON FOOTPRINT MANAGEMENT MARKET, BY ORGANIZATION SIZE, 2021-2024 (USD MILLION)
- TABLE 177 ASIA PACIFIC: CARBON FOOTPRINT MANAGEMENT MARKET, BY ORGANIZATION SIZE, 2025-2030 (USD MILLION)
- TABLE 178 ASIA PACIFIC: CARBON FOOTPRINT MANAGEMENT MARKET, BY VERTICAL, 2021-2024 (USD MILLION)
- TABLE 179 ASIA PACIFIC: CARBON FOOTPRINT MANAGEMENT MARKET, BY VERTICAL, 2025-2030 (USD MILLION)
- TABLE 180 ASIA PACIFIC: CARBON FOOTPRINT MANAGEMENT MARKET, BY MANUFACTURING INDUSTRY, 2021-2024 (USD MILLION)
- TABLE 181 ASIA PACIFIC: CARBON FOOTPRINT MANAGEMENT MARKET, BY MANUFACTURING INDUSTRY, 2025-2030 (USD MILLION)
- TABLE 182 ASIA PACIFIC: CARBON FOOTPRINT MANAGEMENT MARKET, BY COUNTRY, 2021-2024 (USD MILLION)
- TABLE 183 ASIA PACIFIC: CARBON FOOTPRINT MANAGEMENT MARKET, BY COUNTRY, 2025-2030 (USD MILLION)
- TABLE 184 CHINA: CARBON FOOTPRINT MANAGEMENT MARKET, BY COMPONENT, 2021-2024 (USD MILLION)
- TABLE 185 CHINA: CARBON FOOTPRINT MANAGEMENT MARKET, BY COMPONENT, 2025-2030 (USD MILLION)
- TABLE 186 CHINA: CARBON FOOTPRINT MANAGEMENT MARKET, BY SERVICE, 2021-2024 (USD MILLION)
- TABLE 187 CHINA: CARBON FOOTPRINT MANAGEMENT MARKET, BY SERVICE, 2025-2030 (USD MILLION)
- TABLE 188 CHINA: CARBON FOOTPRINT MANAGEMENT MARKET, BY DEPLOYMENT MODE, 2021-2024 (USD MILLION)
- TABLE 189 CHINA: CARBON FOOTPRINT MANAGEMENT MARKET, BY DEPLOYMENT MODE, 2025-2030 (USD MILLION)
- TABLE 190 CHINA: CARBON FOOTPRINT MANAGEMENT MARKET, BY ORGANIZATION SIZE, 2021-2024 (USD MILLION)
- TABLE 191 CHINA: CARBON FOOTPRINT MANAGEMENT MARKET, BY ORGANIZATION SIZE, 2025-2030 (USD MILLION)
- TABLE 192 INDIA: CARBON FOOTPRINT MANAGEMENT MARKET, BY COMPONENT, 2021-2024 (USD MILLION)
- TABLE 193 INDIA: CARBON FOOTPRINT MANAGEMENT MARKET, BY COMPONENT, 2025-2030 (USD MILLION)
- TABLE 194 INDIA: CARBON FOOTPRINT MANAGEMENT MARKET, BY SERVICE, 2021-2024 (USD MILLION)
- TABLE 195 INDIA: CARBON FOOTPRINT MANAGEMENT MARKET, BY SERVICE, 2025-2030 (USD MILLION)
- TABLE 196 INDIA: CARBON FOOTPRINT MANAGEMENT MARKET, BY DEPLOYMENT MODE, 2021-2024 (USD MILLION)
- TABLE 197 INDIA: CARBON FOOTPRINT MANAGEMENT MARKET, BY DEPLOYMENT MODE, 2025-2030 (USD MILLION)
- TABLE 198 INDIA: CARBON FOOTPRINT MANAGEMENT MARKET, BY ORGANIZATION SIZE, 2021-2024 (USD MILLION)
- TABLE 199 INDIA: CARBON FOOTPRINT MANAGEMENT MARKET, BY ORGANIZATION SIZE, 2025-2030 (USD MILLION)
- TABLE 200 JAPAN: CARBON FOOTPRINT MANAGEMENT MARKET, BY COMPONENT, 2021-2024 (USD MILLION)
- TABLE 201 JAPAN: CARBON FOOTPRINT MANAGEMENT MARKET, BY COMPONENT, 2025-2030 (USD MILLION)
- TABLE 202 JAPAN: CARBON FOOTPRINT MANAGEMENT MARKET, BY SERVICE, 2021-2024 (USD MILLION)
- TABLE 203 JAPAN: CARBON FOOTPRINT MANAGEMENT MARKET, BY SERVICE, 2025-2030 (USD MILLION)
- TABLE 204 JAPAN: CARBON FOOTPRINT MANAGEMENT MARKET, BY DEPLOYMENT MODE, 2021-2024 (USD MILLION)
- TABLE 205 JAPAN: CARBON FOOTPRINT MANAGEMENT MARKET, BY DEPLOYMENT MODE, 2025-2030 (USD MILLION)
- TABLE 206 JAPAN: CARBON FOOTPRINT MANAGEMENT MARKET, BY ORGANIZATION SIZE, 2021-2024 (USD MILLION)
- TABLE 207 JAPAN: CARBON FOOTPRINT MANAGEMENT MARKET, BY ORGANIZATION SIZE, 2025-2030 (USD MILLION)
- TABLE 208 SINGAPORE: CARBON FOOTPRINT MANAGEMENT MARKET, BY COMPONENT, 2021-2024 (USD MILLION)
- TABLE 209 SINGAPORE: CARBON FOOTPRINT MANAGEMENT MARKET, BY COMPONENT, 2025-2030 (USD MILLION)
- TABLE 210 SINGAPORE: CARBON FOOTPRINT MANAGEMENT MARKET, BY SERVICE, 2021-2024 (USD MILLION)
- TABLE 211 SINGAPORE: CARBON FOOTPRINT MANAGEMENT MARKET, BY SERVICE, 2025-2030 (USD MILLION)
- TABLE 212 SINGAPORE: CARBON FOOTPRINT MANAGEMENT MARKET, BY DEPLOYMENT MODE, 2021-2024 (USD MILLION)
- TABLE 213 SINGAPORE: CARBON FOOTPRINT MANAGEMENT MARKET, BY DEPLOYMENT MODE, 2025-2030 (USD MILLION)
- TABLE 214 SINGAPORE: CARBON FOOTPRINT MANAGEMENT MARKET, BY ORGANIZATION SIZE, 2021-2024 (USD MILLION)
- TABLE 215 SINGAPORE: CARBON FOOTPRINT MANAGEMENT MARKET, BY ORGANIZATION SIZE, 2025-2030 (USD MILLION)
- TABLE 216 AUSTRALIA: CARBON FOOTPRINT MANAGEMENT MARKET, BY COMPONENT, 2021-2024 (USD MILLION)
- TABLE 217 AUSTRALIA: CARBON FOOTPRINT MANAGEMENT MARKET, BY COMPONENT, 2025-2030 (USD MILLION)
- TABLE 218 AUSTRALIA: CARBON FOOTPRINT MANAGEMENT MARKET, BY SERVICE, 2021-2024 (USD MILLION)
- TABLE 219 AUSTRALIA: CARBON FOOTPRINT MANAGEMENT MARKET, BY SERVICE, 2025-2030 (USD MILLION)
- TABLE 220 AUSTRALIA: CARBON FOOTPRINT MANAGEMENT MARKET, BY DEPLOYMENT MODE, 2021-2024 (USD MILLION)
- TABLE 221 AUSTRALIA: CARBON FOOTPRINT MANAGEMENT MARKET, BY DEPLOYMENT MODE, 2025-2030 (USD MILLION)
- TABLE 222 AUSTRALIA: CARBON FOOTPRINT MANAGEMENT MARKET, BY ORGANIZATION SIZE, 2021-2024 (USD MILLION)
- TABLE 223 AUSTRALIA: CARBON FOOTPRINT MANAGEMENT MARKET, BY ORGANIZATION SIZE, 2025-2030 (USD MILLION)
- TABLE 224 REST OF ASIA PACIFIC: CARBON FOOTPRINT MANAGEMENT MARKET, BY COMPONENT, 2021-2024 (USD MILLION)
- TABLE 225 REST OF ASIA PACIFIC: CARBON FOOTPRINT MANAGEMENT MARKET, BY COMPONENT, 2025-2030 (USD MILLION)
- TABLE 226 REST OF ASIA PACIFIC: CARBON FOOTPRINT MANAGEMENT MARKET, BY SERVICE, 2021-2024 (USD MILLION)
- TABLE 227 REST OF ASIA PACIFIC: CARBON FOOTPRINT MANAGEMENT MARKET, BY SERVICE, 2025-2030 (USD MILLION)
- TABLE 228 REST OF ASIA PACIFIC: CARBON FOOTPRINT MANAGEMENT MARKET, BY DEPLOYMENT MODE, 2021-2024 (USD MILLION)
- TABLE 229 REST OF ASIA PACIFIC: CARBON FOOTPRINT MANAGEMENT MARKET, BY DEPLOYMENT MODE, 2025-2030 (USD MILLION)
- TABLE 230 REST OF ASIA PACIFIC: CARBON FOOTPRINT MANAGEMENT MARKET, BY ORGANIZATION SIZE, 2021-2024 (USD MILLION)
- TABLE 231 REST OF ASIA PACIFIC: CARBON FOOTPRINT MANAGEMENT MARKET, BY ORGANIZATION SIZE, 2025-2030 (USD MILLION)
- TABLE 232 MIDDLE EAST & AFRICA: CARBON FOOTPRINT MANAGEMENT MARKET, BY COMPONENT, 2021-2024 (USD MILLION)
- TABLE 233 MIDDLE EAST & AFRICA: CARBON FOOTPRINT MANAGEMENT MARKET, BY COMPONENT, 2025-2030 (USD MILLION)
- TABLE 234 MIDDLE EAST & AFRICA: CARBON FOOTPRINT MANAGEMENT MARKET, BY SERVICE, 2021-2024 (USD MILLION)
- TABLE 235 MIDDLE EAST & AFRICA: CARBON FOOTPRINT MANAGEMENT MARKET, BY SERVICE, 2025-2030 (USD MILLION)
- TABLE 236 MIDDLE EAST & AFRICA: CARBON FOOTPRINT MANAGEMENT MARKET, BY DEPLOYMENT MODE, 2021-2024 (USD MILLION)
- TABLE 237 MIDDLE EAST & AFRICA: CARBON FOOTPRINT MANAGEMENT MARKET, BY DEPLOYMENT MODE, 2025-2030 (USD MILLION)
- TABLE 238 MIDDLE EAST & AFRICA: CARBON FOOTPRINT MANAGEMENT MARKET, BY ORGANIZATION SIZE, 2021-2024 (USD MILLION)
- TABLE 239 MIDDLE EAST & AFRICA: CARBON FOOTPRINT MANAGEMENT MARKET, BY ORGANIZATION SIZE, 2025-2030 (USD MILLION)
- TABLE 240 MIDDLE EAST & AFRICA: CARBON FOOTPRINT MANAGEMENT MARKET, BY VERTICAL, 2021-2024 (USD MILLION)
- TABLE 241 MIDDLE EAST & AFRICA: CARBON FOOTPRINT MANAGEMENT MARKET, BY VERTICAL, 2025-2030 (USD MILLION)
- TABLE 242 MIDDLE EAST & AFRICA: CARBON FOOTPRINT MANAGEMENT MARKET, BY MANUFACTURING INDUSTRY, 2021-2024 (USD MILLION)
- TABLE 243 MIDDLE EAST & AFRICA: CARBON FOOTPRINT MANAGEMENT MARKET, BY MANUFACTURING INDUSTRY, 2025-2030 (USD MILLION)
- TABLE 244 MIDDLE EAST & AFRICA: CARBON FOOTPRINT MANAGEMENT MARKET, BY COUNTRY, 2021-2024 (USD MILLION)
- TABLE 245 MIDDLE EAST & AFRICA: CARBON FOOTPRINT MANAGEMENT MARKET, BY COUNTRY, 2025-2030 (USD MILLION)
- TABLE 246 SAUDI ARABIA: CARBON FOOTPRINT MANAGEMENT MARKET, BY COMPONENT, 2021-2024 (USD MILLION)
- TABLE 247 SAUDI ARABIA: CARBON FOOTPRINT MANAGEMENT MARKET, BY COMPONENT, 2025-2030 (USD MILLION)
- TABLE 248 SAUDI ARABIA: CARBON FOOTPRINT MANAGEMENT MARKET, BY SERVICE, 2021-2024 (USD MILLION)
- TABLE 249 SAUDI ARABIA: CARBON FOOTPRINT MANAGEMENT MARKET, BY SERVICE, 2025-2030 (USD MILLION)
- TABLE 250 SAUDI ARABIA: CARBON FOOTPRINT MANAGEMENT MARKET, BY DEPLOYMENT MODE, 2021-2024 (USD MILLION)
- TABLE 251 SAUDI ARABIA: CARBON FOOTPRINT MANAGEMENT MARKET, BY DEPLOYMENT MODE, 2025-2030 (USD MILLION)
- TABLE 252 SAUDI ARABIA: CARBON FOOTPRINT MANAGEMENT MARKET, BY ORGANIZATION SIZE, 2021-2024 (USD MILLION)
- TABLE 253 SAUDI ARABIA: CARBON FOOTPRINT MANAGEMENT MARKET, BY ORGANIZATION SIZE, 2025-2030 (USD MILLION)
- TABLE 254 UAE: CARBON FOOTPRINT MANAGEMENT MARKET, BY COMPONENT, 2021-2024 (USD MILLION)
- TABLE 255 UAE: CARBON FOOTPRINT MANAGEMENT MARKET, BY COMPONENT, 2025-2030 (USD MILLION)
- TABLE 256 UAE: CARBON FOOTPRINT MANAGEMENT MARKET, BY SERVICE, 2021-2024 (USD MILLION)
- TABLE 257 UAE: CARBON FOOTPRINT MANAGEMENT MARKET, BY SERVICE, 2025-2030 (USD MILLION)
- TABLE 258 UAE: CARBON FOOTPRINT MANAGEMENT MARKET, BY DEPLOYMENT MODE, 2021-2024 (USD MILLION)
- TABLE 259 UAE: CARBON FOOTPRINT MANAGEMENT MARKET, BY DEPLOYMENT MODE, 2025-2030 (USD MILLION)
- TABLE 260 UAE: CARBON FOOTPRINT MANAGEMENT MARKET, BY ORGANIZATION SIZE, 2021-2024 (USD MILLION)
- TABLE 261 UAE: CARBON FOOTPRINT MANAGEMENT MARKET, BY ORGANIZATION SIZE, 2025-2030 (USD MILLION)
- TABLE 262 REST OF MIDDLE EAST & AFRICA: CARBON FOOTPRINT MANAGEMENT MARKET, BY COMPONENT, 2021-2024 (USD MILLION)
- TABLE 263 REST OF MIDDLE EAST & AFRICA: CARBON FOOTPRINT MANAGEMENT MARKET, BY COMPONENT, 2025-2030 (USD MILLION)
- TABLE 264 REST OF MIDDLE EAST & AFRICA: CARBON FOOTPRINT MANAGEMENT MARKET, BY SERVICE, 2021-2024 (USD MILLION)
- TABLE 265 REST OF MIDDLE EAST & AFRICA: CARBON FOOTPRINT MANAGEMENT MARKET, BY SERVICE, 2025-2030 (USD MILLION)
- TABLE 266 REST OF MIDDLE EAST & AFRICA: CARBON FOOTPRINT MANAGEMENT MARKET, BY DEPLOYMENT MODE, 2021-2024 (USD MILLION)
- TABLE 267 REST OF MIDDLE EAST & AFRICA: CARBON FOOTPRINT MANAGEMENT MARKET, BY DEPLOYMENT MODE, 2025-2030 (USD MILLION)
- TABLE 268 REST OF MIDDLE EAST & AFRICA: CARBON FOOTPRINT MANAGEMENT MARKET, BY ORGANIZATION SIZE, 2021-2024 (USD MILLION)
- TABLE 269 REST OF MIDDLE EAST & AFRICA: CARBON FOOTPRINT MANAGEMENT MARKET, BY ORGANIZATION SIZE, 2025-2030 (USD MILLION)
- TABLE 270 SOUTH AMERICA: CARBON FOOTPRINT MANAGEMENT MARKET, BY COMPONENT, 2021-2024 (USD MILLION)
- TABLE 271 SOUTH AMERICA: CARBON FOOTPRINT MANAGEMENT MARKET, BY COMPONENT, 2025-2030 (USD MILLION)
- TABLE 272 SOUTH AMERICA: CARBON FOOTPRINT MANAGEMENT MARKET, BY SERVICE, 2021-2024 (USD MILLION)
- TABLE 273 SOUTH AMERICA: CARBON FOOTPRINT MANAGEMENT MARKET, BY SERVICE, 2025-2030 (USD MILLION)
- TABLE 274 SOUTH AMERICA: CARBON FOOTPRINT MANAGEMENT MARKET, BY DEPLOYMENT MODE, 2021-2024 (USD MILLION)
- TABLE 275 SOUTH AMERICA: CARBON FOOTPRINT MANAGEMENT MARKET, BY DEPLOYMENT MODE, 2025-2030 (USD MILLION)
- TABLE 276 SOUTH AMERICA: CARBON FOOTPRINT MANAGEMENT MARKET, BY ORGANIZATION SIZE, 2021-2024 (USD MILLION)
- TABLE 277 SOUTH AMERICA: CARBON FOOTPRINT MANAGEMENT MARKET, BY ORGANIZATION SIZE, 2025-2030 (USD MILLION)
- TABLE 278 SOUTH AMERICA: CARBON FOOTPRINT MANAGEMENT MARKET, BY VERTICAL, 2021-2024 (USD MILLION)
- TABLE 279 SOUTH AMERICA: CARBON FOOTPRINT MANAGEMENT MARKET, BY VERTICAL, 2025-2030 (USD MILLION)
- TABLE 280 SOUTH AMERICA: CARBON FOOTPRINT MANAGEMENT MARKET, BY MANUFACTURING INDUSTRY, 2021-2024 (USD MILLION)
- TABLE 281 SOUTH AMERICA: CARBON FOOTPRINT MANAGEMENT MARKET, BY MANUFACTURING INDUSTRY, 2025-2030 (USD MILLION)
- TABLE 282 SOUTH AMERICA: CARBON FOOTPRINT MANAGEMENT MARKET, BY COUNTRY, 2021-2024 (USD MILLION)
- TABLE 283 SOUTH AMERICA: CARBON FOOTPRINT MANAGEMENT MARKET, BY COUNTRY, 2025-2030 (USD MILLION)
- TABLE 284 BRAZIL: CARBON FOOTPRINT MANAGEMENT MARKET, BY COMPONENT, 2021-2024 (USD MILLION)
- TABLE 285 BRAZIL: CARBON FOOTPRINT MANAGEMENT MARKET, BY COMPONENT, 2025-2030 (USD MILLION)
- TABLE 286 BRAZIL: CARBON FOOTPRINT MANAGEMENT MARKET, BY SERVICE, 2021-2024 (USD MILLION)
- TABLE 287 BRAZIL: CARBON FOOTPRINT MANAGEMENT MARKET, BY SERVICE, 2025-2030 (USD MILLION)
- TABLE 288 BRAZIL: CARBON FOOTPRINT MANAGEMENT MARKET, BY DEPLOYMENT MODE, 2021-2024 (USD MILLION)
- TABLE 289 BRAZIL: CARBON FOOTPRINT MANAGEMENT MARKET, BY DEPLOYMENT MODE, 2025-2030 (USD MILLION)
- TABLE 290 BRAZIL: CARBON FOOTPRINT MANAGEMENT MARKET, BY ORGANIZATION SIZE, 2021-2024 (USD MILLION)
- TABLE 291 BRAZIL: CARBON FOOTPRINT MANAGEMENT MARKET, BY ORGANIZATION SIZE, 2025-2030 (USD MILLION)
- TABLE 292 REST OF SOUTH AMERICA: CARBON FOOTPRINT MANAGEMENT MARKET, BY COMPONENT, 2021-2024 (USD MILLION)
- TABLE 293 REST OF SOUTH AMERICA: CARBON FOOTPRINT MANAGEMENT MARKET, BY COMPONENT, 2025-2030 (USD MILLION)
- TABLE 294 REST OF SOUTH AMERICA: CARBON FOOTPRINT MANAGEMENT MARKET, BY SERVICE, 2021-2024 (USD MILLION)
- TABLE 295 REST OF SOUTH AMERICA: CARBON FOOTPRINT MANAGEMENT MARKET, BY SERVICE, 2025-2030 (USD MILLION)
- TABLE 296 REST OF SOUTH AMERICA: CARBON FOOTPRINT MANAGEMENT MARKET, BY DEPLOYMENT MODE, 2021-2024 (USD MILLION)
- TABLE 297 REST OF SOUTH AMERICA: CARBON FOOTPRINT MANAGEMENT MARKET, BY DEPLOYMENT MODE, 2025-2030 (USD MILLION)
- TABLE 298 REST OF SOUTH AMERICA: CARBON FOOTPRINT MANAGEMENT MARKET, BY ORGANIZATION SIZE, 2021-2024 (USD MILLION)
- TABLE 299 REST OF SOUTH AMERICA: CARBON FOOTPRINT MANAGEMENT MARKET, BY ORGANIZATION SIZE, 2025-2030 (USD MILLION)
- TABLE 300 OVERVIEW OF KEY STRATEGIES ADOPTED BY TOP PLAYERS, JANUARY 2020 -JULY 2025
- TABLE 301 DEGREE OF COMPETITION
- TABLE 302 CARBON FOOTPRINT MANAGEMENT MARKET: COMPANY FOOTPRINT
- TABLE 303 CARBON FOOTPRINT MANAGEMENT MARKET: REGION FOOTPRINT
- TABLE 304 CARBON FOOTPRINT MANAGEMENT MARKET: COMPONENT FOOTPRINT
- TABLE 305 CARBON FOOTPRINT MANAGEMENT MARKET: DEPLOYMENT MODE FOOTPRINT
- TABLE 306 CARBON FOOTPRINT MANAGEMENT MARKET: VERTICAL FOOTPRINT
- TABLE 307 CARBON FOOTPRINT MANAGEMENT MARKET: KEY STARTUPS/SMES
- TABLE 308 COMPETITIVE BENCHMARKING OF STARTUPS/SMES
- TABLE 309 PRODUCT LAUNCHES, JANUARY 2020-JULY 2025
- TABLE 310 DEALS, JANUARY 2020-JULY 2025
- TABLE 311 CARBON FOOTPRINT MANAGEMENT MARKET: EXPANSIONS, JANUARY 2020- JULY 2025
- TABLE 312 SAP SE: COMPANY OVERVIEW
- TABLE 313 SAP SE: PRODUCTS/SOLUTIONS/SERVICES OFFERED
- TABLE 314 SAP SE: DEALS
- TABLE 315 SALESFORCE, INC.: COMPANY OVERVIEW
- TABLE 316 SALESFORCE, INC.: PRODUCTS/SOLUTIONS/SERVICES OFFERED
- TABLE 317 ENGIE: COMPANY OVERVIEW
- TABLE 318 ENGIE: PRODUCTS/SOLUTIONS/SERVICES OFFERED
- TABLE 319 SCHNEIDER ELECTRIC: COMPANY OVERVIEW
- TABLE 320 SCHNEIDER ELECTRIC: PRODUCTS/SOLUTIONS/SERVICES OFFERED
- TABLE 321 SCHNEIDER ELECTRIC: DEALS
- TABLE 322 IBM: COMPANY OVERVIEW
- TABLE 323 IBM: PRODUCTS/SOLUTIONS/SERVICES OFFERED
- TABLE 324 IBM: PRODUCT LAUNCHES
- TABLE 325 CARBON FOOTPRINT LTD.: COMPANY OVERVIEW
- TABLE 326 CARBON FOOTPRINT LTD.: PRODUCTS/SOLUTIONS/SERVICES OFFERED
- TABLE 327 ISOMETRIX: COMPANY OVERVIEW
- TABLE 328 ISOMETRIX: PRODUCTS/SOLUTIONS/SERVICES OFFERED
- TABLE 329 ISOMETRIX: PRODUCT LAUNCHES
- TABLE 330 ISOMETRIX: DEALS
- TABLE 331 INTELEX: COMPANY OVERVIEW
- TABLE 332 INTELEX: PRODUCTS/SOLUTIONS/SERVICES OFFERED
- TABLE 333 INTELEX: DEALS
- TABLE 334 INTELEX: EXPANSIONS
- TABLE 335 TRINITY CONSULTANTS, INC.: COMPANY OVERVIEW
- TABLE 336 TRINITY CONSULTANTS, INC.: PRODUCTS/SOLUTIONS/SERVICES OFFERED
- TABLE 337 TRINITY CONSULTANTS, INC.: DEALS
- TABLE 338 DAKOTA SOFTWARE CORPORATION: COMPANY OVERVIEW
- TABLE 339 DAKOTA SOFTWARE CORPORATION: PRODUCTS/SOLUTIONS/SERVICES OFFERED
- TABLE 340 DAKOTA SOFTWARE CORPORATION: DEALS
- TABLE 341 ENABLON: COMPANY OVERVIEW
- TABLE 342 ENABLON: PRODUCTS/SOLUTIONS/SERVICES OFFERED
- TABLE 343 ENABLON: DEALS
- TABLE 344 ENVIROSOFT: COMPANY OVERVIEW
- TABLE 345 ENVIROSOFT: PRODUCTS/SOLUTIONS/SERVICES OFFERED
- TABLE 346 ENVIANCE: COMPANY OVERVIEW
- TABLE 347 ENVIANCE: PRODUCTS/SOLUTIONS/SERVICES OFFERED
- TABLE 348 ENVIANCE: PRODUCT LAUNCHES
- TABLE 349 ENVIANCE: DEALS
- TABLE 350 ACCUVIO: COMPANY OVERVIEW
- TABLE 351 ACCUVIO: PRODUCTS/SOLUTIONS/SERVICES OFFERED
- TABLE 352 ACCUVIO: DEALS
- TABLE 353 ESP: COMPANY OVERVIEW
- TABLE 354 ESP: PRODUCTS/SOLUTIONS/SERVICES OFFERED
List of Figures
- FIGURE 1 CARBON FOOTPRINT MANAGEMENT MARKET SEGMENTATION AND REGIONAL SCOPE
- FIGURE 2 CARBON FOOTPRINT MANAGEMENT MARKET: RESEARCH DESIGN
- FIGURE 3 CARBON FOOTPRINT MANAGEMENT MARKET: DATA TRIANGULATION
- FIGURE 4 BREAKDOWN OF PRIMARY INTERVIEWS: BY COMPANY TYPE, DESIGNATION, AND REGION
- FIGURE 5 MAIN METRICS CONSIDERED FOR ANALYZING AND ASSESSING DEMAND FOR CARBON FOOTPRINT MANAGEMENT
- FIGURE 6 MARKET SIZE ESTIMATION METHODOLOGY: BOTTOM-UP APPROACH
- FIGURE 7 MARKET SIZE ESTIMATION METHODOLOGY: TOP-DOWN APPROACH
- FIGURE 8 KEY STEPS CONSIDERED FOR ASSESSING SUPPLY OF CARBON FOOTPRINT MANAGEMENT
- FIGURE 9 SUPPLY-SIDE ANALYSIS
- FIGURE 10 NORTH AMERICA HELD LARGEST SHARE OF CARBON FOOTPRINT MANAGEMENT MARKET IN 2024
- FIGURE 11 SOLUTIONS SEGMENT TO LEAD CARBON FOOTPRINT MANAGEMENT MARKET, BY COMPONENT
- FIGURE 12 CLOUD SEGMENT TO COMMAND MARKET IN 2025 AND 2030
- FIGURE 13 CORPORATES/ENTERPRISES TO BE LARGEST SEGMENT IN 2030
- FIGURE 14 MANUFACTURING SEGMENT TO DOMINATE CARBON FOOTPRINT MANAGEMENT MARKET, BY VERTICAL
- FIGURE 15 REGULATIONS FOR REDUCTION OF CARBON EMISSIONS TO BOOST CARBON FOOTPRINT MANAGEMENT MARKET BETWEEN 2025 AND 2030
- FIGURE 16 ASIA PACIFIC TO GROW AT HIGHEST CAGR DURING FORECAST PERIOD
- FIGURE 17 CLOUD SEGMENT AND US ACCOUNTED FOR LARGEST MARKET SHARE IN NORTH AMERICA IN 2024
- FIGURE 18 SOLUTIONS SEGMENT TO DOMINATE CARBON FOOTPRINT MANAGEMENT MARKET IN 2030
- FIGURE 19 CONSULTING SEGMENT TO LEAD CARBON FOOTPRINT MANAGEMENT MARKET IN 2030
- FIGURE 20 CLOUD SEGMENT TO ACCOUNT FOR LARGER SHARE OF CARBON FOOTPRINT MANAGEMENT MARKET IN 2030
- FIGURE 21 CORPORATES/ENTERPRISES TO BE LARGEST SEGMENT, BY ORGANIZATION SIZE, IN 2030
- FIGURE 22 MANUFACTURING TO BE DOMINANT VERTICAL IN CARBON FOOTPRINT MANAGEMENT MARKET IN 2030
- FIGURE 23 METALS & MINING TO LEAD MARKET AMONG MANUFACTURING INDUSTRIES IN 2030
- FIGURE 24 MARKET DYNAMICS FOR CARBON FOOTPRINT MANAGEMENT MARKET
- FIGURE 25 VALUE CHAIN ANALYSIS
- FIGURE 26 CARBON FOOTPRINT MANAGEMENT MARKET: ECOSYSTEM ANALYSIS
- FIGURE 27 PORTER'S FIVE FORCES ANALYSIS FOR CARBON FOOTPRINT MANAGEMENT MARKET
- FIGURE 28 INFLUENCE OF KEY STAKEHOLDERS ON BUYING PROCESS FOR TOP THREE VERTICALS
- FIGURE 29 KEY BUYING CRITERIA FOR TOP VERTICALS
- FIGURE 30 IMPACT OF GEN AI/AI ON CARBON FOOTPRINT MANAGEMENT MARKET, BY VERTICAL
- FIGURE 31 CARBON FOOTPRINT MANAGEMENT MARKET, BY ORGANIZATION SIZE, 2024
- FIGURE 32 CARBON FOOTPRINT MANAGEMENT MARKET, BY VERTICAL, 2024
- FIGURE 33 CARBON FOOTPRINT MANAGEMENT MARKET, BY COMPONENT, 2024
- FIGURE 34 CARBON FOOTPRINT MANAGEMENT MARKET, BY DEPLOYMENT MODE, 2024
- FIGURE 35 CARBON FOOTPRINT MANAGEMENT MARKET IN ASIA PACIFIC TO GROW AT HIGHEST CAGR FROM 2025 TO 2030
- FIGURE 36 CARBON FOOTPRINT MANAGEMENT MARKET: SHARE OF EACH REGION, 2024
- FIGURE 37 SNAPSHOT: NORTH AMERICA CARBON FOOTPRINT MANAGEMENT MARKET
- FIGURE 38 SNAPSHOT: EUROPE CARBON FOOTPRINT MANAGEMENT MARKET
- FIGURE 39 CARBON FOOTPRINT MANAGEMENT MARKET SHARE ANALYSIS, 2024
- FIGURE 40 TOP PLAYERS IN CARBON FOOTPRINT MANAGEMENT MARKET FROM 2020 TO 2024
- FIGURE 41 BRAND/PRODUCT COMPARISON
- FIGURE 42 COMPANY VALUATION
- FIGURE 43 FINANCIAL METRICS
- FIGURE 44 CARBON FOOTPRINT MANAGEMENT MARKET: COMPANY EVALUATION MATRIX (KEY PLAYERS), 2024
- FIGURE 45 CARBON FOOTPRINT MANAGEMENT MARKET: COMPANY EVALUATION MATRIX (STARTUPS/SMES), 2024
- FIGURE 46 SAP SE: COMPANY SNAPSHOT
- FIGURE 47 SALESFORCE, INC. GROUP: COMPANY SNAPSHOT
- FIGURE 48 ENGIE: COMPANY SNAPSHOT
- FIGURE 49 SCHNEIDER ELECTRIC: COMPANY SNAPSHOT
- FIGURE 50 IBM: COMPANY SNAPSHOT
 碳足跡管理市場:按組件、組織規模、最終用戶、部署模式和應用分類-2026-2032年全球市場預測
 2026年全球產品碳足跡檢驗市場報告
 碳足跡管理市場:依產品、部署方式、企業規模、最終用戶產業及地區劃分:產業趨勢及全球預測(至 2035 年)2026年全球碳足跡管理市場報告2026年全球碳足跡管理軟體市場報告
 全球碳足跡管理市場規模、佔有率、趨勢和成長分析報告(2026-2034年)
 碳足跡管理市場 - 全球產業規模、佔有率、趨勢、競爭格局、機會及預測(按組件、部署模式、類型、最終用戶產業、地區和競爭格局分類,2021-2031年)
 碳足跡管理市場規模、佔有率和成長分析(按組件、部署類型、組織規模、垂直產業和地區分類)-2026-2033年產業預測
 2025 年至 2033 年碳足跡管理市場報告(按產品、部署模式、最終用途產業和地區分類)
 碳足跡管理市場 - 全球及區域分析:按組件、部署模型、垂直和地理 - 分析與預測(2025-2034)