


 |
市場調查報告書
商品編碼
1771311
細胞計數法市場:行業趨勢和全球預測 - 依細胞儀類型、公司規模、地區和主要企業Cell Cytometry Market: Industry Trends and Global Forecasts - Distribution by Type of Cell Cytometer, Company Size and Geographical Regions and Leading Players |
||||||
全球細胞計數法市場:概覽
預計到2035年,全球細胞計數法市場規模將從目前的18.2億美元成長至52.6億美元,預測期內的年複合成長率為10.1%。
市場區隔包括根據以下參數進行的市場規模和機會分析:
細胞計數法類型
- 高通量流式細胞儀
- 影像流式細胞儀
公司規模
- 小型
- 小型
- 中型
- 大型
- 超大型大
地區
- 北美(美國、加拿大、墨西哥)
- 歐洲(法國、德國、義大利、西班牙、英國、世界其他地區)
- 亞太地區(中國、日本、印度、韓國、澳洲、俄羅斯、泰國、馬來西亞、印尼、世界其他地區)
- 中東和北非(伊朗、沙烏地阿拉伯、埃及)
- 拉丁美洲(巴西、阿根廷、世界其他地區)
全球細胞計數法市場:成長與趨勢
細胞計數法是一種用於分析和表徵細胞的分析技術。近年來,該技術在醫療保健和製藥行業獲得了廣泛的支持,尤其是在識別生物標記和評估藥效學-藥物動力學關係方面。此外,細胞計數法在評估標靶治療藥物對免疫系統的影響方面也發揮關鍵作用。現代細胞計數法能夠詳細表徵免疫細胞群及其對各種疾病的反應,使其成為分析生物樣本的多功能工具。隨著全球慢性病的增多,對細胞計數法等先進生物分析技術的需求持續成長。
細胞計數法應用範圍廣泛,涵蓋基礎研究、藥物研發和臨床診斷,是闡明免疫反應、追蹤疾病進展和揭示細胞機制的寶貴工具。因此,許多產業參與者正致力於開發具有高通量、多重分析選項和增強資料分析工具的先進細胞計數法技術。
全球細胞計數法市場:關鍵洞察
本報告深入探討了全球細胞計數法市場的現狀,並識別了行業內的潛在成長機會。報告的主要調查結果包括:
- 目前,超過 220 種細胞計數法可用於廣泛的臨床和研發應用,其中大多數由美國公司開發。
- 市場格局的特點是,細胞計數法市場種類繁多,它們利用多種檢測機制和顏色通道對細胞進行計數和分選。
- 大多數(91%)使用少於 10個顏色通道的高通量流式細胞儀由美國公司開發。
- 為了建立競爭優勢,各利益相關者正積極努力將先進功能融入各自的流式細胞儀產品組合,並遵循不斷發展的行業基準。
- 隨著流式細胞儀的普及,多家業界參與者已簽署多項高通量流式細胞儀和圖像流式細胞儀協議。
- 過去一年的合作數量最多,其中大部分是分銷協議和收購。
- 值得注意的是,總部位於北美的公司(75%)進行了收購。
- 一些投資者意識到細胞計數法領域的機會,已投資數百萬美元,用於支持具有先進功能的流式細胞儀的開發。
- 據報道,大部分創投輪次(約 90%)是透過 B 輪和 D 輪融資獲得的,其中大多數為 B 輪融資。
- 與工業界和非工業界利害關係人一起參與各種全球活動,探討細胞計數法產業的研究成果、相關挑戰和機會。
- 該領域 75%的網路研討會是在過去 2-3年內舉辦的,其中大部分由 Labroots 主辦。
- 過去 5年,學術界和工業界利益相關者已授予/提交了 1,500 多項與細胞計數法相關的專利,其中大部分為專利申請。
- 預計該市場將以 10.1%的年複合成長率成長。預計的市場機會可能均勻分佈在各種類型的流式細胞儀產品中,北美地區可能佔據目前的大部分市場佔有率。
細胞計數法市場參與者
- Agilent
- Beckton Dickinson
- Beckman Coulter Life Sciences
- Bio-Rad
- Chemometec
- Milkotronic
- PerkinElmer
- Sartorius
- Sony Biotechnology
- Thermo Fisher Scientific
- Union Biometrica
全球細胞計數法市場:關鍵細分市場
根據細胞計數法類型,市場細分為高通量細胞計數法和圖像細胞分析儀。目前,高通量細胞分析儀在全球細胞分析儀市場中佔有最大佔有率(約60%)。然而,由於對用於亞細胞形態可視化的高分辨率分析工具的需求不斷成長,預計影像細胞分析儀市場在預測期內將以更高的年複合成長率成長。
依公司規模劃分,市場可分為小型、小型、中型、大型及超大型公司。目前,超大型公司在細胞分析儀市場中佔有最高佔有率(約40%)。此外,由於強大的研發能力、廣泛的銷售網路、成熟的品牌聲譽以及大型公司在該領域的持續努力,該市場預計將以相對更高的年複合成長率成長。
依主要地區劃分,市場分為北美、歐洲、亞太地區及世界其他地區。目前,北美(約60%)在細胞分析儀市場中佔據主導地位,佔據最大的收入佔有率。然而,預計亞太地區市場在預測期內的年複合成長率將高達 14%。
本報告研究了全球細胞計數法市場,並提供了市場概況、依細胞儀類型、依公司規模劃分的趨勢、依地區劃分的趨勢以及參與市場的公司概況。
目錄
第1章 簡介
第2章 執行摘要
第3章 簡介
- 章節概述
- 細胞計數法
- 細胞計數法的優點與局限性
- 細胞計數法的整體趨勢
第4章 高通量流式細胞儀:市場模式
- 章節概述
- 高通量流式細胞儀:市場格局
- 高通量流式細胞儀:開發商格局
第5章 產品競爭力分析:高通量流式細胞儀
- 章節概述
- 假設/關鍵參數
- 研究方法
- 產品競爭力分析
第6章 影像細胞分析儀:市場格局
- 章節概述
- 影像細胞分析儀:市場格局
- 影像細胞分析儀:開發商格局
第7章 產品競爭力分析:影像細胞分析儀
- 章節概述
- 假設/關鍵參數
- 研究方法
- 產品競爭力分析
第8章 全球細胞計數法:公司簡介
- 章節概述
- Agilent
- Beckman Coulter Life Sciences
- Becton Dickinson
- Bio-Rad
- Chemometec
- Milkotronic
- Nexcelom Bioscience
- Sartorius
- Sony Biotechnology
- ThermoFisher Scientific
- Union Biometrica
第9章 全球細胞計數法:合作夥伴關係與合作
- 章節概述
- 合作模式
- 合作夥伴關係與合作列表
第10章 最新進展
- 章節概述
- 全球細胞計數法:資金與投資分析
- 全球細胞計數法:全球事件分析
- 結論
第11章 專利分析
- 章節概述
- 研究範圍與研究方法
- 細胞計數法:專利基準分析
- 細胞計數法:專利估值分析
- 被引用次數最高的專利
第12章 市場預測
- 章節概述
- 關鍵假設與研究方法
- 2035年全球細胞計數法市場
- 全球細胞計數法市場:依細胞分析儀類型
- 全球細胞計數法市場:依公司規模
- 全球細胞計數法市場:依主要地區
第13章 結論
第14章 執行洞察
第15章 附錄1:表格資料
第16章 附錄2:公司與組織清單
GLOBAL CELL CYTOMETRY MARKET: OVERVIEW
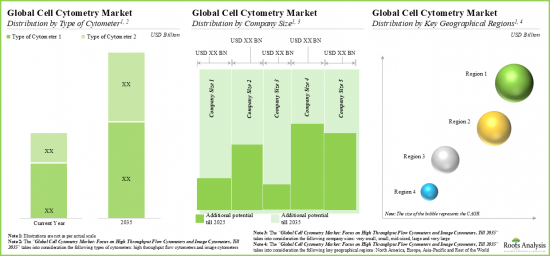
As per Roots Analysis, the global cell cytometry market is estimated to grow from USD 1.82 billion in the current year to USD 5.26 billion by 2035, at a CAGR of 10.1% during the forecast period, till 2035.
The market sizing and opportunity analysis has been segmented across the following parameters:
Type of Cell Cytometer
- High Throughput Flow Cytometers
- Image Cytometers
Company Size
- Very Small
- Small
- Mid-Sized
- Large
- Very Large
Geographical Regions
- North America (US, Canada, Mexico)
- Europe (France, Germany, Italy, Spain, UK, Rest of Europe)
- Asia Pacific (China, Japan, India, South Korea, Australia, Russia, Thailand, Malaysia, Indonesia, Rest of Asia Pacific)
- Middle East and North Africa (Iran, Saudi Arabia and Egypt)
- Latin America (Brazil, Argentina, Rest of Latin America)
GLOBAL CELL CYTOMETRY MARKET: GROWTH AND TRENDS
Cell cytometry is an analytical technique used for the analysis and characterization of cells. Recently, this technique has gained significant traction within the healthcare and pharmaceutical industries, particularly for biomarker identification and for assessing the relationship between pharmacodynamics and pharmacokinetics. Additionally, cell cytometers play a crucial role in evaluating the effects of targeted therapies on the immune system. Modern cell cytometers enable detailed characterization of immune cell populations and their responses to various diseases, making them highly versatile tools for analyzing biological samples. With the global rise in chronic diseases, the demand for advanced bioanalytical techniques like cell cytometry is continuously increasing.
Given the wide applications of cell cytometry ranging from basic research to drug discovery and clinical diagnostics, it has become an invaluable tool for unraveling immune responses, tracking disease progression, and understanding cellular mechanisms. As a result, many industry players are focusing on research efforts to develop advanced cell cytometry technologies featuring high-throughput capabilities, multiplexing options and enhanced data analysis tools.
GLOBAL CELL CYTOMETRY MARKET: KEY INSIGHTS
The report delves into the current state of global cell cytometry market and identifies potential growth opportunities within industry. Some key findings from the report include:
- Presently, over 220 cell cytometers are currently available for use across wide range of clinical studies and research applications; majority of these have been developed by companies based in the US.
- The market landscape features a variety of cell cytometers that make use of multiple detection mechanisms and color channels to count and sort cells.
- Majority (91%) of the high throughput flow cytometers that use less than 10 color channels have been developed by players headquartered in the US.
- In pursuit of building a competitive edge, stakeholders are making an active effort to incorporate advanced features in their respective portfolio of cytometers and comply with evolving industry benchmarks.
- With the growing adoption of cytometers, several industry players have signed multiple agreements for high throughput flow cytometers and image cytometers.
- The maximum number of partnerships were reported in the previous year; most of these deals were distribution agreements and acquisitions.
- Notably, all acquisitions in the industry have been undertaken by players headquartered in North America (75%); majority of these deals are focused on the expansion of product portfolio.
- Having realized the opportunity in the cell cytometry segment, several investors have collectively invested multi-million dollars to aid the development of cytometers with advanced features.
- Majority (~90%) of the amount raised via venture rounds was reported through venture series B and D; of these, most of the instances reported were of venture series B funding round.
- Both industry and non-industry players have participated in various global events to discuss the research outcomes, affiliated challenges as well as opportunities in the cell cytometry industry.
- 75% of the webinars in this domain have been organized in the last couple of years; of these, majority were organized by Labroots.
- More than 1,500 patents related to cell cytometers have been granted / filed by academia and industry stakeholders in the last five years; majority of these were patent applications.
- The market is expected to grow at a CAGR of 10.1%; the projected market opportunity is likely to be well distributed across different types of cytometers; North America is likely to capture majority of the current market share.
Example Players in the Cell Cytometry Market
- Agilent
- Beckton Dickinson
- Beckman Coulter Life Sciences
- Bio-Rad
- Chemometec
- Milkotronic
- PerkinElmer
- Sartorius
- Sony Biotechnology
- Thermo Fisher Scientific
- Union Biometrica
GLOBAL CELL CYTOMETRY MARKET: KEY SEGMENTS
High Throughput Cell Cytometers Segment Occupies the Largest Share of the Cell Cytometry Market
Based on the type of cell cytometers, the market is segmented into high throughput cell cytometers and image cytometers. At present, high throughput cell cytometers segment holds the maximum (~60%) share of the global cell cytometry market. However, due to the rising demand for high resolution analytical tools for the sub-cellular visualization of cell morphology, image cytometers segment is expected to grow at a higher CAGR during the forecast period.
By Company Size, Very Large Companies is the Fastest Growing Segment of the Global Cell Cytometry Market
Based on the company size, the market is segmented into very small, small, mid-size, large, and very large companies. Currently, very large segment captures the highest proportion (~40%) of the cell cytometry market. Further, this segment is likely to grow at a relatively higher CAGR due to the ongoing efforts of large companies in this domain, in addition to their strong R&D capabilities, extensive distribution networks and established brand reputation.
North America Accounts for the Largest Share of the Market
Based on key geographical regions, the market is segmented into North America, Europe, Asia-Pacific and Rest of the World. Currently, North America (~60%) dominates the cell cytometry market and accounts for the largest revenue share. However, the market in Asia-Pacific is expected to grow at a higher CAGR of 14% during the forecast period.
GLOBAL CELL CYTOMETRY MARKET
- Market Sizing and Opportunity Analysis: The report features an in-depth analysis of the global cell cytometry market, focusing on key market segments, including [A] type of cell cytometer, [B] company size and [C] key geographical regions.
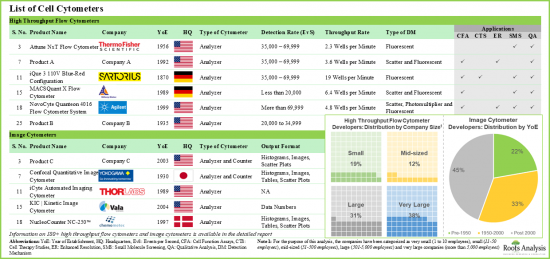
- High Throughput Flow Cytometers Market Landscape: A comprehensive evaluation of high throughput flow cytometers, considering various parameters, such as [A] type of high throughput flow cytometer, [B] throughput rate (wells per minute), [C] detection rate, [D] type of plate format(s), [E] number of color channels, [F] number of laser channels, [G] number of detection channels, [H] sample volume (in µl), [I] type of detection mechanism(s) and [J] application(s). Additionally, the section presents a comprehensive evaluation of high throughput flow cytometer developers, based on [A] year of establishment, [B] company size, [C] location of headquarters and [D] leading players.
- Product Competitiveness Analysis: An insightful competitive analysis of high throughput flow cytometers, examining factors, such as [A] developer power and [B] product competitiveness.
- Image Cytometers Market Landscape: A comprehensive evaluation of image cytometers, considering various parameters, such as [A] type of image cytometer, [B] processing time, [C] type of plate format(s), [D] output format(s), [E] sample volume and [F] application(s). Additionally, a comprehensive evaluation of image cytometer developers, based on [A] year of establishment, [B] company size, [C] location of headquarters and [E] leading players (in terms of number of products being offered).
- Product Competitiveness Analysis: An insightful competitive analysis of image cytometers, examining factors, such as [A] developer power and [B] product competitiveness.
- Company Profiles: In-depth profiles of companies engaged in the development / commercialization of cell cytometers, focusing on [A] company overview and [B] recent developments and an informed future outlook.
- Partnerships and Collaborations: An insightful analysis of the deals inked by stakeholders in this domain, based on several parameters, such as [A] year of partnership, [B] type of partnership, [C] most active players (in terms of the number of partnerships signed) and [D] geographical distribution of partnership activity.
- Recent Developments: A detailed analysis of recent developments / trends related to global cell cytometry domain, providing key insights on the funding activity in this domain, based on several relevant parameters, such as [A] year of funding, [B] type of funding, [C] amount invested (USD Million), [D] most active players and [E] most active investors. Additionally, the section presents a detailed evaluation of the global events attended by the participants, based on several relevant parameters, such as [A] year of event, [B] event platform, [C] type of event, [D] most active organizers and [E] most active organizations.
- Patent Analysis: An in-depth analysis of patents filed / granted for cell cytometry, based on various relevant parameters, such as [A] publication year, [B] geography, [C] CPC symbols, [D] emerging focus areas, [E] type of applicant, [F] leading industry players and [G] patent valuation analysis.
KEY QUESTIONS ANSWERED IN THIS REPORT
- How many companies are currently engaged in this market?
- Which are the leading companies in this market?
- What factors are likely to influence the evolution of this market?
- What is the current and future market size?
- What is the CAGR of this market?
- How is the current and future market opportunity likely to be distributed across key market segments?
REASONS TO BUY THIS REPORT
- The report provides a comprehensive market analysis, offering detailed revenue projections of the overall market and its specific sub-segments. This information is valuable to both established market leaders and emerging entrants.
- Stakeholders can leverage the report to gain a deeper understanding of the competitive dynamics within the market. By analyzing the competitive landscape, businesses can make informed decisions to optimize their market positioning and develop effective go-to-market strategies.
- The report offers stakeholders a comprehensive overview of the market, including key drivers, barriers, opportunities, and challenges. This information empowers stakeholders to stay abreast of market trends and make data-driven decisions to capitalize on growth prospects.
ADDITIONAL BENEFITS
- Complimentary PPT Insights Packs
- Complimentary Excel Data Packs for all Analytical Modules in the Report
- 15% Free Content Customization
- Detailed Report Walkthrough Session with Research Team
- Free Updated report if the report is 6-12 months old or older
TABLE OF CONTENTS
1. PREFACE
- 1.1. Scope of the Report
- 1.2. Research Methodology
- 1.2.1. Research Assumptions
- 1.2.2. Project Methodology
- 1.2.3. Forecast Methodology
- 1.2.4. Robust Quality Control
- 1.2.5. Key Considerations
- 1.2.5.1. Demographics
- 1.2.5.2. Economic Factors
- 1.2.5.3. Government Regulations
- 1.2.5.4. Supply Chain
- 1.2.5.5. COVID Impact / Related Factors
- 1.2.5.6. Market Access
- 1.2.5.7. Healthcare Policies
- 1.2.5.8. Industry Consolidation
- 1.3 Key Questions Answered
- 1.4. Chapter Outlines
2. EXECUTIVE SUMMARY
3. INTRODUCTION
- 3.1. Chapter Overview
- 3.2. Cell Cytometry
- 3.2.1. Flow Cytometry
- 3.2.1.1. High Throughput Flow Cytometry
- 3.2.2 Image Cytometry
- 3.2.1. Flow Cytometry
- 3.3. Advantages and Limitations of Cell Cytometry
- 3.4. Prevalent Trends Related to Cell Cytometry
- 3.4.1. Key Historical Trends
- 3.4.2. Geographical Activity
4. HIGH THROUGHPUT FLOW CYTOMETERS: MARKET LANDSCAPE
- 4.1. Chapter Overview
- 4.2. High Throughput Flow Cytometers: Overall Market Landscape
- 4.2.1. Analysis by Type of High Throughput Flow Cytometer
- 4.2.2. Analysis by Throughput Rate
- 4.2.3. Analysis by Detection Rate
- 4.2.4. Analysis by Type of Plate Format(s)
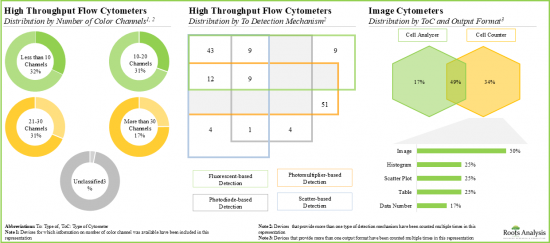
- 4.2.5. Analysis by Number of Color Channels
- 4.2.6. Analysis by Number of Detection Channels
- 4.2.7. Analysis by Number of Laser Channels
- 4.2.8. Analysis by Sample Volume
- 4.2.9. Analysis by Type of Detection Mechanism(s)
- 4.2.10. Analysis by Application(s)
- 4.3. High Throughput Flow Cytometers: Developer Landscape
- 4.3.1. Analysis by Year of Establishment
- 4.3.2. Analysis by Company Size
- 4.3.3. Analysis by Location of Headquarters
- 4.3.4. Most Active Players: Analysis by Number of Products Offered
5. PRODUCT COMPETITIVENESS ANALYSIS: HIGH THROUGHPUT FLOW CYTOMETERS
- 5.1. Chapter Overview
- 5.2. Assumptions / Key Parameters
- 5.3. Methodology
- 5.4. Product Competitiveness Analysis
- 5.4.1. Product Competitiveness Analysis: High Throughput Flow Cytometers offered by Developers based in North America
- 5.4.2. Product Competitiveness Analysis: High Throughput Flow Cytometers offered by Developers based in Europe and Asia-Pacific
6. IMAGE CYTOMETERS: MARKET LANDSCAPE
- 6.1. Chapter Overview
- 6.2. Image Cytometers: Overall Market Landscape
- 6.2.1. Analysis by Type of Image Cytometer
- 6.2.2. Analysis by Processing Time
- 6.2.3. Analysis by Type of Plate Format(s)
- 6.2.4. Analysis by Output Format(s)
- 6.2.5. Analysis by Sample Volume
- 6.2.6. Analysis by Application(s)
- 6.3. Image Cytometers: Developer Landscape
- 6.3.1. Analysis by Year of Establishment
- 6.3.2. Analysis by Company Size
- 6.3.3. Analysis by Location of Headquarters
- 6.3.4. Most Active Players: Analysis by Number of Products Offered
7. PRODUCT COMPETITIVENESS ANALYSIS: IMAGE CYTOMETERS
- 7.1. Chapter Overview
- 7.2. Assumptions / Key Parameters
- 7.3. Methodology
- 7.4. Product Competitiveness Analysis
- 7.4.1. Product Competitiveness Analysis: Image Cytometers offered by Developers based in North America
- 7.4.2. Product Competitiveness Analysis: Image Cytometers offered by Developers based in Europe and Asia-Pacific
8. GLOBAL CELL CYTOMETRY: COMPANY PROFILES
- 8.1. Chapter Overview
- 8.2. Agilent
- 8.2.1. Company Overview
- 8.2.2. Recent Developments and Future Outlook
- 8.3. Beckman Coulter Life Sciences
- 8.3.1. Company Overview
- 8.3.2. Recent Developments and Future Outlook
- 8.4. Becton Dickinson
- 8.4.1. Company Overview
- 8.4.2. Recent Developments and Future Outlook
- 8.5. Bio-Rad
- 8.5.1. Company Overview
- 8.5.2. Recent Developments and Future Outlook
- 8.6. Chemometec
- 8.6.1. Company Overview
- 8.6.2. Recent Developments and Future Outlook
- 8.7. Milkotronic
- 8.7.1. Company Overview
- 8.7.2. Recent Developments and Future Outlook
- 8.8. Nexcelom Bioscience
- 8.8.1. Company Overview
- 8.8.2. Recent Developments and Future Outlook
- 8.9. Sartorius
- 8.9.1. Company Overview
- 8.9.2. Recent Developments and Future Outlook
- 8.10. Sony Biotechnology
- 8.10.1. Company Overview
- 8.10.2. Recent Developments and Future Outlook
- 8.11. ThermoFisher Scientific
- 8.11.1. Company Overview
- 8.11.2. Recent Developments and Future Outlook
- 8.12. Union Biometrica
- 8.12.1. Company Overview
- 8.12.2. Recent Developments and Future Outlook
9. GLOBAL CELL CYTOMETYRY: PARTNERSHIPS AND COLLABORATIONS
- 9.1. Chapter Overview
- 9.2. Partnership Models
- 9.3. List of Partnerships and Collaborations
- 9.3.1. Analysis by Year of Partnership
- 9.3.2. Analysis by Type of Partnership
- 9.3.3. Most Active Players: Analysis by Number of Partnerships
- 9.3.4. Regional Analysis
- 9.3.5. Intercontinental and Intracontinental Agreements
10. RECENT DEVELOPMENTS
- 10.1. Chapter Overview
- 10.2. Global Cell Cytometry: Funding and Investment Analysis
- 10.2.1. Types of Funding
- 10.2.2. Analysis by Year of Investment
- 10.2.3. Analysis by Type of Funding
- 10.2.4. Analysis by Amount Invested
- 10.2.5. Most Active Players: Analysis by Number of Funding Instances
- 10.2.6. Most Active Players: Analysis by Amount Raised
- 10.2.7. Most Active Investors: Analysis by Number of Funding Instances
- 10.3. Global Cell Cytometry: Global Event Analysis
- 10.3.1. Analysis by Year of Event
- 10.3.2. Analysis by Event Platform
- 10.3.3. Analysis by Type of Event
- 10.3.4. Analysis by Geography
- 10.3.5. Most Active Event Organizers: Analysis by Number of Events
- 10.3.6. Most Active Organizations: Analysis by Number of Participants
- 10.4. Concluding Remarks
11. PATENT ANALYSIS
- 11.1. Chapter Overview
- 11.2. Scope and Methodology
- 11.2.1. Analysis by Type of Patent
- 11.2.2. Analysis by Patent Publication Year
- 11.2.3. Analysis by Annual Number of Granted Patents and Patent Applications
- 11.2.4. Analysis by Geographical Location
- 11.2.5. Analysis by CPC Symbols
- 11.2.6. Analysis by Type of Organization
- 11.2.7. Leading Industry Players: Analysis by Number of Patents
- 11.2.8. Leading Non-Industry Players: Analysis by Number of Patents
- 11.2.9. Leading Individual Assignees: Analysis by Number of Patents
- 11.3. Cell Cytometry: Patent Benchmarking Analysis
- 11.3.1. Analysis by Patent Characteristics
- 11.4. Cell Cytometry: Patent Valuation Analysis
- 11.5. Leading Patents by Number of Citations
12. MARKET FORECAST
- 12.1. Chapter Overview
- 12.2. Key Assumptions and Methodology
- 12.3. Global Cell Cytometry Market, Till 2035
- 12.3.1. Global Cell Cytometry Market: Distribution by Type of Cell Cytometer
- 12.3.1.1. Cell Cytometry Market for High Throughput Flow Cytometers, Till 2035
- 12.3.1.2. Cell Cytometry Market for Image Cytometers, Till 2035
- 12.3.2. Global Cell Cytometry Market: Distribution by Company Size
- 12.3.2.1. Cell Cytometry Market for Very Small Companies, Till 2035
- 12.3.2.2. Cell Cytometry Market for Small Companies, Till 2035
- 12.3.2.3. Cell Cytometry Market for Mid-sized Companies, Till 2035
- 12.3.2.4. Cell Cytometry Market for Large Companies, Till 2035
- 12.3.2.5. Cell Cytometry Market for Very Large Companies, Till 2035
- 12.3.3. Global Cell Cytometry Market: Distribution by Key Geographical Regions
- 12.3.3.1. Cell Cytometry Market in North America, Till 2035
- 12.3.3.2. Cell Cytometry Market in Europe, Till 2035
- 12.3.3.3. Cell Cytometry Market in Asia-Pacific, Till 2035
- 12.3.3.4. Cell Cytometry Market in Rest of the World, Till 2035
- 12.3.1. Global Cell Cytometry Market: Distribution by Type of Cell Cytometer
13. CONCLUDING REMARKS
14. EXECUTIVE INSIGHTS
15. APPENDIX 1: TABULATED DATA
16. APPENDIX 2: LIST OF COMPANIES AND ORGANIZATIONS
List of Tables
- Table 4.1 High Throughput Flow Cytometers: Information on Type of High Throughput Flow Cytometer and Throughput Rate
- Table 4.2 High Throughput Flow Cytometers: Information on Detection Rate
- Table 4.3 High Throughput Flow Cytometers: Information on Type of Plate Format(s)
- Table 4.4 High Throughput Flow Cytometers: Information on Number of Color Channels
- Table 4.5 High Throughput Flow Cytometers: Information on Number of Detection Channels
- Table 4.6 High Throughput Flow Cytometers: Information on Number of Laser Channels and Patented Technology
- Table 4.7 High Throughput Flow Cytometers: Information on Availability of Automation, Availability of Automatic Sampling and Sample Volume
- Table 4.8 High Throughput Flow Cytometers: Information on Type of Detection Mechanism(s)
- Table 4.9 High Throughput Flow Cytometers: Information on Application(s)
- Table 4.10 High Throughput Flow Cytometer Developers: Information on Year of Establishment, Company Size and Location of Headquarters
- Table 6.1 Image Cytometer: Information on Type of Image Cytometer
- Table 6.2 Image Cytometers: Information on Processing Time
- Table 6.3 Image Cytometer: Information on Type of Plate Format(s) and Magnification
- Table 6.4 Image Cytometer: Information on Output Format(s)
- Table 6.5 Image Cytometer: Information on Sample Volume
- Table 6.6 Image Cytometers: Information on Application(s)
- Table 6.7 Image Cytometer Developers: Information on Year of Establishment, Company Size and Location of Headquarters
- Table 8.1 List of Companies Profiled
- Table 8.2 Agilent: Company Overview
- Table 8.3 Agilent: Recent Developments and Future Outlook
- Table 8.4 Beckman Coulter Life Sciences: Company Overview
- Table 8.5 Beckman Coulter Life Sciences: Recent Developments and Future Outlook
- Table 8.6 Becton Dickinson: Company Overview
- Table 8.7 Becton Dickinson: Recent Developments and Future Outlook
- Table 8.8 Bio-Rad: Company Overview
- Table 8.9 Bio-Rad: Recent Developments and Future Outlook
- Table 8.10 Chemometec: Company Overview
- Table 8.11 Chemotec: Recent Developments and Future Outlook
- Table 8.12 Milkotronic: Company Overview
- Table 8.13 Nexcelom Bioscinces: Company Overview
- Table 8.14 Sartorius: Company Overview
- Table 8.15 Sartorius: Recent Developments and Future Outlook
- Table 8.16 Sony Biotechnology: Company Overview
- Table 8.17 Thermo Fischer Scientific: Company Overview
- Table 8.18 Thermo Fischer Scientific: Recent Developments and Future Outlook
- Table 8.19 Union Biometrica: Company Overview
- Table 8.20 Union Biometrica: Recent Developments and Future Outlook
- Table 9.1 Global Cell Cytometry: List of Partnerships and Collaborations, Since 2017
- Table 10.1 Global Cell Cytometry: List of Funding and Investments, Since 2017
- Table 10.2 Global Cell Cytometry: List of Global Events, Since 2018
- Table 11.1 Patent Analysis: Prominent CPC Symbols
- Table 11.2 Patent Analysis: List of Top CPC Symbols
- Table 11.3 Patent Analysis: Most Popular CPC Symbols
- Table 11.4 Patent Analysis: Summary of Benchmarking Analysis
- Table 11.5 Patent Analysis: Categorization based on Weighted Valuation Scores
- Table 11.6 Patent Portfolio: List of Leading Patents (by Highest Relative Valuation)
- Table 11.7 Patent Portfolio: List of Leading Patents (by Number of Citations)
- Table 15.1 High Throughput Flow Cytometers: Distribution by Type of High Throughput Flow Cytometer
- Table 15.2 High Throughput Flow Cytometers: Distribution by Throughput Rate
- Table 15.3 High Throughput Flow Cytometers: Distribution by Detection Rate
- Table 15.4 High Throughput Flow Cytometers: Distribution by Type of Plate Format(s)
- Table 15.5 High Throughput Flow Cytometers: Distribution by Number of Color Channels
- Table 15.6 High Throughput Flow Cytometers: Distribution by Number of Detection Channels
- Table 15.7 High Throughput Flow Cytometers: Distribution by Number of Laser Channels
- Table 15.8 High Throughput Flow Cytometers: Distribution by Sample Volume (in μl)
- Table 15.9 High Throughput Flow Cytometers: Distribution by Type of Detection Mechanism(s)
- Table 15.10 High Throughput Flow Cytometers: Distribution by Application(s)
- Table 15.11 High Throughput Flow Cytometer Developers: Distribution by Year of Establishment
- Table 15.12 High Throughput Flow Cytometer Developers: Distribution by Company Size
- Table 15.13 High Throughput Flow Cytometer Developers: Distribution by Location of Headquarters
- Table 15.14 Leading High Throughput Flow Cytometer Developers: Distribution by Number of Products Offered
- Table 15.15 Image Cytometers: Distribution by Type of Image Cytometer
- Table 15.16 Image Cytometers: Distribution by Processing Time
- Table 15.17 Image Cytometers: Distribution by Type of Plate Format(s)
- Table 15.18 Image Cytometers: Distribution by Output Format(s)
- Table 15.19 Image Cytometers: Distribution by Sample Volume
- Table 15.20 Image Cytometers: Distribution by Application(s)
- Table 15.21 Image Cytometer Developers: Distribution by Year of Establishment
- Table 15.22 Image Cytometer Developers: Distribution by Company Size
- Table 15.23 Image Cytometer Developers: Distribution by Location of Headquarters
- Table 15.24 Leading Image Cytometer Developers: Distribution by Number of Products Offered
- Table 15.25 Partnerships and Collaborations: Cumulative Year-wise Trend, Since 2017
- Table 15.26 Partnerships and Collaborations: Distribution by Type of Partnership
- Table 15.27 Partnerships and Collaborations: Distribution by Year and Type of Partnership, Since 2017
- Table 15.28 Most Active Players: Distribution by Number of Partnerships
- Table 15.29 Partnerships and Collaborations: Regional Analysis
- Table 15.30 Partnerships and Collaborations: Local and International Agreements
- Table 15.31 Partnerships and Collaborations: Intercontinental and Intracontinental Agreements
- Table 15.32 Funding and Investment Analysis: Cumulative Year-wise Distribution of Funding Instances, Since 2017
- Table 15.33 Funding and Investment Analysis: Distribution by Type of Funding
- Table 15.34 Funding and Investment Analysis: Cumulative Year-wise Distribution by Amount Invested, Since 2017 (USD Million)
- Table 15.35 Funding and Investment Analysis: Distribution by Type of Funding and Amount Invested (USD Million)
- Table 15.36 Funding and Investment Analysis: Year-Wise Distribution of Instances by Type of Funding and Total Amount Invested, Since 2017 (USD Million)
- Table 15.37 Most Active Players: Distribution by Number of Funding Instances
- Table 15.38 Most Active Players: Distribution by Amount Raised (USD Million)
- Table 15.39 Most Active Investors: Distribution by Number of Funding Instances
- Table 15.40 Global Events: Cumulative Half yearly Trend, Since 2018
- Table 15.41 Global Events: Distribution by Event Platform
- Table 15.42 Global Events: Distribution by Type of Event
- Table 15.43 Global Events: Regional Distribution of Event
- Table 15.44 Most Active Event Organizers: Distribution by Number of Events
- Table 15.45 Most Active Organizations: Distribution by Number of Participants
- Table 15.46 Patent Analysis: Distribution by Type of Patent
- Table 15.47 Patent Analysis: Cumulative Distribution by Publication Year, Since 2020
- Table 15.48 Patent Analysis: Cumulative Distribution by Annual Number of Granted Patents and Patent Applications, Since 2020
- Table 15.49 Patent Analysis: Distribution by Geographical Location
- Table 15.50 Patent Analysis: Cumulative Year-wise Distribution by Type of Organization, Since 2020
- Table 15.51 Leading Industry Players: Distribution by Number of Patents
- Table 15.52 Leading Non-Industry Players: Distribution by Number of Patents
- Table 15.53 Leading Individual Assignees: Distribution by Number of Patents
- Table 15.54 Leading Players: Benchmarking by Patent Characteristics (CPC Symbols)
- Table 15.55 Patent Analysis: Year-wise Distribution of Patents by Age
- Table 15.56 Cell Cytometry: Patent Valuation Analysis
- Table 15.57 Global Cell Cytometry Market, Till 2035: Conservative, Base and Optimistic Scenarios (USD Million)
- Table 15.58 Global Cell Cytometry Market: Distribution by Type of Cytometer
- Table 15.59 Cell Cytometry Market for High Throughput Flow Cytometers, Till 2035: Conservative, Base and Optimistic Scenarios (USD Million)
- Table 15.60 Cell Cytometry Market for Image Cytometers, Till 2035: Conservative, Base and Optimistic Scenarios (USD Million)
- Table 15.61 Global Cell Cytometry Market: Distribution by Company Size
- Table 15.62 Cell Cytometry Market for Very Small Companies, Till 2035: Conservative, Base and Optimistic Scenarios (USD Million)
- Table 15.63 Cell Cytometry Market for Small Companies, Till 2035: Conservative, Base and Optimistic Scenarios (USD Million)
- Table 15.64 Cell Cytometry Market for Mid-Sized Companies, Till 2035: Conservative, Base and Optimistic Scenarios (USD Million)
- Table 15.65 Cell Cytometry Market for Large Companies, Till 2035: Conservative, Base and Optimistic Scenarios (USD Million)
- Table 15.66 Cell Cytometry Market for Very Large Companies, Till 2035: Conservative, Base and Optimistic Scenarios (USD Million)
- Table 15.67 Global Cell Cytometry Market: Distribution by Key Geographical Regions
- Table 15.68 Cell Cytometry Market in North America, Till 2035: Conservative, Base and Optimistic Scenarios (USD Million)
- Table 15.69 Cell Cytometry Market in Europe, Till 2035, Conservative, Base and Optimistic Scenarios (USD Million)
- Table 15.70 Cell Cytometry Market in Asia-Pacific, Till 2035: Conservative, Base and Optimistic Scenarios (USD Million)
- Table 15.71 Cell Cytometry Market in Rest of the World, Till 2035: Conservative, Base and Optimistic Scenarios (USD Million)
List of Figures
- Figure 2.1 Executive Summary: High Throughput Flow Cytometers Market Landscape
- Figure 2.2 Executive Summary: Image Cytometers Market Landscape
- Figure 2.3 Executive Summary: Partnerships and Collaborations
- Figure 2.4 Executive Summary: Funding and Investment Analysis
- Figure 2.5 Executive Summary: Global Events
- Figure 2.6 Executive Summary: Patent Analysis
- Figure 2.7 Executive Summary: Market Forecast
- Figure 3.1 Types of Cytometers
- Figure 3.2 Advantages of Different Types of Cytometry
- Figure 3.3 Limitations of Different Types of Cytometry
- Figure 3.4 Google Trends: Historical Timeline
- Figure 3.5 Google Trends: Geographical Activity
- Figure 4.1 High Throughput Flow Cytometers: Distribution by Type of High Throughput Flow Cytometer
- Figure 4.2 High Throughput Flow Cytometers: Distribution by Throughput Rate
- Figure 4.3 High Throughput Flow Cytometers: Distribution by Detection Rate
- Figure 4.4 High Throughput Flow Cytometers: Distribution by Type of Plate Format(s)
- Figure 4.5 High Throughput Flow Cytometers: Distribution by Number of Color Channels
- Figure 4.6 High Throughput Flow Cytometers: Distribution by Number of DetectionChannels
- Figure 4.7 High Throughput Flow Cytometers: Distribution by Number of LaserChannels
- Figure 4.8 High Throughput Flow Cytometers: Distribution by Sample Volume (in μl)
- Figure 4.9 High Throughput Flow Cytometers: Distribution by Type of Detection Mechanism(s)
- Figure 4.10 High Throughput Flow Cytometers: Distribution by Application(s)
- Figure 4.11 High Throughput Flow Cytometer Developers: Distribution by Year of Establishment
- Figure 4.12 High Throughput Flow Cytometer Developers: Distribution by Company Size
- Figure 4.13 High Throughput Flow Cytometer Developers: Distribution by Location of Headquarters
- Figure 4.14 Leading High Throughput Flow Cytometer Developers: Distribution by Number of Products Offered
- Figure 5.1 Product Competitiveness Analysis: High Throughput Flow Cytometers offered by Players based in North America
- Figure 5.2 Product Competitiveness Analysis: High Throughput Flow Cytometers offered by Players based in Europe and Asia-Pacific
- Figure 6.1 Image Cytometer: Distribution by Type of Image Cytometer
- Figure 6.2 Image Cytometer: Distribution by Processing Time
- Figure 6.3 Image Cytometer: Distribution by Type of Plate Format(s)
- Figure 6.4 Image Cytometers: Distribution by Output Format(s)
- Figure 6.5 Image Cytometers: Distribution by Sample Volume
- Figure 6.6 Image Cytometer: Distribution by Application(s)
- Figure 6.7 Image Cytometer Developers: Distribution by Year of Establishment
- Figure 6.8 Image Cytometer Developers: Distribution by Company Size
- Figure 6.9 Image Cytometer Developers: Distribution by Location of Headquarters
- Figure 6.10 Leading Image Cytometer Developers: Distribution by Number of Products Offered
- Figure 7.1 Product Competitiveness Analysis: Image Cytometers offered by Players based in North America
- Figure 7.2 Product Competitiveness Analysis: Image Cytometers offered by Players based in Europe and Asia-Pacific
- Figure 9.1 Partnerships and Collaborations: Cumulative Year-wise Trend, Since 2017
- Figure 9.2 Partnerships and Collaborations: Distribution by Type of Partnership
- Figure 9.3 Partnerships and Collaborations: Distribution by Year and Type of Partnership, Since 2017
- Figure 9.4 Most Active Players: Distribution by Number of Partnerships
- Figure 9.5 Partnerships and Collaborations: Regional Analysis
- Figure 9.6 Partnerships and Collaborations: Local and International Agreements
- Figure 9.7 Partnerships and Collaborations: Intercontinental and Intracontinental Agreements
- Figure 10.1 Funding and Investment Analysis: Cumulative Year-wise Distribution of Funding Instances, Since 2017
- Figure 10.2 Funding and Investment Analysis: Distribution by Type of Funding
- Figure 10.3 Funding and Investment Analysis: Cumulative Year-wise Distribution by Amount Invested, Since 2017 (USD Million)
- Figure 10.4 Funding and Investment Analysis: Distribution by Type of Funding and Amount Invested (USD Million)
- Figure 10.5 Funding and Investment Analysis: Year-Wise Distribution of Instances by Type of Funding and Total Amount Invested, Since 2017 (USD Million)
- Figure 10.6 Most Active Players: Distribution by Number of Funding Instances
- Figure 10.7 Most Active Players: Distribution by Amount Raised (USD Million)
- Figure 10.8 Most Active Investors: Distribution by Number of Funding Instances
- Figure 10.9 Global Events: Cumulative Half yearly Trend, Since 2018
- Figure 10.10 Global Events: Distribution by Event Platform
- Figure 10.11 Global Events: Distribution by Type of Event
- Figure 10.12 Global Events: Regional Distribution of Events
- Figure 10.13 Most Active Event Organizers: Distribution by Number of Events
- Figure 10.14 Most Active Organizations: Distribution by Number of Participants
- Figure 11.1 Patent Analysis: Distribution by Type of Patent
- Figure 11.2 Patent Analysis: Cumulative Distribution by Publication Year, Since 2020
- Figure 11.3 Patent Analysis: Cumulative Distribution by Annual Number of Granted
- Figure 11.4 Patent Analysis: Distribution by Geographical Location
- Figure 11.5 Patent Analysis: Distribution by CPC Symbols
- Figure 11.6 Patent Analysis: Cumulative Year-wise Distribution by Type of Organization, Since 2020
- Figure 11.7 Leading Industry Players: Distribution by Number of Patents
- Figure 11.8 Leading Non-Industry Players: Distribution by Number of Patents
- Figure 11.9 Leading Individual Assignees: Distribution by Number of Patents
- Figure 11.10 Leading Players: Benchmarking by Patent Characteristics (CPC Symbols)
- Figure 11.11 Patent Analysis: Year-wise Distribution of Patents by Age
- Figure 11.12 Cell Cytometry: Patent Valuation Analysis
- Figure 12.1 Global Cell Cytometry Market, Till 2035 (USD Million)
- Figure 12.2 Global Cell Cytometry Market: Distribution by Type of Cell Cytometer
- Figure 12.3 Cell Cytometry Market for High Throughput Flow Cytometers, Till 2035 (USD Million)
- Figure 12.4 Cell Cytometry Market for Image Cytometers, Till 2035 (USD Million)
- Figure 12.5 Global Cell Cytometry Market: Distribution by Company Size
- Figure 12.6 Cell Cytometry Market for Very Small Companies, Till 2035 (USD Million)
- Figure 12.7 Cell Cytometry Market for Small Companies, Till 2035 (USD Million)
- Figure 12.8 Cell Cytometry Market for Mid-sized Companies, Till 2035 (USD Million)
- Figure 12.9 Cell Cytometry Market for Large Companies, Till 2035 (USD Million)
- Figure 12.10 Cell Cytometry Market for Very Large Companies, Till 2035 (USD Million)
- Figure 12.11 Global Cell Cytometry Market: Distribution by Key Geographical Regions
- Figure 12.12 Cell Cytometry Market in North America, Till 2035 (USD Million)
- Figure 12.13 Cell Cytometry Market in Europe, Till 2035 (USD Million)
- Figure 12.14 Cell Cytometry Market in Asia-Pacific, Till 2035 (USD Million)
- Figure 12.15 Cell Cytometry Market in Rest of the World, Till 2035 (USD Million)
- Figure 13.1 Concluding Remarks: High Throughput Flow Cytometers Market Landscape
- Figure 13.2 Concluding Remarks: Image Cytometers Market Landscape
- Figure 13.3 Concluding Remarks: Partnerships and Collaborations
- Figure 13.4 Concluding Remarks: Funding and Investment Analysis
- Figure 13.5 Concluding Remarks: Global Events
- Figure 13.6 Concluding Remarks: Patent Analysis
- Figure 13.7 Concluding Remarks: Market Forecast
 細胞計數市場分析及預測(至2035年):按類型、產品類型、服務、技術、應用、最終用戶、組件、模式和功能分類
 流式細胞技術市場-2026-2031年預測
 超高速流式細胞技術選儀市場:按技術、產品類型、應用和最終用戶分類 - 全球預測(2026-2032 年)
 2025年流式細胞技術全球市場報告2025年腫瘤學和免疫學領域全球流式細胞技術市場報告流式細胞技術市場(按產品類型、技術、應用領域和最終用戶)—2025-2030 年全球預測
 歐洲流式細胞技術市場:分析與預測(2025-2035)
 全球流式細胞技術市場(按產品、技術、應用、最終用戶和地區分類)- 預測至 2033 年
 2025 年至 2033 年流式細胞儀市場報告(按產品和服務、技術、應用、最終用戶和地區分類)
 亞太流式細胞技術市場:分析與預測(2025-2035)