


 |
市場調查報告書
商品編碼
1762529
流式細胞儀服務市場:產業趨勢及全球預測 - 依服務、設施數量、主要參與者、主要地區Flow Cytometry Services Market: Industry Trends and Global Forecasts - Distribution by Service, Number of Facilities, Key Players, and Key Geographical Regions |
||||||
流式細胞儀服務市場:概覽
今年全球流式細胞儀服務市場規模為 27.6億美元。預計到2035年的預測期內,該市場的年複合成長率將達到9.73%。
市場區隔包括以下參數的市場規模與機會分析:
服務
- 常見的流式細胞儀服務類型
- 檢測方法開發
- 耗材製造
- 基於分析的流式細胞儀服務類型
- PBMC分析
- 全血球分析
- 骨髓分析
- 幹細胞分析
- 稀有細胞檢測
- 細胞分析與亞群分析
- 細胞內染色
- 其他
主要地區
- 北美
- 歐洲
- 亞太地區
- 世界其他地區
流式細胞儀服務市場:成長與趨勢
流式細胞儀長期以來一直是疾病診斷和藥物研發中常用的分析技術。在生物學和醫學領域,流式細胞儀是一種測量懸浮在液體中的細胞或顆粒通過雷射光束時各種物理和化學特性的技術。此外,由於蛋白質印跡法和免疫組織化學等傳統技術有各種局限性,因此利害關係人選擇流式細胞儀等創新技術用於臨床研究。傳統方法特異性和靈敏度較低,並且可能得出錯誤的結果。值得注意的是,流式細胞儀技術有潛力克服這些挑戰。
此外,由於癌症和免疫疾病相關的醫療負擔日益加重,以及免疫學和生物醫學研究的不斷發展,預計流式細胞儀的應用將會增加。因此,人們越來越依賴流式細胞儀服務提供者來最佳化流程成本、克服與流程相關的複雜性並改善流程進度。
流式細胞儀服務市場:關鍵洞察
本報告深入探討了全球流式細胞儀服務市場的現狀,並識別了該行業中潛在的成長機會。主要調查結果包括:
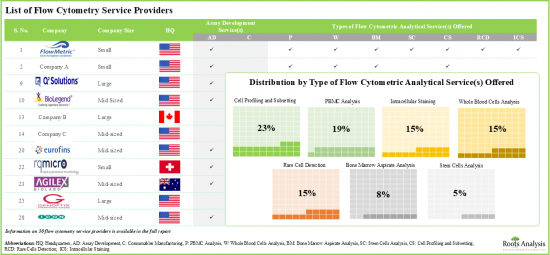
- 30家公司聲稱提供各種類型的流式細胞儀服務,其中大多數提供基於分析的流式細胞儀服務。
- 目前的市場格局包括成熟企業和新興企業,它們提供廣泛的流式細胞儀服務。
- 2000年後成立的一些領先的流式細胞儀服務提供者包括Neo Genomics、Q2 Solutions、Cell Carta和ICON Speciality Labs。
- 超過70%的利害關係人聲稱提供分析型流式細胞儀服務,其次是21%的公司提供一般型流式細胞儀服務。
- 近 75%的美國參與者屬於中端企業,其中大多數(約 80%)聲稱提供分析型流式細胞儀服務。
- 一些參與者也從事不同類型的流式細胞儀製造,包括用於多個應用領域的研究型和臨床型流式細胞儀。
- 超過 50%的流式細胞儀是研究型流式細胞儀,開發此類系統的參與者包括 Becton Dickinson 和 Sysmex Partec。
- 大多數流式細胞儀(60%)採用基於細胞的技術製造,儘管一些參與者也採用了基於微珠的流式技術。
- 所有權超過 100 家設施的流式細胞儀服務提供者在全球各地提供服務,其中大多數設施位於新興地區。
- 北美佔據流式細胞儀製造市場的主導地位,Agilent、Beckman Coulter、Thermofisher Scientific等公司都是該地區新進者。
- 為了追求競爭優勢,利害關係人積極擴展現有能力,增強各自的產品服務,並遵守不斷發展的產業基準。
- 過去幾年,該領域的合作活動顯著增加,其中大部分與併購有關。
- 預計到2035年,該市場將以每年 9.73%的速度成長,未來的機會預計將遍布各大地區。
流式細胞儀服務市場公司範例
- FlowMetric Life Sciences
- Flow Contract Sites Laboratory
- Bio-Legend
- Q2 Solutions
- ProImmune
- MLM Medical Labs
- Unilabs
- Firalis
- Agilex Biolabs
目錄
第1章 簡介
第2章 執行摘要
第3章 導論
- 章節概述
- 流式細胞儀簡介
- 流式細胞儀與傳統分析技術的比較
- 流式細胞儀、細胞分析儀和細胞分選儀之間的區別
- 流式細胞儀儀器
- 流式細胞儀服務
- 流式細胞儀的應用
- 未來展望
第4章 市場格局
- 章節概述
- 流式細胞儀服務提供者:市場格局
第5章 公司競爭力分析
第6章 公司簡介:北美流式細胞儀服務提供者
- 章節概述
- FlowMetric Life Sciences
- Flow Contract Sites Laboratory
- Bio-Legend
- Q2 Solutions
第7章 公司簡介:歐洲和亞太地區的流式細胞儀服務提供者
- 章節概述
- ProImmune
- MLM Medical Labs
- Unilabs
- Firalis
- Agilex Biolabs
第8章 合作夥伴與合作
第9章 效率比較模組
- 章節概述
- 關鍵參數
- 研究方法
- 流式細胞儀效率比較分析
- 綜合效率比較分析
- 各自效率比較分析
- 結論
第10章 市場預測
- 章節概述
- 預測研究方法與關鍵假設
- 2035年流式細胞儀服務市場
- 2035年流式細胞儀服務市場:依主要區域分析
- 結論
第11章 結論
第12章 附錄1:表格資料
第13章 附錄2:公司與組織清單
FLOW CYTOMETRY SERVICES MARKET: OVERVIEW
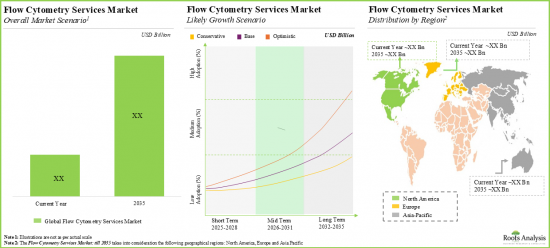
As per Roots Analysis, the global flow cytometry services market valued at USD 2.76 billion in the current year is anticipated to grow at a CAGR of 9.73% during the forecast period, till 2035.
The market sizing and opportunity analysis has been segmented across the following parameters:
Service
- Type of General Flow Cytometric Services
- Assay Development
- Consumables Manufacturing
- Type of Analysis based Flow Cytometric Services
- PBMC Analysis
- Whole Blood Cells Analysis
- Bone Marrow Aspirate Analysis
- Stem Cells Analysis
- Rare Cells Detection
- Cell Profiling and Subsetting
- Intracellular Staining
- Other Type of Flow Cytometric Services
Key Geographical Regions
- North America
- Europe
- Asia Pacific
- Rest of the World
FLOW CYTOMETRY SERVICES MARKET: GROWTH AND TRENDS
Over time, flow cytometry has gained considerable attention as an analytical method in disease diagnosis and drug development. In biology and medicine, flow cytometry is known as a technique which is used to measure various physical and chemical characteristics of cells or particles as they pass through a laser beam when suspended in a fluid. Further, given the various limitations of conventional techniques, such as western blotting and immunohistochemistry, stakeholders are increasingly opting for innovative technologies, such as flow cytometry for clinical purposes. Conventional methods have low specificity and sensitivity, which may produce false results. Notably, flow cytometry techniques have the potential to overcome a number of these challenges.
Additionally, owing to the growing healthcare burden related to cancer and immunological disease conditions, and developments in immunological and biomedical research, the adoption of flow cytometry is expected to increase. This in turn will increase dependency on flow cytometry services providers to optimize process costs, overcome complexities associated with the process and improve process timelines.
FLOW CYTOMETRY SERVICES MARKET: KEY INSIGHTS
The report delves into the current state of the global flow cytometry services market and identifies potential growth opportunities within industry. Some key findings from the report include:
- 30 companies claim to offer various types of flow cytometry services; majority of these offer analysis-based flow cytometric services.
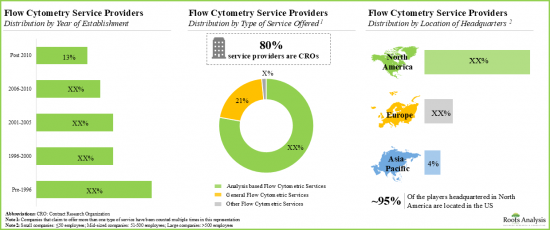
- The current market landscape features the presence of both well-established and new firms offering a wide range of flow cytometry services; a relatively large proportion of the players are based in North America.
- Examples of large flow cytometry services providers established post 2000 include Neo Genomics, Q2 Solutions, Cell Carta and ICON Speciality Labs.
- More than 70% of stakeholders claim to offer analysis-based flow cytometric services, followed by 21% of players offering general flow cytometric services.
- Close to 75% of players who are headquartered in the US are mid-sized players; the majority (around 80%) of these players claim to provide analysis-based flow cytometry services.
- Several players are also engaged in the manufacturing of different types of flow cytometers, including research flow cytometers and clinical flow cytometers for use across multiple application areas.
- More than 50% of the flow cytometers being manufactured are research flow cytometers; examples of players developing such systems include Becton Dickinson and Sysmex Partec.
- A large proportion (60%) of flow cytometers are manufactured using the cell-based technique; however, bead-based flow technique is also being employed by several players.
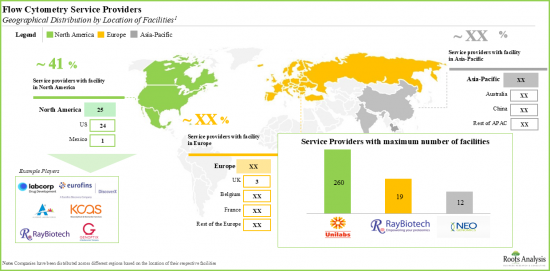
- With more than 100 facilities, flow cytometry service providers offer services across various regions around the world; majority of these facilities are established in emerging geographies.
- North America dominates the flow cytometry manufacturing market; examples of players based in this region include Agilent, Beckman Coulter and Thermofisher Scientific.
- In pursuit of a competitive edge, stakeholders are actively expanding their existing capabilities to enhance their respective offerings and comply with the evolving industry benchmarks.
- Over the past few years, there has been a significant increase in partnership activity in this domain; majority of the instances were related to mergers and acquisitions.
- The market is anticipated to grow at an annualized rate of ~9.73% till 2035; the future opportunity is expected to be well distributed across key geographical regions.
Example Players in the Flow Cytometry Services Market
- FlowMetric Life Sciences
- Flow Contract Sites Laboratory
- Bio-Legend
- Q2 Solutions
- ProImmune
- MLM Medical Labs
- Unilabs
- Firalis
- Agilex Biolabs
FLOW CYTOMETRY SERVICES MARKET: RESEARCH COVERAGE
- Market Sizing and Opportunity Analysis: The report features an in-depth analysis of the flow cytometry services market, focusing on key market segments, including [A] service, [B] number of facilities, [C] key players and [D] key geographical regions.
- Market Landscape: A comprehensive evaluation of the flow cytometry service providers, based on several relevant parameters, such as [A] year of establishment, [B] company size, [C] location of headquarters, [D] location of flow cytometry facilities, [E] type of service(s) offered. Additionally, a comprehensive evaluation of manufacturers and the respective flow cytometry equipment developed / being developed by them.
- Company Competitiveness Analysis: A comprehensive competitive analysis of service providers in the flow cytometry industry, examining factors, such as [A] service strength and [B] supplier strength.
- Company Profiles: In-depth profiles of the companies offering services related to flow cytometry, focusing on [A] overview of the company, [B] financial information (if available), [C] service portfolio, [D] types of services offered, [E] location of flow cytometry facilities and [F] recent developments and an informed future outlook.
- Partnerships and Collaborations: An insightful analysis of the deals inked by stakeholders in the flow cytometry services market, based on several parameters, such as [A] year of partnership, [B] type of partnership, [C] type of partner, [D] type of service offered, [E] most active players (in terms of number of partnerships signed) and [F] geography.
KEY QUESTIONS ANSWERED IN THIS REPORT
- How many companies are currently engaged in this market?
- Which are the leading companies in this market?
- What factors are likely to influence the evolution of this market?
- What is the current and future market size?
- What is the CAGR of this market?
- How is the current and future market opportunity likely to be distributed across key market segments?
REASONS TO BUY THIS REPORT
- The report provides a comprehensive market analysis, offering detailed revenue projections of the overall market and its specific sub-segments. This information is valuable to both established market leaders and emerging entrants.
- Stakeholders can leverage the report to gain a deeper understanding of the competitive dynamics within the market. By analyzing the competitive landscape, businesses can make informed decisions to optimize their market positioning and develop effective go-to-market strategies.
- The report offers stakeholders a comprehensive overview of the market, including key drivers, barriers, opportunities, and challenges. This information empowers stakeholders to stay abreast of market trends and make data-driven decisions to capitalize on growth prospects.
ADDITIONAL BENEFITS
- Complimentary PPT Insights Packs
- Complimentary Excel Data Packs for all Analytical Modules in the Report
- 15% Free Content Customization
- Detailed Report Walkthrough Session with Research Team
- Free Updated report if the report is 6-12 months old or older
TABLE OF CONTENTS
1. PREFACE
- 1.1. Scope of the Report
- 1.2. Research Methodology
- 1.2.1. Research Assumptions
- 1.2.2. Project Methodology
- 1.2.3. Forecast Methodology
- 1.2.4. Robust Quality Control
- 1.2.5. Key Considerations
- 1.2.5.1. Demographics
- 1.2.5.2. Economic Factors
- 1.2.5.3. Government Regulations
- 1.2.5.4. Supply Chain
- 1.2.5.5. COVID Impact / Related Factors
- 1.2.5.6. Market Access
- 1.2.5.7. Healthcare Policies
- 1.2.5.8. Industry Consolidation
- 1.3 Key Questions Answered
- 1.4. Chapter Outlines
2. EXECUTIVE SUMMARY
3. INTRODUCTION
- 3.1. Chapter Overview
- 3.2. Introduction to Flow Cytometry
- 3.3. Flow Cytometry Versus Conventional Analytical Techniques
- 3.4. Difference between Flow Cytometer, Cell Analyzer and Cell Sorter
- 3.5. Flow Cytometry Instrumentation
- 3.5.1. Flow Cytometry: Cell Analyzing and Counting Methodology
- 3.5.2. Flow Cytometry: Software and Automation Support
- 3.6. Flow Cytometry Services
- 3.7. Application of Flow Cytometry
- 3.8. Future Perspectives
4. MARKET LANDSCAPE
- 4.1. Chapter Overview
- 4.2. Flow Cytometry Service Providers: Overall Market Landscape
- 4.2.1. Analysis by Year of Establishment
- 4.2.2. Analysis by Company Size
- 4.2.3. Analysis by Location of Headquarters
- 4.2.4. Analysis by Location of Flow Cytometry Facilities
- 4.2.5. Analysis by Type of Service(s) Offered
- 4.2.6. Analysis by Type of General Flow Cytometric Services Offered
- 4.2.7. Analysis by Type(s) of Analysis-based Flow Cytometric Services Offered
- 4.2.8. Analysis by Flow Cytometry Instrument Providers
5. COMPANY COMPETITIVENESS ANALYSIS
- 5.1. Chapter Overview
- 5.2. Methodology
- 5.3. Key Parameters
- 5.4. Competitiveness Analysis: Flow Cytometry Service Providers
- 5.4.1. Companies offering Flow Cytometry Service Providers in North America
- 5.4.2. Companies offering Flow Cytometry Service Providers in Europe and Asia-Pacific
6. COMPANY PROFILES: FLOW CYTOMETRY SERVICE PROVIDERS IN NORTH AMERICA
- 6.1. Chapter Overview
- 6.2. FlowMetric Life Sciences
- 6.2.1. Company Overview
- 6.2.2. FlowMetric Life Sciences: Flow Cytometry Services Portfolio
- 6.2.3. FlowMetric Life Sciences: Recent Developments and Future Outlook
- 6.3. Flow Contract Sites Laboratory
- 6.3.1. Company Overview
- 6.3.2. Flow Contract Sites Laboratory: Flow Cytometry Services Portfolio
- 6.3.3. Flow Contract Sites Laboratory: Recent Developments and Future Outlook
- 6.4. Bio-Legend
- 6.4.1. Company Overview
- 6.4.2. Bio-Legend: Flow Cytometry Services Portfolio
- 6.4.3. Bio-Legend: Recent Developments and Future Outlook
- 6.5. Q2 Solutions
- 6.5.1. Company Overview
- 6.5.2. Q2 Solutions: Flow Cytometry Services Portfolio
- 6.5.3. Q2 Solutions: Recent Developments and Future Outlook
7. COMPANY PROFILES: FLOW CYTOMETRY SERVICE PROVIDERS IN EUROPE AND ASIA-PACIFIC
- 7.1. Chapter Overview
- 7.2. ProImmune
- 7.2.1. Company Overview
- 7.2.2. ProImmune: Flow Cytometry Services Portfolio
- 7.2.3. ProImmune: Recent Developments and Future Outlook
- 7.3. MLM Medical Labs
- 7.3.1. Company Overview
- 7.3.2. MLM Medical Labs: Flow Cytometry Services Portfolio
- 7.3.3. MLM Medical Labs: Recent Developments and Future Outlook
- 7.4. Unilabs
- 7.4.1. Company Overview
- 7.4.2. Unilabs: Flow Cytometry Services Portfolio
- 7.4.3. Unilabs Recent Developments and Future Outlook
- 7.5. Firalis
- 7.5.1. Company Overview
- 7.5.2. Firalis: Flow Cytometry Services Portfolio
- 7.5.3. Firalis: Recent Developments and Future Outlook
- 7.6. Agilex Biolabs
- 7.6.1. Company Overview
- 7.6.2. Agilex Biolabs: Flow Cytometry Services Portfolio
- 7.6.3. Agilex Biolabs: Recent Developments and Future Outlook
8. PARTNERSHIPS AND COLLABORATIONS
- 8.1. Chapter Overview
- 8.2. Partnership Models
- 8.3. Flow Cytometry Service Providers: Partnerships and Collaborations
- 8.3.1. Analysis by Year of Partnership
- 8.3.2. Analysis by Type of Partnership
- 8.3.3. Analysis by Type of Collaborator
- 8.4. Flow Cytometry Service Providers: Information on Type of Service(s) Offered
- 8.4.1. Analysis by Type of Service(s)
- 8.4.2. Analysis by Type of Partnership and Type of Service(s)
- 8.4.3. Most Active Players: Analysis by Number of Partnerships
- 8.5. Top Partners
- 8.6. Geographical Analysis
- 8.7. Intercontinental and Intracontinental Agreements
9. EFFICIENCY COMPARISON MODULE
- 9.1. Chapter Overview
- 9.2. Key Parameters
- 9.3. Methodology
- 9.4. Flow Cytometry Efficiency Comparison Analysis
- 9.5. Inclusive Efficiency Comparison Analysis
- 9.6. Respective Efficiency Comparison Analysis
- 9.6.1. Flow Cytometry and Immunohistochemistry
- 9.6.2. Flow Cytometry and Cytogenetics Testing
- 9.6.3. Flow Cytometry and Fluorescence Microscopy
- 9.6.4. Flow Cytometry and ELISA
- 9.6.5. Flow Cytometry and Western Blotting
- 9.6.6. Flow Cytometry and Hematology Cell Analyzer
- 9.6.7. Flow Cytometry and Dynabead Method
- 9.7. Concluding Remarks
10. MARKET FORECAST
- 10.1. Chapter Overview
- 10.2. Forecast Methodology and Key Assumptions
- 10.3. Flow Cytometry Services Market, Till 2035
- 10.4. Flow Cytometry Services Market, Till 2035: Analysis by Key Geographical Region
- 10.4.1. Flow Cytometry Services Market in North America, Till 2035
- 10.4.2. Flow Cytometry Services Market in Europe, Till 2035
- 10.4.3. Flow Cytometry Services Market in Asia-Pacific, Till 2035
- 10.5. Conclusion
11. CONCLUDING REMARKS
12. APPENDIX 1: TABULATED DATA
13. APPENDIX 2: LIST OF COMPANIES AND ORGANIZATIONS
List of Tables
- Table 3.1 Difference between Flow Cytometer, Cell Analyzer and Cell Sorter
- Table 4.1 Flow Cytometry Services Providers: List of Companies
- Table 4.2 Flow Cytometry Service Providers: Information on Types of Services Offered
- Table 4.3 List of Flow Cytometers: Information on Instrument Manufacturers,
- Table 6.1 Flow Cytometry Services Providers in North America: List of Companies Profiled
- Table 6.2 FlowMetric Life Sciences: Company Snapshot
- Table 6.3 FlowMetric Life Sciences: Flow Cytometry Services Portfolio
- Table 6.4 FlowMetric Life Sciences: Recent Developments and Future Outlook
- Table 6.5 Flow Contract Site Laboratory: Company Snapshot
Table 6.6: Flow Contract Site Laboratory: Flow Cytometry Services Portfolio
- Table 6.7 Flow Contract Site Laboratories: Recent Developments and Future Outlook
- Table 6.8 Bio-Legend: Company Snapshot
- Table 6.9 Bio-Legend: Flow Cytometry Services Portfolio
- Table 6.10 Bio-Legend: Recent Developments and Future Outlook
- Table 6.11 Q2 Solutions: Company Snapshot
- Table 6.12 Q2 Solutions: Flow Cytometry Services Portfolio
- Table 7.1 Flow Cytometry Service Providers in Europe: List of Companies Profiled
- Table 7.2 ProImmune: Company Snapshot
- Table 7.3 ProImmune: Flow Cytometry Services Portfolio
- Table 7.4 ProImmune: Recent Developments and Future Outlook
- Table 7.5 MLM Medical Labs: Company Snapshot
- Table 7.6 MLM Medical Labs: Flow Cytometry Services Portfolio
- Table 7.7 MLM Medical Labs: Recent Developments and Future Outlook
- Table 7.8 Unilabs (Serving Pharma Facility): Company Snapshot
- Table 7.9 Unilabs: Flow Cytometry Services Portfolio
- Table 7.10 Unilabs: Recent Developments and Future Outlook
- Table 7.11 Firalis: Company Snapshot
- Table 7.12 Firalis: Flow Cytometry Services Portfolio
- Table 7.13 Firalis: Recent Developments and Future Outlook
- Table 7.14 Agilex Biolabs: Company Snapshot
- Table 7.15 Agilex Biolabs: Flow Cytometry Services Portfolio
- Table 7.16 Agilex Biolabs: Recent Developments and Future Outlook
- Table 8.1 Flow Cytometry Services Market: List of Partnerships
- Table 8.2 Partnerships and Collaborations: Information on the Type of Service(s)'
- Table 12.1 Flow Cytometry Service Providers: Distribution by Year of Establishment
- Table 12.2 Flow Cytometry Service Providers: Geographical Distribution by Company Size
- Table 12.3 Flow Cytometry Service Providers: Distribution by Location of Headquarters
- Table 12.4 Flow Cytometry Service Providers: Distribution by Location of Flow Cytometry Facilities
- Table 12.5 Flow Cytometry Service Providers: Distribution by Type of Service(s) Offered
- Table 12.6 Flow Cytometry Manufacturers: Distribution by Number of Instrument offered
- Table 12.7 Partnerships and Collaborations: Cumulative Year-wise Trend, Since 2010
- Table 12.8 Partnerships and Collaborations: Distribution by Type of Partnership
- Table 12.9 Partnerships and Collaborations: Distribution by Year and Type of Partnership
- Table 12.10 Partnerships and Collaborations: Distribution by Type of Partner
- Table 12.11 Partnerships and Collaborations: Distribution by Type of Service(s) Offered
- Table 12.12 Partnerships and Collaborations: Distribution by Type of Services and Type of Partnership
- Table 12.13 Most Active Players: Distribution by Number of Partnerships
- Table 12.14 Top Partners: Distribution by Number of Partnerships
- Table 12.15 Partnerships and Collaborations: Distribution by Geography
- Table 12.16 Partnerships and Collaborations: Distribution by Intercontinental and Intracontinental Agreements
- Table 12.17 Flow Cytometry Services Market, Conservative, Base and Optimistic Scenarios (USD Billion)
- Table 12.19 Flow Cytometry Services Market in North America, Conservative, Base and Optimistic Scenarios, Till 2035 (USD Billion)
- Table 12.20 Flow Cytometry Services Market in Europe, Conservative, Base and Optimistic Scenarios, Till 2035 (USD Billion)
- Table 12.21 Flow Cytometry Services Market in Asia-Pacific, Conservative, Base and Optimistic Scenarios, Till 2035 (USD Billion)
List of Figures
- Figure 2.1 Executive Summary: Market Landscape
- Figure 2.2 Executive Summary: Manufacturer's Landscape
- Figure 2.3 Executive Summary: Partnerships and Collaborations
- Figure 2.4 Executive Summary: Market Forecast
- Figure 3.1 Working Mechanism of Flow Cytometry
- Figure 3.2 Flow Cytometry Services
- Figure 4.1 Flow Cytometry Service Providers: Distribution by Year of Establishment
- Figure 4.2 Flow Cytometry Service Providers: Distribution by Company Size
- Figure 4.3 Flow Cytometry Service Providers: Distribution by Location of Headquarters
- Figure 4.4 Flow Cytometry Service Providers: Distribution by Location of Flow Cytometry Facilities
- Figure 4.5 Flow Cytometry Service Providers: Distribution by Type of Service(s) Offered
- Figure 4.6 Flow Cytometry Services Providers: Distribution by Type of General Flow Cytometry Service Offered
- Figure 4.7 Flow Cytometry Service Providers: Distribution by Type of Analysis-based Flow Cytometry Service(s) Offered
- Figure 4.8 Flow Cytometry Instruments: Distribution by Instrument Provider
- Figure 5.1 Company Competitiveness Analysis: Flow Cytometry Service Providers in North America
- Figure 5.2 Company Competitiveness Analysis: Flow Cytometry Service Providers in Europe and Asia-Pacific
- Figure 8.1 Partnerships and Collaborations: Cumulative Year-wise Trend, Since 2010
- Figure 8.2 Partnerships and Collaborations: Distribution by Type of Partnership, Since 2010
- Figure 8.3 Partnerships and Collaborations: Distribution by Year and Type of Partnership, Since 2010
- Figure 8.4 Partnerships and Collaborations: Distribution by the Type of Collaborator, Since 2010
- Figure 8.5 Partnerships and Collaborations: Distribution by Type of Service(s)
- Figure 8.6 Partnerships and Collaborations: Distribution by Type of Partnership and Type of Service(s)
- Figure 8.7 Most Active Players: Distribution by Number of Partnerships
- Figure 8.8 Top Partners: Distribution by Number of partnerships
- Figure 8.9 Partnership and Collaboration: Geographical Analysis
- Figure 8.10 Partnerships and Collaborations: Intercontinental and Intracontinental Agreements
- Figure 9.1 Inclusive Efficiency Comparison Analysis: Flow Cytometry with other Diagnostics Techniques
- Figure 9.2 Efficiency Comparison Analysis: Flow Cytometry and Immunohistochemistry
- Figure 9.3 Efficiency Comparison Analysis: Flow Cytometry and Cytogenetics Testing
- Figure 9.4 Efficiency Comparison Analysis: Flow Cytometry and Fluorescence Microscopy
- Figure 9.5 Individual Efficiency Comparison Analysis: Flow Cytometry and ELISA
- Figure 9.6 Efficiency Comparison Analysis: Flow Cytometry and Western Blotting
- Figure 9.7 Efficiency Comparison Analysis: Flow Cytometry and Hematology Cell Analyzer
- Figure 9.8 Efficiency Comparison Analysis: Flow Cytometry and Dynabead Method
- Figure 10.1 Flow Cytometry Services Market, Till 2035 (USD Billion)
- Figure 10.2 Flow Cytometry Services Market: Distribution by Key Geographical Regions (USD Million)
- Figure 10.3 Flow Cytometry Services Market in North America, Till 2035 (USD Billion)
- Figure 10.4 Flow Cytometry Services Market in Europe, Till 2035 (USD Billion)
- Figure 10.5 Flow Cytometry Services Market in Asia-Pacific, Till 2035 (USD Billion)
- Figure 10.6 Flow Cytometry Services Market: Conservative, Base and Optimistic Scenarios (USD Billion)
- Figure 11.1 Concluding Remarks: Current Market Landscape of Flow Cytometry Service Providers
- Figure 11.2 Concluding Remarks: Flow Cytometer Manufacturers
- Figure 11.3 Concluding Remarks: Partnerships and Collaborations
- Figure 11.4 Concluding Remarks: Market Forecast Analysis
 細胞計數市場分析及預測(至2035年):按類型、產品類型、服務、技術、應用、最終用戶、組件、模式和功能分類
 流式細胞技術市場-2026-2031年預測
 超高速流式細胞技術選儀市場:按技術、產品類型、應用和最終用戶分類 - 全球預測(2026-2032 年)
 2025年流式細胞技術全球市場報告2025年腫瘤學和免疫學領域全球流式細胞技術市場報告流式細胞技術市場(按產品類型、技術、應用領域和最終用戶)—2025-2030 年全球預測
 歐洲流式細胞技術市場:分析與預測(2025-2035)
 全球流式細胞技術市場(按產品、技術、應用、最終用戶和地區分類)- 預測至 2033 年
 2025 年至 2033 年流式細胞儀市場報告(按產品和服務、技術、應用、最終用戶和地區分類)
 亞太流式細胞技術市場:分析與預測(2025-2035)