


 |
市場調查報告書
商品編碼
1771307
自動無菌取樣市場:產業趨勢與全球預測 - 依監測方法、生物製程方法、工作量、擴展性、主要區域Automatic Aseptic Sampling Market: Industry Trends and Global Forecasts - Distribution by Type of Monitoring Method, Bioprocessing Method, Working Volume, Scalability and Key Geographical Regions |
||||||
全球自動無菌取樣市場:概覽
預計2035年,全球自動無菌取樣市場規模將從目前的1.57億美元成長至9.13億美元,預測期間內年複合成長率為19.3%。
市場規模與機會分析依下列參數細分:
監測方法
- Online
- Off-line
- At-line
生物製程方法
- 上游
- 下游
工作量
- 小於10毫升
- 10-50毫升
- 51-100毫升
- 100毫升以上
可擴充
- 實驗室規模
- 中試規模
- 商業規模
主要地區
- 北美
- 歐洲
- 亞太地區
- 世界其他地區
全球自動無菌取樣市場:成長與趨勢
準確取樣是製藥生產中最重要的流程之一。傳統的取樣方法和手動取樣技術存在污染風險,並可能導致樣品製備和取樣過程中操作員之間的偏差。此外,管理即時資料對於參與操作的工作人員來說是一項艱鉅的挑戰。因此,對能夠實現準確處理和無菌取樣的取樣系統的需求日益成長。在此背景下,自動無菌取樣系統應運而生,成為實現精準取樣、最大限度減少誤差和即時資料監控的理想解決方案。
值得注意的是,引進自動無菌取樣系統有助於減少約65%的偏差,並將整體生產率提高高達80%。此外,由於自動取樣系統的重要性,許多製藥公司已開始採用這些系統,以實現無縫且無錯誤的取樣作業。因此,由於自動無菌取樣系統的廣泛應用,預計在預測期內,其市場將實現成長。
全球自動無菌取樣市場:關鍵洞察
本研究報告探討了全球自動無菌取樣市場的現狀,並揭示了該行業的潛在成長機會。報告的主要調查結果包括:
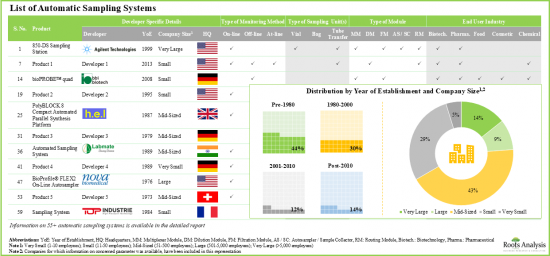
- 目前,全球市場上有超過 55 種自動取樣系統,其中中型企業佔比相對較大。
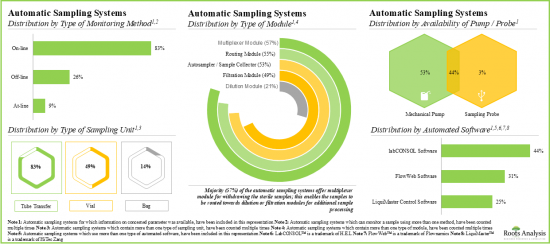
- 大多數自動取樣系統(83%)都支援線上即時監控和連續製程控制,製藥和生物技術公司已成為這些系統最主要的終端用戶。
- 超過 80%的自動樣品採集/製備系統製造商成立於2000年之前,其中大多數位於北美。
- 為了打造競爭優勢,該行業的利益相關者努力豐富其產品組合,並透過先進的功能升級其自動取樣系統。
- 各利害關係人已申請/授予 400 多項與生物製藥產業自動取樣相關的專利,以保護該領域產生的智慧財產權。
- 自2018年以來,該領域的專利申請數量以 40%的年複合成長率成長,其中近 30%是在過去 12個月內提交的。
- 利害關係人日益成長的興趣也體現在針對自動取樣系統舉辦的活動中,這些活動為產品開發人員提供了交流想法和更佳了解此類系統的機會。
- 超過 35%的合作夥伴關係是為了產品分銷而簽署的,其中北美利益相關者簽署的與自動取樣相關的協議數量最多。
- 生物製藥產業日益採用自動取樣系統,預計將為系統製造商創造豐厚的利潤。
- 鑑於需要能夠將生物製程樣品直接從生物反應器轉移到分析儀,同時保持製程無菌的系統,預計自動取樣的採用率將大幅增加。
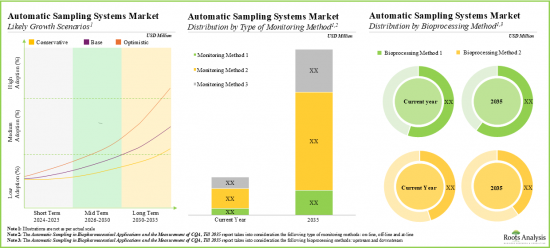
- 到2035年,該市場的年複合成長率可能超過19.3%。這一機會很可能分佈在各個地區和其他關鍵細分市場。
全球自動無菌取樣市場:關鍵細分市場
依監測方法,市場分為Online、Off-line、At-line。目前,Online上市場佔全球自動無菌取樣市場的大部分佔有率(約60%)。此外,預計Online市場的成長速度將高於其他細分市場。
依工作量劃分,市場分為小於10毫升、10-50毫升、51-100毫升和大於100毫升。目前,10-50毫升市場佔全球自動無菌取樣市場的比例最高(約40%)。值得注意的是,51-100毫升市場的自動無菌取樣市場很可能以相對較高的年複合成長率成長。
依生物製程方法劃分,市場分為上游和下游。目前,上游市場佔自動無菌取樣市場的最大佔有率(約60%)。該市場也可能以相對較高的年複合成長率成長。
依擴展類型劃分,市場分為實驗室規模、中試規模及商業規模。目前,實驗室規模市場佔自動無菌取樣市場的比例最高(約50%)。值得注意的是,中試規模的自動無菌取樣市場可望維持相對較高的年複合成長率。
依主要地區劃分,市場分為北美、歐洲、亞太地區及世界其他地區。目前,北美(約55%)在自動無菌取樣市場佔據主導地位,佔據最大的收入佔有率。然而,預計亞太地區的市場將以更高的年複合成長率成長。
自動無菌取樣市場參與者
- Agilent Technologies
- Biotage
- Cytiva
- Flownamics
- MGI Tech
- Mettler Toledo
- Pall Corporation
- Shimadzu
- SOTAX
本報告調查全球自動無菌取樣市場,提供市場概述,以及依監測方法、生物加工方法、工作量、擴張趨勢、區域的趨勢,和參與市場的公司簡介。
目錄
第1章 簡介
第2章 執行摘要
第3章 簡介
- 章節概述
- 取樣中的製程分析技術
- 手動取樣與自動取樣
- 自動取樣系統的需求
- 自動無菌取樣系統
- 取樣系統的組件
- 獨立系統與整合系統
- 如何監控與控制生物過程
- 自動取樣的關鍵考慮因素
- 自動取樣系統的優勢
- 標準和要求
- 未來創新
第4章 市場模式:自動化取樣系統
- 章節概述
- 自動取樣系統:市場格局
- 自動取樣系統製造商列表
第5章 公司競爭力分析
- 章節概述
- 假設/關鍵參數
- 研究範圍與方法
- 公司競爭力分析:北美自動取樣系統製造商
- 公司競爭力分析:歐洲自動取樣系統製造商
- 公司競爭力分析:亞太地區自動取樣系統製造商
第6章 自動取樣系統製造商公司簡介
- 章節概述
- Agilent Technologies
- Cytiva
- Mettler Toledo
- Pall Corporation
- Shimadzu
- Xylem
第7章 自動化樣品採集與製備系統市場現況
- 章節概述
- 自動化樣品採集與製備系統:市場現況
- 自動化樣品採集和製備系統製造商列表
第8章 公司簡介 自動化樣品採集與製備系統製造商
- 章節概述
- Agilent Technologies
- Biotage
- Flownamics
- MGI Tech
- SOTAX
第9章 專利分析
- 章節概述
- 範圍與研究方法論
- 生物製藥中的自動取樣和 CQA 測量:專利分析
- 生物製藥中的自動取樣和 CQA 測量:專利基準分析
- 生物製藥中的自動取樣和 CQA 測量:專利評估分析
- 高引用專利
第10章 最新進展
- 章節概述
- 生物製藥中的自動取樣和 CQA 測量:合作活動
- 生物製藥中的自動取樣和 CQA 測量:全球事件
- 結論
第11章 SWOT 分析
第12章 波特五力分析
- 章節概述
- 研究方法與假設
- 關鍵參數
- 結論
第13章 市場預測與機會分析
- 章節概述
- 關鍵假設與研究方法
- 2035年全球生物製藥自動取樣及CQA測量市場
- 生物製藥自動取樣及CQA測量市場:依監測方法
- 生物製藥自動取樣及CQA測量市場:依生物製程方法
- 生物製藥自動取樣與CQA測量市場:依工作量
- 生物製藥自動取樣和CQA測量市場:依擴展性
- 生物製藥自動取樣和CQA測量市場:依主要地區
第14章 工業革命:從工業 1.0 到工業 5.0
- 章節概述
- 從工業 1.0 到工業 5.0 的轉型
- 實驗室演進的前景
- 工業 4.0 的優勢
- 工業 5.0 的優勢
- 結論
第15章 結論
第16章 高層洞察
第17章 附錄1:表格資料
第18章 附錄2:公司與組織清單
GLOBAL AUTOMATIC ASEPTIC SAMPLING MARKET: OVERVIEW
As per Roots Analysis, the global automatic aseptic sampling market is estimated to grow from USD 157 million in the current year to USD 913 million by 2035, at a CAGR of 19.3% during the forecast period, till 2035.
The market sizing and opportunity analysis has been segmented across the following parameters:
Type of Monitoring Method
- Online
- Off-line
- At-line
Bioprocessing Method
- Upstream
- Downstream
Working Volume
- Less than 10 ml
- 10-50 ml
- 51-100 ml
- More than 100 ml
Scalability
- Lab Scale
- Pilot Scale
- Commercial Scale
Key Geographical Regions
- North America
- Europe
- Asia-Pacific
- Rest of the World
GLOBAL AUTOMATIC ASEPTIC SAMPLING MARKET: GROWTH AND TRENDS
Accurate sampling is one of the most crucial processes during the production of pharmaceutical products. The conventional sampling approach or manual sampling techniques pose a risk of contamination and may result in operator-to-operator deviations during sample preparation and sampling. Furthermore, managing real-time data can be challenging for the labor enrolled in operational processes. Consequently, there is an increasing demand for sampling systems that allow accurate handling and aseptic sampling. In this context, an automatic aseptic sampling system emerges as an ideal solution for accurate sampling, minimizing errors, and real-time data monitoring.
Notably, the implementation of automated aseptic sampling systems helps to reduce deviation by around 65% and improve overall productivity by up to 80%. Further, owing to the significance offered by automated sampling systems, several pharmaceutical companies have begun to adopt these systems for seamless, error-free sampling operations. As a result, the automated aseptic sampling market is anticipated to grow during the forecast period driven by its wide-scale adoption.
GLOBAL AUTOMATIC ASEPTIC SAMPLING MARKET: KEY INSIGHTS
The report delves into the current state of global automatic aseptic sampling market and identifies potential growth opportunities within industry. Some key findings from the report include:
- Presently, more than 55 automatic sampling systems are commercially available in different regions of the globe; a relatively larger proportion of these players are mid-sized companies.
- Majority of the automatic sampling systems (83%) allow on-line real-time monitoring and continuous process control; pharma and biotech companies have emerged as the most prominent end users of these systems.
- More than 80% of the automatic sample collection / preparation system manufacturers were established before 2000; majority of them are based in North America.
- In pursuit of building a competitive edge, stakeholders in this domain are striving to enhance their product portfolio and upgrade their automatic sampling systems with advanced features.
- Over 400 patents related to automatic sampling in biopharmaceutical industry have been filed / granted by various stakeholders in order to protect the intellectual property generated within this field.
- The number of patents filed in this domain has increased at a CAGR of 40% since 2018; close to 30% of the patents have been filed in the last 12 months.
- The growing interest of stakeholders is also reflected by the events organized for automatic sampling systems, providing product developers with the opportunity to share their ideas and develop a better understanding of such systems.
- Over 35% of the partnerships were signed for product distribution purposes; stakeholders based in North America have signed maximum agreements related to automatic sampling.
- The increasing adoption of automatic sampling systems in the biopharmaceutical industry is anticipated to create profitable business opportunities for the system manufacturers.
- Given the requirement of systems that can transfer bioprocess samples directly from bioreactors to analyzers while maintaining the process sterility, the adoption of automatic sampling is anticipated to rise significantly.
- The market is likely to grow at an annualized rate of more than 19.3% by 2035; the opportunity is likely to be well distributed across different geographies, and other important market segments.
GLOBAL AUTOMATIC ASEPTIC SAMPLING MARKET: KEY SEGMENTS
The Online Segment Occupies the Largest Share of the Automatic Aseptic Sampling Market
Based on type of monitoring method, the market is segmented into online, off-line and at-line. At present, the online segment holds the majority share (~60%) of the global automatic aseptic sampling market. Additionally, the at-line segment is likely to grow at a faster pace compared to the other segments.
By Working Volume, 51-100 ml is the Fastest Growing Segment of the Global Automatic Aseptic Sampling Market
Based on the working volume, the market is segmented into less than 10 ml, 10-50 ml, 51-100 ml, and more than 100 ml. Currently, the 10-50 ml segment captures the highest proportion (~40%) of the global automatic aseptic sampling market. It is worth highlighting that the automatic aseptic sampling market for 51-100 ml segment is likely to grow at a relatively higher CAGR.
Upstream Segment Occupy the Largest Share of the Automatic Aseptic Sampling Market
Based on the bioprocessing method, the market is segmented into upstream and downstream. At present, the upstream segment holds the maximum share (~60%) of the automatic aseptic sampling market. In addition, this segment is likely to grow at a relatively higher CAGR.
By Scalability, the Pilot Scale Segment is the Fastest Growing Segment of the Automatic Aseptic Sampling Market During the Forecast Period
Based on the scalability, the market is segmented into lab scale, pilot scale, and commercial scale. Currently, lab scale segment captures the highest proportion (~50%) of the automatic aseptic sampling market. Further, it is worth highlighting that the automatic aseptic sampling market for pilot scale is likely to grow at a relatively higher CAGR.
North America Accounts for the Largest Share of the Market
Based on key geographical regions, the market is segmented into North America, Europe, Asia-Pacific and Rest of the World. Currently, North America (~55%) dominates the automatic aseptic sampling market and accounts for the largest revenue share. However, the market in Asia-Pacific is expected to grow at a higher CAGR.
Example Players in the Automatic Aseptic Sampling Market
- Agilent Technologies
- Biotage
- Cytiva
- Flownamics
- MGI Tech
- Mettler Toledo
- Pall Corporation
- Shimadzu
- SOTAX
GLOBAL AUTOMATIC ASEPTIC SAMPLING MARKET: RESEARCH COVERAGE
- Market Sizing and Opportunity Analysis: The report features an in-depth analysis of the global automated liquid handling systems market, focusing on key market segments, including [A] type of monitoring method, [B] bioprocessing method, [C] working volume, [D] scalability and [E] key geographical regions.
- Automatic Sampling Systems Market Landscape: A comprehensive evaluation of automatic sampling systems, considering various parameters, such as [A] type of monitoring method, [B] type of sampling unit(s), [C] availability of pump / probe, [D] type of module, [E] automated software, [F] type of vessel, [G] vessel fabrication material, [H] type of analyte monitored, [I] type of analyzer, [J] number of sampling vessels, [K] working volume, [L] operating temperature, [M] end-user industry, [N] scalability and [O] applications of the system. Additionally, the module presents comprehensive analysis of automatic sampling system developers, based on [A] year of establishment, [B] company size, [C] location of headquarters and [D] leading players (in terms of number of systems being offered).
- Automatic Sampling System Manufacturers Competitiveness Analysis: A comprehensive competitive analysis of automatic sampling systems manufacturers, examining factors, such as [A] overall experience of the company, [B] product portfolio strength and [C] portfolio diversity.
- Automatic Sampling System Company Profiles: In-depth profiles of companies engaged in the automatic aseptic sampling market, focusing on [A] company overviews, [B] financial information (if available), [C] product portfolio and [D] recent developments and an informed future outlook.
- Automatic Sample Collection / Preparation System Manufacturers Market Landscape: A comprehensive evaluation of automatic sample collection / preparation systems, considering various parameters, such as [A] system category, [B] system classification, [C] type of monitoring method, [D] type of sampling unit, [E] type of module, [F] working volume, [G] type of analyzer, [H] end-user industry and [I] scalability of the products. Additionally, a comprehensive analysis of players engaged in developing automatic sample collection / preparation systems, based on [A] year of establishment, [B] company size and [C] location of headquarters.
- Automatic Sample Collection / Preparation System Company Profiles: In-depth profiles of companies offering automatic sample collection / preparation systems, focusing on [A] company overviews, [B] product portfolio and [C] recent developments and an informed future outlook.
- Patent Analysis: An in-depth analysis of patents filed / granted till date in the automatic sampling systems domain, based on various relevant parameters, such as [A] type of patent, [B] publication year, [C] geographical location, [D] CPC symbols, [E] emerging focus areas, [F] type of organization, [G] leading players (in terms of number of patents granted / filed in the given time period), [H] patent characteristics, [I] patent benchmarking and [J] patent valuation.
- Recent Developments: An in-depth analysis of various developments / recent trends related to automatic sampling systems, providing insights on recent global events related to automatic sampling systems and partnerships and collaborations established within the domain.
- SWOT Analysis: An analysis of industry affiliated trends, opportunities and challenges, which are likely to impact the evolution of automatic sampling systems market; it includes a Harvey ball analysis, assessing the relative impact of each SWOT parameter on industry dynamics.
- PORTER'S Five Forces Analysis: A detailed analysis of the five competitive forces prevalent in automatic sampling systems market, including [A] threats of new entrants, [B] bargaining power of customers, [C] bargaining power of automatic sampling system manufacturers, [C] threats of substitute products and [D] rivalry among existing competitors.
KEY QUESTIONS ANSWERED IN THIS REPORT
- How many companies are currently engaged in this market?
- Which are the leading companies in this market?
- What factors are likely to influence the evolution of this market?
- What is the current and future market size?
- What is the CAGR of this market?
- How is the current and future market opportunity likely to be distributed across key market segments?
REASONS TO BUY THIS REPORT
- The report provides a comprehensive market analysis, offering detailed revenue projections of the overall market and its specific sub-segments. This information is valuable to both established market leaders and emerging entrants.
- Stakeholders can leverage the report to gain a deeper understanding of the competitive dynamics within the market. By analyzing the competitive landscape, businesses can make informed decisions to optimize their market positioning and develop effective go-to-market strategies.
- The report offers stakeholders a comprehensive overview of the market, including key drivers, barriers, opportunities, and challenges. This information empowers stakeholders to stay abreast of market trends and make data-driven decisions to capitalize on growth prospects.
ADDITIONAL BENEFITS
- Complimentary PPT Insights Packs
- Complimentary Excel Data Packs for all Analytical Modules in the Report
- 15% Free Content Customization
- Detailed Report Walkthrough Session with Research Team
- Free Updated report if the report is 6-12 months old or older
TABLE OF CONTENTS
1. PREFACE
- 1.1. Scope of the Report
- 1.2. Research Methodology
- 1.2.1. Research Assumptions
- 1.2.2. Project Methodology
- 1.2.3. Forecast Methodology
- 1.2.4. Robust Quality Control
- 1.2.5. Key Considerations
- 1.2.5.1. Demographics
- 1.2.5.2. Economic Factors
- 1.2.5.3. Government Regulations
- 1.2.5.4. Supply Chain
- 1.2.5.5. COVID Impact / Related Factors
- 1.2.5.6. Market Access
- 1.2.5.7. Healthcare Policies
- 1.2.5.8. Industry Consolidation
- 1.3 Key Questions Answered
- 1.4. Chapter Outlines
2. EXECUTIVE SUMMARY
3. INTRODUCTION
- 3.1. Chapter Overview
- 3.2. Process Analytical Technology in Sampling
- 3.3. Manual Sampling versus Automatic Sampling
- 3.4. Need for Automatic Sampling Systems
- 3.5. Automatic Aseptic Sampling System
- 3.6. Components of a Sampling System
- 3.7. Stand-alone Systems versus Integrated Systems
- 3.8. Bioprocess Monitoring and Control Methods
- 3.8.1. At-line Monitoring
- 3.8.2. In-line Monitoring
- 3.8.3. Off-line Monitoring
- 3.8.4. On-line Monitoring
- 3.9. Key Considerations for Automatic Sampling
- 3.9.1. Sample Volume
- 3.9.2. Cell Removal
- 3.9.3. Sampling Rate
- 3.9.4. Integration of Analyzers
- 3.9.5. Feedback to Bioreactor
- 3.9.6. Flexibility
- 3.9.7. Transferability
- 3.9.8. Price
- 3.10. Benefits of Automatic Sampling Systems
- 3.11. Standards and Requirements
- 3.12. Future Innovations
4. MARKET LANDSCAPE: AUTOMATIC SAMPLING SYSTEMS
- 4.1. Chapter Overview
- 4.2. Automatic Sampling Systems: Overall Market Landscape
- 4.2.1. Analysis by Type of Monitoring Method
- 4.2.2. Analysis by Type of Sampling Unit
- 4.2.3. Analysis by Availability of Pump / Probe
- 4.2.4. Analysis by Type of Module
- 4.2.5. Analysis by Automated Software
- 4.2.6. Analysis by Type of Vessel
- 4.2.7. Analysis by Vessel Fabrication Material
- 4.2.8. Analysis by Type of Analyte Monitored
- 4.2.9. Analysis by Type of Analyzer
- 4.2.10. Analysis by Number of Sampling Vessels
- 4.2.11. Analysis by Working Volume
- 4.2.12. Analysis by Operating Temperature
- 4.2.13. Analysis by End User Industry
- 4.2.14. Analysis by Scalability
- 4.2.15. Analysis by Application(s)
- 4.3. List of Automatic Sampling System Manufacturers
- 4.3.1. Analysis by Year of Establishment
- 4.3.2. Analysis by Company Size
- 4.3.3. Analysis by Region of Headquarters
- 4.3.4. Analysis by Company Size and Region of Headquarters
- 4.3.5. Analysis by Location of Headquarters
- 4.3.6. Leading Players: Analysis by Number of Automatic Sampling Systems Manufactured
- 4.3.7. Leading Automatic Sampling System Manufacturers: Analysis by Number of End User Industries
5. COMPANY COMPETITIVENESS ANALYSIS
- 5.1. Chapter Overview
- 5.2. Assumptions / Key Parameters
- 5.3. Scope and Methodology
- 5.4. Company Competitiveness Analysis: Automatic Sampling System Manufacturers in North America
- 5.5. Company Competitiveness Analysis: Automatic Sampling System Manufacturers in Europe
- 5.6. Company Competitiveness Analysis: Automatic Sampling System Manufacturers in Asia-Pacific
6. COMPANY PROFILES: AUTOMATIC SAMPLING SYSTEM MANUFACTURERS
- 6.1. Chapter Overview
- 6.2. Agilent Technologies
- 6.2.1. Company Overview
- 6.2.2. Financial Information
- 6.2.3. Product Portfolio
- 6.2.4. Recent Developments and Future Outlook
- 6.3. Cytiva
- 6.3.1. Company Overview
- 6.3.2. Product Portfolio
- 6.3.3. Recent Developments and Future Outlook
- 6.4. Mettler Toledo
- 6.4.1. Company Overview
- 6.4.2. Financial Information
- 6.4.3. Product Portfolio
- 6.4.4. Recent Developments and Future Outlook
- 6.5. Pall Corporation
- 6.5.1. Company Overview
- 6.5.2. Product Portfolio
- 6.5.3. Recent Developments and Future Outlook
- 6.6. Shimadzu
- 6.6.1. Company Overview
- 6.6.2. Financial Information
- 6.6.3. Product Portfolio
- 6.6.4. Recent Developments and Future Outlook
- 6.7. Xylem
- 6.7.1. Company Overview
- 6.7.2. Financial Information
- 6.7.3. Product Portfolio
- 6.7.4. Recent Developments and Future Outlook
7. MARKET LANDSCAPE: AUTOMATIC SAMPLE COLLECTION / PREPARATION SYSTEMS
- 7.1. Chapter Overview
- 7.2. Automatic Sample Collection / Preparation Systems: Overall Market Landscape
- 7.2.1. Analysis by System Category
- 7.2.2. Analysis by System Classification
- 7.2.3. Analysis by Type of Monitoring Method
- 7.2.4. Analysis by Type of Sampling Unit
- 7.2.5. Analysis by Type of Module
- 7.2.6. Analysis by Working Volume
- 7.2.7. Analysis by Type of Analyzer
- 7.2.8. Analysis by End User Industry
- 7.2.9. Analysis by Scalability
- 7.3. List of Automatic Sample Collection / Preparation System Manufacturers
- 7.3.1. Analysis by Year of Establishment
- 7.3.2. Analysis by Company Size
- 7.3.3. Analysis by Region of Headquarters
- 7.3.4. Analysis by Company Size and Region of Headquarters
- 7.3.5. Analysis by Location of Headquarters
- 7.3.6. Leading Players: Analysis by Number of Automatic Sample Collection / Preparation Systems Manufactured
8. COMPANY PROFILES: AUTOMATIC SAMPLE COLLECTION / PREPARATION SYSTEM MANUFACTURERS
- 8.1. Chapter Overview
- 8.2. Agilent Technologies
- 8.2.1. Company Overview
- 8.2.2. Product Portfolio
- 8.2.3. Recent Developments and Future Outlook
- 8.3. Biotage
- 8.3.1. Company Overview
- 8.3.2. Product Portfolio
- 8.3.3. Recent Developments and Future Outlook
- 8.4. Flownamics
- 8.4.1. Company Overview
- 8.4.2. Product Portfolio
- 8.4.3. Recent Developments and Future Outlook
- 8.5. MGI Tech
- 8.5.1. Company Overview
- 8.5.2. Product Portfolio
- 8.5.3. Recent Developments and Future Outlook
- 8.6. SOTAX
- 8.6.1. Company Overview
- 8.6.2. Product Portfolio
- 8.6.3. Recent Developments and Future Outlook
9. PATENT ANALYSIS
- 9.1. Chapter Overview
- 9.2. Scope and Methodology
- 9.3. Automatic Sampling in Biopharmaceutical Applications and the Measurement of CQA: Patent Analysis
- 9.3.1. Analysis by Publication Year
- 9.3.2. Analysis by Annual Number of Granted Patents and Patent Applications
- 9.3.3. Analysis by Geographical Location
- 9.3.4. Analysis by CPC Symbols
- 9.3.5. Word Cloud: Emerging Focus Areas
- 9.3.6. Analysis by Type of Organization
- 9.3.7. Leading Industry Players: Analysis by Number of Patents
- 9.3.8. Leading Non-Industry Players: Analysis by Number of Patents
- 9.3.9. Leading Individual Assignees: Analysis by Number of Patents
- 9.4. Automatic Sampling in Biopharmaceutical Applications and the Measurement of CQA: Patent Benchmarking Analysis
- 9.4.1. Analysis by Patent Characteristics
- 9.5. Automatic Sampling in Biopharmaceutical Applications and the Measurement of CQA: Patent Valuation Analysis
- 9.6. Leading Patents by Number of Citations
10. RECENT DEVELOPMENTS
- 10.1. Chapter Overview
- 10.2. Automatic Sampling in Biopharmaceutical Applications and the Measurement of CQA: Partnership Activity
- 10.2.1. Partnership Models
- 10.2.2. List of Partnerships and Collaborations
- 10.2.2.1. Analysis by Year of Partnership
- 10.2.2.2. Analysis by Type of Partnership
- 10.2.2.3. Analysis by Type of Product
- 10.2.2.4. Analysis by Product and Type of Partnership
- 10.2.2.5. Most Active Players: Analysis by Number of Partnerships
- 10.2.2.6. Word Cloud: Emerging Focus Areas
- 10.2.2.7. Regional Analysis
- 10.2.2.8. Intercontinental and Intracontinental Agreements
- 10.3. Automatic Sampling in Biopharmaceutical Applications and the Measurement of CQA: Global Events
- 10.3.1. List of Global Events
- 10.3.1.1. Analysis by Year of Event
- 10.3.1.2. Analysis by Event Platform
- 10.3.1.3. Analysis by Type of Event
- 10.3.1.4. Analysis by Geography
- 10.3.1.5. Word Cloud: Evolutionary Trends in Event Agenda / Key Focus Area
- 10.3.1.6. Most Active Participants: Analysis by Number of Events
- 10.3.1.7. Analysis by Seniority Level of Event Speakers
- 10.3.1. List of Global Events
- 10.4. Concluding Remarks
11. SWOT ANALYSIS
- 11.1. Chapter Overview
- 11.2. Automatic Sampling in Biopharmaceutical Applications and the Measurement of CQA: SWOT Analysis
- 11.2.1. Comparison of SWOT Factors
12. PORTERS FIVE FORCES ANALYSIS
- 12.1. Chapter Overview
- 12.2. Methodology and Assumptions
- 12.3. Key Parameters
- 12.3.1. Threats of New Entrants
- 12.3.2. Bargaining Power of Customers
- 12.3.3. Bargaining Power of Automatic Sampling System Manufacturers
- 12.3.4. Threats of Substitute Products
- 12.3.5. Rivalry Among Existing Competitors
- 12.4. Concluding Remarks
13. MARKET FORECAST AND OPPORTUNITY ANALYSIS
- 13.1. Chapter Overview
- 13.2. Key Assumptions and Methodology
- 13.3. Global Automatic Sampling in Biopharmaceutical Applications and the Measurement of CQA Market, Till 2035
- 13.3.1. Automatic Sampling in Biopharmaceutical Applications and the Measurement of CQA Market: Distribution by Type of Monitoring Method
- 13.3.1.1. Automatic Sampling Market for On-line Monitoring, Till 2035
- 13.3.1.2. Automatic Sampling Market for Off-line Monitoring, Till 2035
- 13.3.1.3. Automatic Sampling Market for At-line Monitoring, Till 2035
- 13.3.2. Automatic Sampling in Biopharmaceutical Applications and the Measurement of CQA Market: Distribution by Type of Bioprocessing Method
- 13.3.2.1. Automatic Sampling Market for Upstream Bioprocessing, Till 2035
- 13.3.2.2. Automatic Sampling Market for Downstream Bioprocessing, Till 2035
- 13.3.3. Automatic Sampling in Biopharmaceutical Applications and the Measurement of CQA Market: Distribution by Working Volume
- 13.3.3.1. Automatic Sampling Market for Systems with less than 10 mL Working Volume, Till 2035
- 13.3.3.2. Automatic Sampling Market for Systems with 10-50 mL Working Volume, Till 2035
- 13.3.3.3. Automatic Sampling Market for Systems with 51-100 mL Working Volume, Till 2035
- 13.3.3.4. Automatic Sampling Market for Systems with more than 100 mL Working Volume, Till 2035
- 13.3.4. Automatic Sampling in Biopharmaceutical Applications and the Measurement of CQA Market: Distribution by Scalability
- 13.3.4.1. Automatic Sampling Market for Lab Scale Operations, Till 2035
- 13.3.4.2. Automatic Sampling Market for Pilot Scale Operations, Till 2035
- 13.3.4.3. Automatic Sampling Market for Commercial Scale Operations, Till 2035
- 13.3.5. Automatic Sampling in Biopharmaceutical Applications and the Measurement of CQA Market: Distribution by Key Geographical Regions
- 13.3.5.1. Automatic Sampling Market in North America, Till 2035
- 13.3.5.2. Automatic Sampling Market in Europe, Till 2035
- 13.3.5.3. Automatic Sampling Market in Asia-Pacific and Rest of the World, Till 2035
- 13.3.1. Automatic Sampling in Biopharmaceutical Applications and the Measurement of CQA Market: Distribution by Type of Monitoring Method
14. INDUSTRIAL REVOLUTION FROM INDUSTRY 1.0 TO INDUSTRY 5.0
- 14.1. Chapter Overview
- 14.2. Transition from Industry 1.0 to Industry 5.0
- 14.2.1. Industry 1.0
- 14.2.2. Industry 2.0
- 14.2.3. Industry 3.0
- 14.2.4. Industry 4.0
- 14.2.5. Industry 5.0
- 14.3. Horizons of Lab Evolution
- 14.4. Benefits of Industry 4.0
- 14.5. Benefits of Industry 5.0
- 14.6. Concluding Remarks
15. CONCLUDING REMARKS
16. EXECUTIVE INSIGHTS
17. APPENDIX 1: TABULATED DATA
18. APPENDIX 2: LIST OF COMPANIES AND ORGANIZATIONS
List of Tables
- Table 4.1 Automatic Sampling Systems: Information on Type of Monitoring Method, Type of Sample Monitored, Type of Sampling Unit(s) and Bioprocessing Method
- Table 4.2 Automatic Sampling Systems: Information on Key Features
- Table 4.3 Automatic Sampling Systems: Information on Usability, Automated Software, Type of Vessel, Vessel Fabrication Material, Type of Analyte Monitored, Certification and Regulatory Compliance
- Table 4.4 Automatic Sampling Systems: Information on Type of Analyzer
- Table 4.5 Automatic Sampling Systems: Information on Product Specifications
- Table 4.6 Automatic Sampling Systems: Information on End User Industry and Scalability
- Table 4.7 Automatic Sampling Systems: Information on Sterilizability and Application(s)
- Table 4.8 List of Automatic Sampling System Manufacturers: Information on Year of Establishment, Employee Count, Company Size, Location and Region of Headquarters
- Table 6.1 Automatic Sampling System Manufacturers: List of Companies Profiled
- Table 6.2 Agilent Technologies: Company Snapshot
- Table 6.3 Agilent Technologies: 850-DS Sampling Station
- Table 6.4 Agilent Technologies: Recent Developments and Future Outlook
- Table 6.5 Cytiva: Company Snapshot
- Table 6.6 Cytiva: ALIAS(TM)
- Table 6.7 Cytiva: Recent Developments and Future Outlook
- Table 6.8 Mettler Toledo: Company Snapshot
- Table 6.9 Mettler Toledo: EasySampler 1210 System
- Table 6.10 Mettler Toledo: Recent Developments and Future Outlook
- Table 6.11 Pall Corporation: Company Snapshot
- Table 6.12 Pall Corporation: Allegro(TM) MVP Single-Use System
- Table 6.13 Pall Corporation: Recent Developments and Future Outlook
- Table 6.14 Shimadzu: Company Snapshot
- Table 6.15 Shimadzu: Perfinity Workstation
- Table 6.16 Shimadzu: Recent Developments and Future Outlook
- Table 6.17 Xylem: Company Snapshot
- Table 6.18 Xylem: YSI 2940/2980
- Table 6.19 Xylem: Recent Developments and Future Outlook
- Table 7.1 Automatic Sample Collection / Preparation Systems: Information on System Category, System Classification and Type of Monitoring Method
- Table 7.2 Automatic Sample Collection / Preparation Systems: Information on Key Features
- Table 7.3 Automatic Sample Collection / Preparation Systems: Information on Product Specifications, Type of Analyzer, Certification and Regulatory Compliance
- Table 7.4 Automatic Sample Collection / Preparation Systems: Information on End User Industry and Scalability
- Table 7.5 List of Automatic Sample Collection / Preparation System Manufacturers: Information on Year of Establishment, Employee Count, Company Size, Location and Region of Headquarters
- Table 8.1 Automatic Sample Collection / Preparation System Manufacturers: List of Companies Profiled
- Table 8.2 Agilent Technologies: Company Snapshot
- Table 8.3 Agilent Technologies: AssayMAP Bravo Protein Sample Prep Platform
- Table 8.4 Agilent Technologies: 7696A Sample Prep Workbench
- Table 8.5 Biotage: Company Snapshot
- Table 8.6 Biotage: Extrahera(TM)
- Table 8.7 Biotage: Extrahera LV-200
- Table 8.8 Biotage: Recent Developments and Future Outlook
- Table 8.9 Flownamics: Company Snapshot
- Table 8.10 Flownamics: Sample-Mod(TM)
- Table 8.11 Flownamics: Seg-Flow(R) Autosampler
- Table 8.12 Flownamics: FlowFraction(TM)
- Table 8.13 Flownamics: Recent Developments and Future Outlook
- Table 8.14 MGI Tech: Company Snapshot
- Table 8.15 MGI Tech: MGISP-960
- Table 8.16 MGI Tech: MGISP-Smart 8
- Table 8.17 MGI Tech: MGISP-100
- Table 8.18 MGI Tech: Recent Developments and Future Outlook
- Table 8.19 SOTAX: Company Snapshot
- Table 8.20 SOTAX: TPW(TM) Automated Sample Preparation Workstation
- Table 8.21 SOTAX: APW(TM) Automated Sample Preparation Workstation
- Table 8.22 SOTAX: CTS Automated Sample Preparation Workstation
- Table 9.1 Patent Analysis: Top 10 CPC Symbol Definitions
- Table 9.2 Patent Analysis: Top Five CPC Symbols
- Table 9.3 Patent Analysis: Top Seven CPC Classification Symbol Definitions
- Table 9.4 Patent Analysis: Summary of Benchmarking Analysis
- Table 9.5 Patent Analysis: Categorization based on Weighted Valuation Scores
- Table 9.6 Patent Portfolio: List of Leading Patents (by Highest Relative Valuation)
- Table 9.7 Patent Portfolio: List of Leading Patents (by Number of Citations)
- Table 10.1 List of Partnerships and Collaborations
- Table 10.2 List of Partnerships and Collaborations: Information on Focus Area and Type of Product
- Table 10.3 List of Global Events related to Automatic Sampling in Biopharmaceutical Applications and the Measurement of CQA
- Table 17.1 Automatic Sampling Systems: Distribution by Type of Monitoring Method
- Table 17.2 Automatic Sampling Systems: Distribution by Type of Sampling Unit
- Table 17.3 Automatic Sampling Systems: Distribution by Availability of Pump / Probe
- Table 17.4 Automatic Sampling Systems: Distribution by Type of Module
- Table 17.5 Automatic Sampling Systems: Distribution by Automated Software
- Table 17.6 Automatic Sampling Systems: Distribution by Type of Vessel
- Table 17.7 Automatic Sampling Systems: Distribution by Vessel Fabrication Material
- Table 17.8 Automatic Sampling Systems: Distribution by Type of Analyte Monitored
- Table 17.9 Automatic Sampling Systems: Distribution by Type of Analyzer
- Table 17.10 Automatic Sampling Systems: Distribution by Number of Sampling Vessels
- Table 17.11 Automatic Sampling Systems: Distribution by Working Volume (mL)
- Table 17.12 Automatic Sampling Systems: Distribution by Operating Temperature (oC)
- Table 17.13 Automatic Sampling Systems: Distribution by End User Industry
- Table 17.14 Automatic Sampling Systems: Distribution by Scalability
- Table 17.15 Automatic Sampling Systems: Distribution by Application(s)
- Table 17.16 Automatic Sampling System Manufacturers: Distribution by Year of Establishment
- Table 17.17 Automatic Sampling System Manufacturers: Distribution by Company Size
- Table 17.18 Automatic Sampling System Manufacturers: Distribution by Region of Headquarters
- Table 17.19 Automatic Sampling System Manufacturers: Distribution by Company Size and Region of Headquarters
- Table 17.20 Automatic Sampling System Manufacturers: Distribution by Location of Headquarters
- Table 17.21 Leading Players: Distribution by Number of Automatic Sampling Systems Manufactured
- Table 17.22 Leading Automatic Sampling System Manufacturers: Distribution by Number of End User Industries
- Table 17.23 Agilent Technologies: Annual Revenues (USD Billion)
- Table 17.24 Mettler Toledo: Annual Revenues (USD Billion)
- Table 17.25 Shimadzu: Annual Revenues (JPY Billion)
- Table 17.26 Xylem: Annual Revenues (USD Billion)
- Table 17.27 Automatic Sample Collection / Preparation Systems: Distribution by System Category
- Table 17.28 Automatic Sample Collection / Preparation Systems: Distribution by System Classification
- Table 17.29 Automatic Sample Collection / Preparation Systems: Distribution by Type of Monitoring Method
- Table 17.30 Automatic Sample Collection / Preparation Systems: Distribution by Type of Sampling Unit
- Table 17.31 Automatic Sample Collection / Preparation Systems: Distribution by Type of Module
- Table 17.32 Automatic Sample Collection / Preparation Systems: Distribution by Working Volume (mL)
- Table 17.33 Automatic Sample Collection / Preparation Systems: Distribution by Type of Analyzer
- Table 17.34 Automatic Sample Collection / Preparation Systems: Distribution by End User Industry
- Table 17.35 Automatic Sample Collection / Preparation Systems: Distribution by Scalability
- Table 17.36 Automatic Sample Collection / Preparation System Manufacturers: Distribution by Year of Establishment
- Table 17.37 Automatic Sample Collection / Preparation System Manufacturers: Distribution by Company Size
- Table 17.38 Automatic Sample Collection / Preparation System Manufacturers: Distribution by Region of Headquarters
- Table 17.39 Automatic Sample Collection / Preparation System Manufacturers: Distribution by Company Size and Region of Headquarters
- Table 17.40 Automatic Sample Collection / Preparation System Manufacturers: Distribution by Location of Headquarters
- Table 17.41 Leading Players: Distribution by Number of Automatic Sample Collection / Preparation Systems Manufactured
- Table 17.42 Patent Analysis: Distribution by Type of Patent
- Table 17.43 Patent Analysis: Cumulative Distribution by Publication Year
- Table 17.44 Patent Analysis: Distribution by Annual Number of Granted Patents and Patent Applications
- Table 17.45 Patent Analysis: Distribution by Geographical Location
- Table 17.46 Patent Analysis: Cumulative Year-wise Distribution by Type of Organization
- Table 17.47 Leading Industry Players: Distribution by Number of Patents
- Table 17.48 Leading Non-Industry Players: Distribution by Number of Patents
- Table 17.49 Leading Individual Assignees: Distribution by Number of Patents
- Table 17.50 Patent Analysis: Year-wise Distribution of Patents by Age
- Table 17.51 Automatic Sampling in Biopharmaceutical Applications and the Measurement of CQA: Patent Valuation Analysis
- Table 17.52 Partnerships and Collaborations: Cumulative Year-wise Trend
- Table 17.53 Partnerships and Collaborations: Distribution by Type of Partnership
- Table 17.54 Partnerships and Collaborations: Distribution by Year and Type of Partnership
- Table 17.55 Partnerships and Collaborations: Distribution by Type of Product
- Table 17.56 Most Active Players: Distribution by Number of Partnerships
- Table 17.57 Partnerships and Collaborations: Regional Distribution
- Table 17.58 Partnerships and Collaborations: Intercontinental and Intracontinental Agreements
- Table 17.59 Global Events: Cumulative Year-wise Trend
- Table 17.60 Global Events: Distribution by Event Platform
- Table 17.61 Global Events: Distribution by Type of Event
- Table 17.62 Global Events: Regional Distribution of Events
- Table 17.63 Most Active Industry Participants: Distribution by Number of Events
- Table 17.64 Global Events: Distribution by Seniority Level of Event Speakers
- Table 17.65 Global Events: Distribution by Affiliated Department of Event Speakers
- Table 17.66 Global Automatic Sampling in Biopharmaceutical Applications and the Measurement of CQA Market, Till 2035: Conservative, Base and Optimistic Scenarios (USD Million)
- Table 17.67 Automatic Sampling in Biopharmaceutical Applications and the Measurement of CQA Market: Distribution by Type of Monitoring Method
- Table 17.68 Automatic Sampling Market for On-line Monitoring, Till 2035: Conservative, Base and Optimistic Scenarios (USD Million)
- Table 17.69 Automatic Sampling Market for Off-line Monitoring, Till 2035: Conservative, Base and Optimistic Scenarios (USD Million)
- Table 17.70 Automatic Sampling Market for At-line Monitoring, Till 2035: Conservative, Base and Optimistic Scenarios (USD Million)
- Table 17.71 Automatic Sampling in Biopharmaceutical Applications and the Measurement of CQA Market: Distribution by Type of Bioprocessing Method
- Table 17.72 Automatic Sampling Market for Upstream Bioprocessing, Till 2035: Conservative, Base and Optimistic Scenarios (USD Million)
- Table 17.73 Automatic Sampling Market for Downstream Bioprocessing, Till 2035: Conservative, Base and Optimistic Scenarios (USD Million)
- Table 17.74 Automatic Sampling in Biopharmaceutical Applications and the Measurement of CQA Market: Distribution by Working Volume
- Table 17.75 Automatic Sampling Market for Systems with less than 10 mL Working Volume, Till 2035: Conservative, Base and Optimistic Scenarios (USD Million)
- Table 17.76 Automatic Sampling Market for Systems with 10-50 mL Working Volume, Till 2035: Conservative, Base and Optimistic Scenarios (USD Million)
- Table 17.77 Automatic Sampling Market for Systems with 51-100 mL Working Volume, Till 2035: Conservative, Base and Optimistic Scenarios (USD Million)
- Table 17.78 Automatic Sampling Market for Systems with more than 100 mL Working Volume, Till 2035: Conservative, Base and Optimistic Scenarios (USD Million)
- Table 17.79 Automatic Sampling in Biopharmaceutical Applications and the Measurement of CQA Market: Distribution by Scalability
- Table 17.80 Automatic Sampling Market for Lab Scale Operations, Till 2035: Conservative, Base and Optimistic Scenarios (USD Million)
- Table 17.81 Automatic Sampling Market for Pilot Scale Operations, Till 2035: Conservative, Base and Optimistic Scenarios (USD Million)
- Table 17.82 Automatic Sampling Market for Commercial Scale Operations, Till 2035: Conservative, Base and Optimistic Scenarios (USD Million)
- Table 17.83 Automatic Sampling in Biopharmaceutical Applications and the Measurement of CQA Market: Distribution by Key Geographical Regions
- Table 17.84 Automatic Sampling Market in North America, Till 2035: Conservative, Base and Optimistic Scenarios (USD Million)
- Table 17.85 Automatic Sampling Market in Europe, Till 2035: Conservative, Base and Optimistic Scenarios (USD Million)
- Table 17.86 Automatic Sampling Market in Asia-Pacific and Rest of the World, Till 2035: Conservative, Base and Optimistic Scenarios (USD Million)
List of Figures
- Figure 2.1 Executive Summary: Automatic Sampling Systems Market Landscape
- Figure 2.2 Executive Summary: Automatic Sample Collection / Preparation Systems Market Landscape
- Figure 2.3 Executive Summary: Patent Analysis
- Figure 2.4 Executive Summary: Recent Developments
- Figure 2.5 Executive Summary: Market Forecast and Opportunity Analysis
- Figure 3.1 Manual Sampling versus Automatic Sampling
- Figure 3.2 Automatic Aseptic Sampling System
- Figure 3.3 Bioprocess Monitoring and Control Methods
- Figure 3.4 Key Considerations for Automatic Sampling
- Figure 3.5 Benefits of Automatic Sampling Systems
- Figure 4.1 Automatic Sampling Systems: Distribution by Type of Monitoring Method
- Figure 4.2 Automatic Sampling Systems: Distribution by Type of Sampling Unit
- Figure 4.3 Automatic Sampling Systems: Distribution by Availability of Pump / Probe
- Figure 4.4 Automatic Sampling Systems: Distribution by Type of Module
- Figure 4.5 Automatic Sampling Systems: Distribution by Automated Software
- Figure 4.6 Automatic Sampling Systems: Distribution by Type of Vessel
- Figure 4.7 Automatic Sampling Systems: Distribution by Vessel Fabrication Material
- Figure 4.8 Automatic Sampling Systems: Distribution by Type of Analyte Monitored
- Figure 4.9 Automatic Sampling Systems: Distribution by Type of Analyzer
- Figure 4.10 Automatic Sampling Systems: Distribution by Number of Sampling Vessels
- Figure 4.11 Automatic Sampling Systems: Distribution by Working Volume (mL)
- Figure 4.12 Automatic Sampling Systems: Distribution by Operating Temperature (oC)
- Figure 4.13 Automatic Sampling Systems: Distribution by End User Industry
- Figure 4.14 Automatic Sampling Systems: Distribution by Scalability
- Figure 4.15 Automatic Sampling Systems: Distribution by Application(s)
- Figure 4.16 Automatic Sampling System Manufacturers: Distribution by Year of Establishment
- Figure 4.17 Automatic Sampling System Manufacturers: Distribution by Company Size
- Figure 4.18 Automatic Sampling System Manufacturers: Distribution by Region of Headquarters
- Figure 4.19 Automatic Sampling System Manufacturers: Distribution by Company Size and Region of Headquarters
- Figure 4.20 Automatic Sampling System Manufacturers: Distribution by Location of Headquarters
- Figure 4.21 Leading Players: Distribution by Number of Automatic Sampling Systems Manufactured
- Figure 4.22 Leading Automatic Sampling System Manufacturers: Distribution by Number of End User Industries
- Figure 5.1 Company Competitiveness Analysis: Automatic Sampling System Manufacturers in North America
- Figure 5.2 Company Competitiveness Analysis: Automatic Sampling System Manufacturers in Europe
- Figure 5.3 Company Competitiveness Analysis: Automatic Sampling System Manufacturers in Asia-Pacific
- Figure 6.1 Agilent Technologies: Annual Revenues (USD Billion)
- Figure 6.2 Mettler Toledo: Annual Revenues (USD Billion)
- Figure 6.3 Shimadzu: Annual Revenues (JPY Billion)
- Figure 6.4 Xylem: Annual Revenues (USD Billion)
- Figure 7.1 Automatic Sample Collection / Preparation Systems: Distribution by System Category
- Figure 7.2 Automatic Sample Collection / Preparation Systems: Distribution by System Classification
- Figure 7.3 Automatic Sample Collection / Preparation Systems: Distribution by Type of Monitoring Method
- Figure 7.4 Automatic Sample Collection / Preparation Systems: Distribution by Type of Sampling Unit
- Figure 7.5 Automatic Sample Collection / Preparation Systems: Distribution by Type of Module
- Figure 7.6 Automatic Sample Collection / Preparation Systems: Distribution by Working Volume (mL)
- Figure 7.7 Automatic Sample Collection / Preparation Systems: Distribution by Type of Analyzer
- Figure 7.8 Automatic Sample Collection / Preparation Systems: Distribution by End User Industry
- Figure 7.9 Automatic Sample Collection / Preparation Systems: Distribution by Scalability
- Figure 7.10 Automatic Sample Collection / Preparation System Manufacturers: Distribution by Year of Establishment
- Figure 7.11 Automatic Sample Collection / Preparation System Manufacturers: Distribution by Company Size
- Figure 7.12 Automatic Sample Collection / Preparation System Manufacturers: Distribution by Region of Headquarters
- Figure 7.13 Automatic Sample Collection / Preparation System Manufacturers: Distribution by Company Size and Region of Headquarters
- Figure 7.14 Automatic Sample Collection / Preparation System Manufacturers: Distribution by Location of Headquarters
- Figure 7.15 Leading Players: Distribution by Number of Automatic Sample Collection / Preparation Systems Manufactured
- Figure 9.1 Patent Analysis: Distribution by Type of Patent
- Figure 9.2 Patent Analysis: Cumulative Distribution by Publication Year
- Figure 9.3 Patent Analysis: Distribution by Annual Number of Granted Patents and Patent Applications
- Figure 9.4 Patent Analysis: Distribution by Geographical Location
- Figure 9.5 Patent Analysis: Distribution by CPC Symbols
- Figure 9.6 Word Cloud: Emerging Focus Areas
- Figure 9.7 Patent Analysis: Cumulative Year-wise Distribution by Type of Organization
- Figure 9.8 Leading Industry Players: Distribution by Number of Patents
- Figure 9.9 Leading Non-Industry Players: Distribution by Number of Patents
- Figure 9.10 Leading Individual Assignees: Distribution by Number of Patents
- Figure 9.11 Leading Players: Benchmarking by Patent Characteristics (CPC Symbols)
- Figure 9.12 Patent Analysis: Year-wise Distribution of Patents by Age
- Figure 9.13 Automatic Sampling in Biopharmaceutical Applications and the Measurement of CQA: Patent Valuation Analysis
- Figure 10.1 Partnerships and Collaborations: Cumulative Year-wise Trend
- Figure 10.2 Partnerships and Collaborations: Distribution by Type of Partnership
- Figure 10.3 Partnerships and Collaborations: Distribution by Year and Type of Partnership
- Figure 10.4 Partnerships and Collaborations: Distribution by Type of Product
- Figure 10.5 Partnerships and Collaborations: Distribution by Product and Type of Partnership
- Figure 10.6 Most Active Players: Distribution by Number of Partnerships
- Figure 10.7 Word Cloud: Emerging Focus Areas
- Figure 10.8 Partnerships and Collaborations: Regional Distribution
- Figure 10.9 Partnerships and Collaborations: Intercontinental and Intracontinental Agreements
- Figure 10.10 Global Events: Cumulative Year-wise Trend
- Figure 10.11 Global Events: Distribution by Event Platform
- Figure 10.12 Global Events: Distribution by Type of Event
- Figure 10.13 Global Events: Regional Distribution of Events
- Figure 10.14 Word Cloud: Evolutionary Trends in Event Agenda / Key Focus Area
- Figure 10.15 Global Events: Historical Trend of Event Agendas
- Figure 10.16 Most Active Industry Participants: Distribution by Number of Events
- Figure 10.17 Global Events: Distribution by Seniority Level of Event Speakers
- Figure 10.18 Global Events: Distribution by Affiliated Department of Event Speakers
- Figure 11.1 Automatic Sampling in Biopharmaceutical Applications and the Measurement of CQA: SWOT Analysis
- Figure 11.2 SWOT Factors: Harvey Ball Analysis
- Figure 12.1 Porters Five Forces: Key Parameters
- Figure 12.2 Porters Five Forces: Harvey Ball Analysis
- Figure 13.1 Global Automatic Sampling in Biopharmaceutical Applications and the Measurement of CQA Market, Till 2035 (USD Million)
- Figure 13.2 Automatic Sampling in Biopharmaceutical Applications and the Measurement of CQA Market: Distribution by Type of Monitoring Method
- Figure 13.3 Automatic Sampling Market for On-line Monitoring, Till 2035 (USD Million)
- Figure 13.4 Automatic Sampling Market for Off-line Monitoring, Till 2035 (USD Million)
- Figure 13.5 Automatic Sampling Market for At-line Monitoring, Till 2035 (USD Million)
- Figure 13.6 Automatic Sampling in Biopharmaceutical Applications and the Measurement of CQA Market: Distribution by Type of Bioprocessing Method
- Figure 13.7 Automatic Sampling Market for Upstream Bioprocessing, Till 2035 (USD Million)
- Figure 13.8 Automatic Sampling Market for Downstream Bioprocessing, Till 2035 (USD Million)
- Figure 13.9 Automatic Sampling in Biopharmaceutical Applications and the Measurement of CQA Market: Distribution by Working Volume
- Figure 13.10 Automatic Sampling Market for Systems with less than 10 mL Working Volume, Till 2035 (USD Million)
- Figure 13.11 Automatic Sampling Market for Systems with 10-50 mL Working Volume, Till 2035 (USD Million)
- Figure 13.12 Automatic Sampling Market for Systems with 51-100 mL Working Volume, Till 2035 (USD Million)
- Figure 13.13 Automatic Sampling Market for Systems with more than 100 mL Working Volume, Till 2035 (USD Million)
- Figure 13.14 Automatic Sampling in Biopharmaceutical Applications and the Measurement of CQA Market: Distribution by Scalability
- Figure 13.15 Automatic Sampling Market for Lab Scale Operations, Till 2035 (USD Million)
- Figure 13.16 Automatic Sampling Market for Pilot Scale Operations, Till 2035 (USD Million)
- Figure 13.17 Automatic Sampling Market for Commercial Scale Operations, Till 2035 (USD Million)
- Figure 13.18 Automatic Sampling in Biopharmaceutical Applications and the Measurement of CQA Market: Distribution by Key Geographical Regions
- Figure 13.19 Automatic Sampling Market in North America, Till 2035 (USD Million)
- Figure 13.20 Automatic Sampling Market in Europe, Till 2035 (USD Million)
- Figure 13.21 Automatic Sampling Market in Asia-Pacific and Rest of the World, Till 2035 (USD Million)
- Figure 14.1 Transition from Industry 1.0 to Industry 5.0
- Figure 14.2 Horizons of Lab Evolution
- Figure 14.3 Benefits of Industry 4.0
- Figure 14.4 Benefits of Industry 5.0
- Figure 15.1 Concluding Remarks: Automatic Sampling Systems Market Landscape
- Figure 15.2 Concluding Remarks: Automatic Sample Collection / Preparation Systems Market Landscape
- Figure 15.3 Concluding Remarks: Patent Analysis
- Figure 15.4 Concluding Remarks: Partnerships and Collaborations
- Figure 15.5 Concluding Remarks: Global Events
- Figure 15.6 Concluding Remarks:Porter's Five Forces Analysis
- Figure 15.7 Concluding Remarks: Market Forecast and Opportunity Analysi
 自動無菌取樣市場分析及至2034年的預測:類型、產品、服務、技術、組件、應用、流程與最終用戶
 灌裝設備市場按產品類型、製程類型、技術和最終用途產業分類-2025-2032 年全球預測
 2025年全球灌裝機市場報告2025年全球無菌自動灌裝機市場報告2025年全球軟管灌裝機市場報告
 2025 年至 2033 年灌裝設備市場規模、佔有率、趨勢及預測(依銷售類型、製程類型、產品類型、最終用途產業及地區)
 全球氣霧劑灌裝機市場
 灌裝機市場:依設備類型、按類型、按地區
 軟管灌裝機市場機會、成長動力、產業趨勢分析及 2025 - 2034 年預測
 全球灌裝機市場:市場佔有率分析、產業趨勢與統計、成長預測(2025-2030 年)