


 |
市場調查報告書
商品編碼
1771289
補體抑制劑市場:產業趨勢和全球預測 - 各適應疾病,各治療領域,各分子類型,各標的途徑,治療類別,各給藥途徑,主要各地區Complement Inhibitors Market: Industry Trends and Global Forecasts - Distribution by Target Disease Indication, Therapeutic Area, Type of Molecule, Target Pathway, Type of Therapy, Route of Administration, Key Geographical Regions |
||||||
預計2035年,全球補體抑制劑市場規模將從目前的91億美元成長至78億美元,預測期內複合年增長率為15%。
市場區隔包括以下參數的市場規模與機會分析:
適應疾病
- 非典型溶血性尿毒症症候群
- 心臟移植排斥反應
- 冷血球凝集素病
- COVID-19
- 全身性重症肌無力
- 格林-巴利症候群
- 遺傳性血管水腫
- 視神經脊髓炎
- 陣發性夜間血尿症
治療領域
- 心血管疾病
- 遺傳性疾病
- 血液·血管疾病
- 感染疾病
- 神經疾病
- 神經肌肉疾病
分子類型
- 生物製藥
- 低分子
標的途徑
- 替代途徑
- 古典的途徑
- 凝集素途徑
- 末端途徑
治療類型
- 單劑療法
- 聯合治療
給藥途徑
- 靜脈注射
- 口服
- 皮下
主要地區
- 北美
- 歐洲
- 亞太地區
全球補體抑制劑市場:成長和趨勢
補體系統於19世紀被發現,是免疫系統的一部分,參與組織修復和體內平衡,從而提供抵禦多種感染的第一道防線。整個過程與複雜且高度受調控的蛋白質組裝有關,涉及多種可溶性和表面結合補體成分,包括受體和調節劑,主要在肝臟中產生。這些蛋白質構成了補體療法的基礎,與多種免疫細胞相互作用,並補充抗體的作用。此外,補體系統透過促進凋亡細胞的清除和控制細胞存活,有助於維持健康生物體的體內平衡。然而,補體活化不足會導致病原體增殖、補體調節因子被抑制,最終導致疾病。因此,人們開發了抑制補體系統活化的療法,以幫助減少組織發炎並調節對外來和自體抗原的適應性免疫反應。
在鼓勵臨床研究、新製藥公司進入、疾病重點擴大以及以創新方式超越C5藥物的願望日益增強的推動下,補體抑制劑市場預計將在未來十年獲得製藥市場的顯著佔有率,屆時將有更多候選藥物獲批上市。
全球補體抑制劑市場:關鍵洞察
本報告深入探討了全球補體抑制劑市場的現狀,並識別了該行業內的潛在成長機會。報告的主要發現包括:
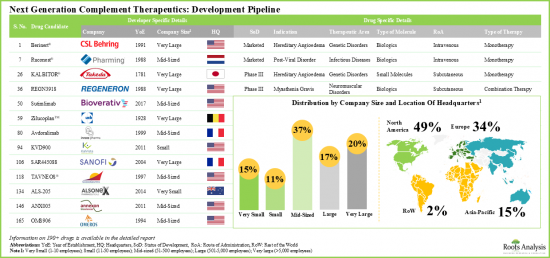
- 全球各大製藥公司正在研究超過190種針對補體系統治療多種疾病的候選藥物。
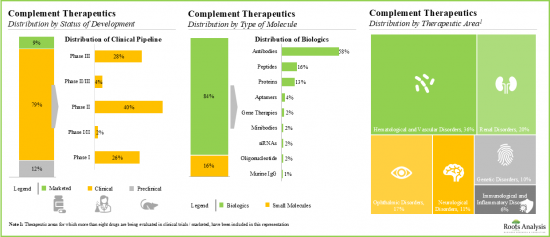
- 目前,大多數(約80%)補體療法正在臨床試驗中進行評估,其中超過75%的候選藥物為生物製劑,尤其是單株抗體。
- 北美已成為該市場的中心,約有50%的研發商聚集於此。目前,該市場由中型公司主導(佔利害關係人總數的37%)。值得注意的是,15%的參與者是大型製藥公司,他們參與了多個治療領域的此類療法的開發。
- 迄今為止,已有超過850項與補體療法相關的臨床試驗註冊,其中大多數(53%)在歐洲的各個臨床研究中心進行。
- 據報道,就註冊試驗數量而言,臨床研究活動在此期間以21%的複合年增長率增長。在註冊試驗總數中,近60%已經完成,而24%的試驗仍在招募參與者。
- 多篇以補體療法為主題的論文已發表在具有較高作者影響力的知名期刊上。
- 近年來,與補體療法相關的論文數量逐漸增加,共發表了1,460篇研究論文。
- 超過40%的關於下一代補體療法的論文發表於2019年之後。
- "免疫學前沿" 是最受歡迎的期刊,其中大部分論文關注傳染病(21%)和腎臟病(16%)。
- 已向各組織撥款超過8億美元,以支持正在進行的新型補體療法創新研究。其中約20%的撥款由美國國家癌症研究所資助。
- 與補體療法相關的專利申請數量的不斷增長表明利益相關者對該領域的關注度日益增長,以及該領域廣泛的研發工作。
- 該領域已提交/授予超過3,490項與補體療法相關的專利。這一數字歸功於該領域持續不斷的研發工作。
- 超過60%的補體療法相關專利申請是由各行各業的參與者提交的,例如AbbVie和Alexion Pharmaceuticals。
- 這主要是由於近期提交的專利被引用次數較低。
- 高達45%的合作協議是為了產品開發和商業化而簽署的。此外,大多數協議是由北美參與者簽署的(66%)。
- 意識到該領域的機遇,多家投資者已在74輪融資中投資了總計約142億美元。
- 約40%的該領域公司主要透過二次發行籌集資金。此外,70%的融資案例來自總部位於北美的公司。
- 大型製藥公司正在採取一系列舉措,從專有產品開發到策略性投資。
- 憑藉著前景廣闊的開發管道和令人鼓舞的臨床研究成果,補充療法市場預計未來十年將以每年超過 15% 的速度成長。
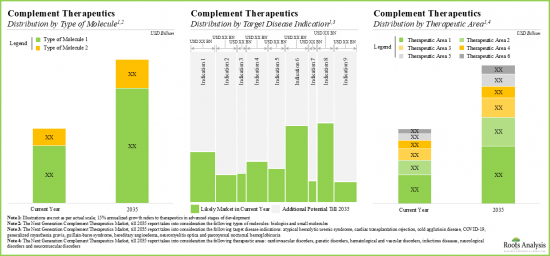
- 在各種標靶途徑、治療類型、給藥途徑和主要地理區域,補充療法市場機會呈現多元化。
補體抑制劑市場參與企業案例
- Amgen
- CSL Behring
- Innovent Biologics
- Novartis
- Regeneron
- Roche
- Sanofi
- Takeda
- UCB
初步研究概述
本研究中表達的觀點和見解受到與多位利害關係人討論的影響。研究報告包含對以下產業參與者的詳細訪談:
- 醫生,公司A
- 血液科/腫瘤科,公司B
- 高級科學顧問,公司C
- 腎臟科臨床醫師/科學家,公司D
- 腎臟科教授,公司E
本報告概述了全球補體抑制劑市場,包括按適應症、治療領域、分子類型、標靶途徑、治療類型、給藥途徑、區域趨勢和公司概況劃分的市場趨勢。
目錄
第1章 序文
第2章 摘要整理
第3章 簡介
- 補體系概要
- 補體系干預的免疫細胞
- 補體系的特徵
- 補體系的功能
- 恆常性和壓力狀態的補體所扮演的角色
- 補體系的活性化
- 主要的補體蛋白質的供給來源
- 古典的途徑的補體蛋白質的功能
- 補體系的途徑
- 補體系的調節不全影響
- 補體蛋白質的缺陷相關的疾病
- 補體療法的種類
- 補體療法的限制
- 下一代補體治療藥的未來
第4章 下一代補體治療藥:市場形勢
- 分析調查手法和主要參數
- 下一代補體治療藥:開發平台
- 下一代補體治療藥:特別指定藥物一覽
- 下一代補體治療藥:開發形勢
第5章 企業簡介
- Amgen
- CSL Behring
- Innovent Biologics
- Novartis
- Regeneron
- Roche
- Sanofi
- Takeda
- UCB
第6章 臨床試驗的分析
- 分析調查手法和主要參數
- 下一代補體治療藥:臨床試驗一覽
第7章 出版物的分析
- 分析調查手法和主要參數
- 下一代補體治療藥:出版物一覽
第8章 津貼分析
- 分析調查手法和主要參數
第9章 專利分析
- 分析調查手法和主要參數
- 下一代補體治療藥:專利一覽
第10章 夥伴關係和合作
- 下一代補體治療藥:聯盟·合作清單
第11章 與資金籌措投資分析
- 下一代補體治療藥:資金籌措和投資的清單
第12章 大型製藥公司
- 分析調查手法和主要參數
- 參數的評分
- 大型製藥公司:收益相關資訊
第13章 市場規模的評估與機會分析
- 預測調查手法和主要參數
- 到2035年前的全球下一代補體治療藥市場
- 到2035年前的成藥作為對象的全球下一代補體治療藥市場
- 市售醫藥品的各產品預測銷售額
- Berinert (CSL Behring)
- EMPAVEL
- ORLADEYO(BioCryst 製藥公司)
- Ruconest(醫藥)
- Soliris(Alexion 藥廠)
- 卓次郎(武田)
- Ultomiris(Alexion 藥廠)
- 到2035年前的第三階段醫藥品的下一代補體治療藥的全球市場
- 第三階段醫藥品的各產品預測銷售額
- Narsoplimab(Omeros)
- REGN3918(再生元)
- RG6107(Ruconest)
- rVA576(Akari Therapeutics)
- SAR445088(賽諾菲)
- Soliris(Alexion 藥廠)
- Stimulimab(Bioverativ)
- 比洛貝利單抗 (InflaRx)
- 齊爾科普蘭(UCB)
- 摘要:第三階段的藥物
第14章 專家的意見
第15章 附錄1:圖表一覽
第16章 附錄2:企業·團體一覽
GLOBAL COMPLEMENT INHIBITORS MARKET: OVERVIEW
As per Roots Analysis, the global complement inhibitors market is estimated to grow from USD 9.1 billion in the current year to USD 7.8 billion by 2035, at a CAGR of 15% during the forecast period, till 2035.
The market sizing and opportunity analysis has been segmented across the following parameters:
Target Disease Indication
- Atypical Hemolytic Uremic Syndrome
- Cardiac Transplantation Rejection
- Cold Agglutinin Disease
- COVID-19
- Generalized Myasthenia Gravis
- Guillain-Barre Syndrome
- Hereditary Angioedema
- Neuromyelitis Optica
- Paroxysmal Nocturnal Hemoglobinuria
Therapeutic Area
- Cardiovascular Disorders
- Genetic Disorders
- Hematological and Vascular Disorders
- Infectious Diseases
- Neurological Disorders
- Neuromuscular Disorders
Type of Molecule
- Biologic
- Small Molecule
Target Pathway
- Alternate Pathway
- Classical Pathway
- Lectin Pathway
- Terminal Pathway
Type of Therapy
- Monotherapy
- Combination Therapy
Route of Administration
- Intravenous
- Oral
- Subcutaneous
Key Geographical Regions
- North America
- Europe
- Asia-Pacific
GLOBAL COMPLEMENT INHIBITORS MARKET: GROWTH AND TRENDS
Complement system was discovered in the 19th century as a part of immune system, responsible for tissue repair and homeostasis, thereby providing first line of defense against multiple infections. This complete process is in association with a complex and highly regulated assembly of proteins which involve several soluble and surface-bound complement components, including receptors and regulators, which are primarily generated by the liver. These proteins, making the base for complement therapeutics, interact with multiple immune cells and complement the action of antibodies, which are in turn responsible for killing the infectious agents. Additionally, the complement system contributes to maintaining homeostasis in healthy organisms by facilitating the clearance of apoptotic cells and regulating cell survival. However, when complement activation is insufficient, pathogens can proliferate, and the suppression of complement regulators may occur, ultimately leading to disease. Consequently, therapeutics targeting the complement system have been developed to inhibit its activation, which helps reduce tissue inflammation and modulate the adaptive immune response to both foreign and self-antigens.
Driven by encouraging clinical research efforts, new pharmaceutical entrants, broadening of disease focus, and a rising desire to get beyond C5 with some innovative ways, the complement inhibitors market is expected to capture a significant share in the pharmaceutical market with more drug candidates getting approved and marketed over the coming decade.
GLOBAL COMPLEMENT INHIBITORS MARKET: KEY INSIGHTS
The report delves into the current state of global complement inhibitors market and identifies potential growth opportunities within industry. Some key findings from the report include:
- Over 190 therapeutic candidates, targeting complement system for the treatment of multiple disease indications, are being investigated by various pharmaceutical companies across the globe.
- Majority (~80%) of complement therapeutics are currently being evaluated in clinical trials; more than 75% of the pipeline candidates are biologics, specifically monoclonal antibodies.
- North America has emerged as the hub, featuring the presence of approximately 50% developers. The market is currently dominated by the presence of mid-sized players (37% of the total number of stakeholders). Interestingly, 15% of the players are big pharma companies engaged in the development of such therapeutics for multiple therapeutic areas.
- 850+ clinical trials related to complement therapeutics have been registered till date; majority (53%) of these trials were / are being conducted across various clinical sites based in Europe.
- The clinical research activity, in terms of number of trials registered, is reported to have increased at a CAGR of 21%, during the given period. Of the total number of trials registered, close to 60% have already been completed, while 24% of the studies are actively recruiting participants.
- A variety of articles focused on complement therapeutics have been published by eminent authors in high-impact journals.
- Over the years, there has been a gradual rise in the number of publications related to complement therapeutics; 1,460 research articles were published during the given time period.
- More than 40% of the articles focused on next generation complement therapeutics were published post-2019.
- Frontiers in Immunology emerged to be the most popular journal with majority of the publications focused on infectious diseases (21%) and renal disorders (16%).
- Grants worth over USD 800 million have been awarded to various organizations in order to support the ongoing research efforts for innovation of novel complement therapeutics. Around 20% of the grants were funded by the National Cancer Institute.
- The increasing number of patents being filed for complement therapeutics is indicative of the rising interest of stakeholders and extensive R&D efforts being undertaken in this field.
- Over 3,490 patents related to complement therapeutics have been filed / granted in this domain; this number can be attributed to the incessant R&D efforts being made in this domain.
- More than 60% of the patent applications have been filed for complement therapeutics by various industry players; examples include AbbVie and Alexion Pharmaceuticals.
- Only 4% of the patents have a significantly higher relative valuation; this is primarily because of the low number of citations of the patents filed recently.
- Maximum, over 45% of the partnerships were signed for product development and commercialization purposes. Further, majority of the agreements were signed by players based in North America (66%).
- Several investors, having realized the opportunity within this segment, have collectively invested a sum of ~USD 14.2 billion, across 74 funding instances.
- Around 40% of the companies engaged in this domain primarily received funding through secondary offerings. Further, 70% of the funding instances were reported by players headquartered in North America.
- Big pharma players have undertaken a variety of initiatives, ranging from proprietary product development to strategic investments.
- With a promising development pipeline and encouraging clinical research outcomes, the complement therapeutics market is anticipated to grow at an annualized rate of more than 15%, over the next decade.
- The opportunity is likely to be well distributed across various target pathways, types of therapies, routes of administration and key geographical regions.
Example Players in the Complement Inhibitors Market
- Amgen
- CSL Behring
- Innovent Biologics
- Novartis
- Regeneron
- Roche
- Sanofi
- Takeda
- UCB
PRIMARY RESEARCH OVERVIEW
The opinions and insights presented in this study were influenced by discussions conducted with multiple stakeholders. The research report features detailed transcripts of interviews conducted with the following industry stakeholders:
- Physician, Company A
- Hematologist Oncologist, Company B
- Senior Scientific Consultant, Company C
- Nephrology Clinician-Scientist, Company D
- Professor of Nephrology, Company E
GLOBAL COMPLEMENT INHIBITORS MARKET: RESEARCH COVERAGE
- Market Sizing and Opportunity Analysis: The report features an in-depth analysis of the global complement inhibitors market, focusing on key market segments, including [A] target disease indication, [B] therapeutic area, [C] type of molecule, [D] target pathway, [E] type of therapy, [F] route of administration and [G] key geographical regions.
- Market Landscape: A comprehensive evaluation of next generation complement therapeutics, considering various parameters, such as [A] status of development, [B] type of molecule, [C] type of drug, [D] biological target, [E] target pathway, [F] mechanism of action, [G] target disease indication(s), [H] therapeutic area(s), [I] route of administration, [J] type of therapy and [K] dosing frequency. Additionally, the section includes a comprehensive evaluation of players developing next generation complement therapeutics based on parameters, such as [A] year of establishment, [B] company size and [D] location of headquarters.
- Company Profiles: In-depth profiles of companies engaged in the development of next generation complement therapeutics, focusing on [A] company overview, [B] financial information (if available), [C] product portfolio and [D] recent developments and an informed future outlook.
- Clinical Trial Analysis: A comprehensive analysis of clinical studies of various next generation complement therapeutics, examining factors, such as [A] current trial status, [B] trial registration year, [C] trial phase, [D] enrolled patient population, [E] type of sponsor / collaborator, [F] type of study, [G] study design, [H] leading industry and non-industry players, [I] key indication(s), [J] popular therapeutics area(s), [K] type of treatment, [L] type of drug, [M] emerging focus areas and [N] regional distribution of trials.
- Publication Analysis: An insightful analysis of more than 1,450 peer-reviewed, scientific articles related to research on next generation complement therapeutics, based on various relevant parameters, such as [A] year of publication, [B] emerging focus areas, [C] top authors, [D] key research journals, [E] popular indication(s) and [F] therapeutic area(s).
- Grant Analysis: A detailed analysis of grants awarded to various research institutes for the projects related to next generation complement therapeutics, based on various relevant parameters, such as [A] year of grant awarded, [B] amount awarded, [C] funding institute center, [D] support period, [E] type of grant, [F] activity code while highlighting popular recipient organizations, [F] popular NIH departments, [G] study section, [H] type of recipient organization, [I] emerging focus areas of the grants, [J] purpose of grant awarded, [K] prominent program officers and [L] location of recipient organizations.
- Patent Analysis: An insightful analysis of patents filed / granted for next generation complement therapeutics, based on various relevant parameters, such as [A] patent publication year, [B] type of patent, [C] geographical location, [D] CPC symbols, [E] type of applicant, [F] patent age, [G] emerging focus areas, [H] leading industry and non-industry players (in terms of number of patents granted / filed), [I] patent characteristics, [J] patent benchmarking and [K] patent valuation.
- Partnerships and Collaborations: A comprehensive analysis of deals inked by stakeholders in this domain, based on several relevant parameters, such as [A] year of partnership, [B] type of partnership, [C] biological target, [D] target pathway, [E] emerging focus area, [F] type of partner, [G] popular disease indication, [H] therapeutic area and [I] geographical distribution of partnership activity.
- Funding and Investments: An in-depth analysis of the fundings raised by companies engaged in complement inhibitors market, based on relevant parameters, such as [A] year of funding, [B] amount invested, [C] type of funding, [D] geographical analysis, [E] most active players and [F] most active investors.
- Big Pharma Players: A comprehensive analysis of big pharma players engaged in the field of complement inhibitors market, based on several relevant parameters, such as [A] number of therapeutics under development, [B] type of molecule, [C] status of development, [D] number of therapeutic areas, [E] number of partnerships, [F] number of patents and [G] years of experience.
KEY QUESTIONS ANSWERED IN THIS REPORT
- How many companies are currently engaged in this market?
- Which are the leading companies in this market?
- What factors are likely to influence the evolution of this market?
- What is the current and future market size?
- What is the CAGR of this market?
- How is the current and future market opportunity likely to be distributed across key market segments?
REASONS TO BUY THIS REPORT
- The report provides a comprehensive market analysis, offering detailed revenue projections of the overall market and its specific sub-segments. This information is valuable to both established market leaders and emerging entrants.
- Stakeholders can leverage the report to gain a deeper understanding of the competitive dynamics within the market. By analyzing the competitive landscape, businesses can make informed decisions to optimize their market positioning and develop effective go-to-market strategies.
- The report offers stakeholders a comprehensive overview of the market, including key drivers, barriers, opportunities, and challenges. This information empowers stakeholders to stay abreast of market trends and make data-driven decisions to capitalize on growth prospects.
ADDITIONAL BENEFITS
- Complimentary Excel Data Packs for all Analytical Modules in the Report
- 15% Free Content Customization
- Detailed Report Walkthrough Session with Research Team
- Free Updated report if the report is 6-12 months old or older
TABLE OF CONTENTS
1. PREFACE
- 1.1. Scope of the Report
- 1.2. Research Methodology
- 1.2.1. Research Assumptions
- 1.2.2. Project Methodology
- 1.2.3. Forecast Methodology
- 1.2.4. Robust Quality Control
- 1.2.5. Key Considerations
- 1.2.5.1. Demographics
- 1.2.5.2. Economic Factors
- 1.2.5.3. Government Regulations
- 1.2.5.4. Supply Chain
- 1.2.5.5. COVID Impact / Related Factors
- 1.2.5.6. Market Access
- 1.2.5.7. Healthcare Policies
- 1.2.5.8. Industry Consolidation
- 1.3 Key Questions Answered
- 1.4. Chapter Outlines
2. EXECUTIVE SUMMARY
3. INTRODUCTION
- 3.1. Overview of Complement System
- 3.2. Immune Cells Involved in Complement System
- 3.3. Characteristics of Complement System
- 3.4. Functions of Complement System
- 3.5. Role of Complement in Homeostasis and Stress Conditions
- 3.6. Activation of Complement System
- 3.6.1. Steps in Complement Activation
- 3.7. Sources of Key Complement Proteins
- 3.8. Functions of Complement Proteins of Classical Pathway
- 3.9. Pathways of Complement System
- 3.9.1. Classical Pathway
- 3.9.2. Lectin Pathway
- 3.9.3. Alternative Pathway
- 3.9.4. Terminal Pathway
- 3.10. Consequences of a Dysregulated Complement System
- 3.11. Diseases related to Defects in Complement Proteins
- 3.12. Types of Complement Therapeutics
- 3.13. Limitations of Complement Therapeutics
- 3.14. Future of Next Generation Complement Therapeutics
4. NEXT GENERATION COMPLEMENT THERAPEUTICS: MARKET LANDSCAPE
- 4.1. Analysis Methodology and Key Parameters
- 4.2. Next Generation Complement Therapeutics: Development Pipeline
- 4.2.1. Analysis by Status of Development
- 4.2.2. Analysis by Type of Molecule
- 4.2.3. Analysis by Status of Development and Type of Molecule
- 4.2.4. Analysis by Type of Drug
- 4.2.5. Analysis by Biological Target
- 4.2.6. Analysis by Target Pathway
- 4.2.7. Analysis by Mechanism of Action
- 4.2.8. Analysis by Mechanism of Action and Target Pathway
- 4.2.9. Analysis by Target Disease Indication(s)
- 4.2.10. Analysis by Status of Development and Target Disease Indication(s)
- 4.2.11. Analysis by Therapeutic Area
- 4.2.12. Analysis by Therapeutic Area and Type of Molecule
- 4.2.13. Analysis by Route of Administration
- 4.2.14. Analysis by Type of Therapy
- 4.2.15. Analysis by Dosing Frequency
- 4.2.16. Grid Analysis: Type of Therapy, Type of Molecule, Route of Administration and Mechanism of Action
- 4.3. Next Generation Complement Therapeutics: List of Drugs with Special Designations
- 4.3.1. Analysis by Special Designation
- 4.4. Next Generation Complement Therapeutics: Developer Landscape
- 4.4.1. Analysis by Year of Establishment
- 4.4.2. Analysis by Company Size
- 4.4.3. Analysis by Region of Headquarters
- 4.4.4. Analysis by Company Size and Region of Headquarters
- 4.4.5. Leading Players: Analysis by Number of Therapeutics
5. COMPANY PROFILES
- 5.1. Amgen
- 5.1.1. Company Overview
- 5.1.2. Financial Information
- 5.1.3. Product Portfolio
- 5.1.4. Recent Developments and Future Outlook
- 5.2. CSL Behring
- 5.2.1. Company Overview
- 5.2.2. Financial Information
- 5.2.3. Product Portfolio
- 5.2.4. Recent Developments and Future Outlook
- 5.3. Innovent Biologics
- 5.3.1. Company Overview
- 5.3.2. Financial Information
- 5.3.3. Product Portfolio
- 5.3.4. Recent Developments and Future Outlook
- 5.4. Novartis
- 5.4.1. Company Overview
- 5.4.2. Financial Information
- 5.4.3. Product Portfolio
- 5.4.4. Recent Developments and Future Outlook
- 5.5. Regeneron
- 5.5.1. Company Overview
- 5.5.2. Financial Information
- 5.5.3. Product Portfolio
- 5.5.4. Recent Developments and Future Outlook
- 5.6. Roche
- 5.6.1. Company Overview
- 5.6.2. Financial Information
- 5.6.3. Product Portfolio
- 5.6.4. Recent Developments and Future Outlook
- 5.7. Sanofi
- 5.7.1. Company Overview
- 5.7.2. Financial Information
- 5.7.3. Product Portfolio
- 5.7.4. Recent Developments and Future Outlook
- 5.8. Takeda
- 5.8.1. Company Overview
- 5.8.2. Financial Information
- 5.8.3. Product Portfolio
- 5.8.4. Recent Developments and Future Outlook
- 5.9. UCB
- 5.9.1. Company Overview
- 5.9.2. Financial Information
- 5.9.3. Product Portfolio
- 5.9.4. Recent Developments and Future Outlook
6. CLINICAL TRIAL ANALYSIS
- 6.1. Analysis Methodology and Key Parameters
- 6.2. Next Generation Complement Therapeutics: List of Clinical Trials
- 6.2.1. Analysis by Trial Status
- 6.2.2. Cumulative Analysis by Trial Registration Year
- 6.2.3. Analysis by Trial Registration Year and Status
- 6.2.4. Analysis by Trial Phase
- 6.2.5. Analysis by Trial Phase and Patients Enrolled
- 6.2.6. Analysis by Trial Registration Year and Patients Enrolled
- 6.2.7. Analysis by Type of Sponsor / Collaborator
- 6.2.8. Analysis by Type of Study
- 6.2.9. Analysis by Study Design
- 6.2.10. Most Active Industry Players: Analysis by Number of Trials
- 6.2.11. Most Active Non-Industry Players: Analysis by Number of Trials
- 6.2.12. Analysis by Disease Indication
- 6.2.13. Most Popular Therapeutic Areas: Analysis by Number of Trials
- 6.2.14. Analysis by Type of Treatment
- 6.2.15. Analysis by Type of Drug
- 6.2.16. Word Cloud Analysis: Emerging Focus Areas
- 6.2.17. Analysis by Top Indications and Phase of the Trial
- 6.2.18. Analysis by Top Indications and Leading Industry Players
- 6.2.19. Analysis by Trial Location
- 6.2.20. Analysis by Geography and Trial Status
7. PUBLICATION ANALYSIS
- 7.1. Analysis Methodology and Key Parameters
- 7.2. Next Generation Complement Therapeutics: List of Publications
- 7.2.1. Analysis by Year of Publication
- 7.2.2. Word Cloud Analysis: Emerging Focus Areas
- 7.2.3. Top Authors: Analysis by Number of Publications
- 7.2.4. Key Journals based on Number of Publications
- 7.2.5. Key Journals based on Impact Factor
- 7.2.6. Popular Indications based on Number of Publications
- 7.2.7. Popular Therapeutic Areas based on Number of Publications
8. GRANT ANALYSIS
- 8.1. Analysis Methodology and Key Parameters
- 8.1.1. Analysis by Year of Grants Awarded
- 8.1.2. Analysis by Amount Awarded
- 8.1.3. Analysis by Funding Institute Center
- 8.1.4. Analysis by Support Period
- 8.1.5. Analysis by Funding Institute Center and Support Period
- 8.1.6. Analysis by Type of Grant
- 8.1.7. Analysis by Activity Code
- 8.1.8. Popular Recipient Organizations: Analysis by Number of Grants
- 8.1.9. Popular Recipient Organizations: Analysis by Amount Awarded
- 8.1.10. Popular NIH Departments: Analysis by Number of Grants
- 8.1.11. Analysis by Study Section
- 8.1.12. Analysis by Type of Recipient Organization
- 8.1.13. Word Cloud Analysis: Emerging Focus Areas
- 8.1.14. Analysis by Purpose of Grant
- 8.1.15. Prominent Program Officers: Analysis by Number of Grants
- 8.1.16. Analysis by Location of Recipient Organizations
9. PATENT ANALYSIS
- 9.1. Analysis Methodology and Key Parameters
- 9.2. Next Generation Complement Therapeutics: List of Patents
- 9.2.1. Analysis by Patent Publication Year
- 9.2.2. Analysis of Year-wise Granted Patents
- 9.2.3. Analysis by Type of Patent
- 9.2.4. Analysis by Granted Patents and Patent Applications
- 9.2.5. Analysis by Geography
- 9.2.6. Analysis by CPC Symbols
- 9.2.7. Analysis by Type of Applicant
- 9.2.8. Analysis of Patents by Age
- 9.2.9. Word Cloud Analysis: Emerging Focus Areas
- 9.2.10. Leading Industry Players: Analysis by Number of Patents
- 9.2.11. Leading Non-Industry Players: Analysis by Number of Patents
- 9.2.12. Leading Individual Assignees: Analysis by Number of Patents
- 9.2.13. Leading Players: Benchmarking by Patent Characteristics (CPC Symbols)
- 9.2.14. Patent Valuation: Analysis Methodology and Parameters
- 9.2.15. Patent Valuation: Analysis by Relative Valuation
10. PARTNERSHIPS AND COLLABORATIONS
- 10.1. Next Generation Complement Therapeutics: List of Partnerships and Collaborations
- 10.1.1. Analysis by Year-wise Trend of Partnership
- 10.1.2. Analysis by Type of Partnership
- 10.1.3. Analysis by Year and Type of Partnership
- 10.1.4. Most Popular Drug: Analysis by Number of Partnerships
- 10.1.5. Analysis by Biological Target
- 10.1.6. Analysis by Target Pathway
- 10.1.7. Word Cloud Analysis: Emerging Focus Areas
- 10.1.8. Analysis by Drug and Type of Partnership
- 10.1.9. Analysis by Type of Partner
- 10.1.10. Analysis by Popular Disease Indication
- 10.1.11. Analysis by Popular Disease Indication and Type of Partnership
- 10.1.12. Analysis by Therapeutic Area
- 10.1.13. Analysis by Therapeutic Area and Type of Partnership
- 10.1.14. Regional Analysis of Partnerships
- 10.1.15. Intercontinental and Intracontinental Agreements
11. FUNDING AND INVESTMENT ANALYSIS
- 11.1. Next Generation Complement Therapeutics: List of Funding and Investments
- 11.1.1. Cumulative Year-wise Trend
- 11.1.2. Analysis by Amount Invested per Year
- 11.1.3. Analysis by Type of Funding and Year of Establishment
- 11.1.4. Analysis of Instances by Type of Funding
- 11.1.5. Analysis of Amount Invested by Type of Funding
- 11.1.6. Analysis by Year, Type of Funding and Amount Invested
- 11.1.7. Most Active Investors: Analysis by Number of Instances
- 11.1.8. Most Active Players: Analysis by Number of Funding Instances
- 11.1.9. Most Active Players: Analysis by Amount Raised
- 11.1.10. Analysis of Amount by Drug
- 11.1.11. Analysis of Number of Instances by Drug
- 11.1.12. Summary of Investments
12. BIG PHARMA PLAYERS
- 12.1. Analysis Methodology and Key Parameters
- 12.2. Scoring of Parameters
- 12.3. Big Pharma Players: Information on Revenues Generated
- 12.3.1. Analysis by Supplier Strength
- 12.3.2. Analysis by Portfolio Strength
- 12.3.3. Analysis by Portfolio Diversity
- 12.3.4. Benchmarking: Spider Web Analysis
- 12.3.5. Benchmarking: Harvey Ball Analysis
- 12.3.6. Benchmarking: Wind Rose Chart
13. MARKET SIZING AND OPPORTUNITY ANALYSIS
- 13.1. Forecast Methodology and Key Parameters
- 13.2. Global Next Generation Complement Therapeutics Market, Till 2035
- 13.3. Global Next Generation Complement Therapeutics Market for Marketed Drugs, Till 2035
- 13.3.1. Next Generation Complement Therapeutics Market for Marketed Drugs, Till 2035: Distribution by Target Disease Indication
- 13.3.1.1. Next Generation Complement Therapeutics Market for Paroxysmal Nocturnal Hemoglobinuria, Till 2035
- 13.3.1.2. Next Generation Complement Therapeutics Market for Hereditary Angioedema, Till 2035
- 13.3.2. Next Generation Complement Therapeutics Market for Marketed Drugs, Till 2035: Distribution by Type of Molecule
- 13.3.2.1. Next Generation Complement Therapeutics Market for Biologics, Till 2035
- 13.3.2.2. Next Generation Complement Therapeutics Market for Small Molecules, Till 2035
- 13.3.3. Next Generation Complement Therapeutics Market for Marketed Drugs, Till 2035: Distribution by Target Pathway
- 13.3.3.1. Next Generation Complement Therapeutics Market for Terminal Pathway, Till 2035
- 13.3.3.2. Next Generation Complement Therapeutics Market for Classical Pathway, Till 2035
- 13.3.3.3. Next Generation Complement Therapeutics Market for Alternate Pathway, Till 2035
- 13.3.3.4. Next Generation Complement Therapeutics Market for Lectin Pathway, Till 2035
- 13.3.4. Next Generation Complement Therapeutics Market for Marketed Drugs, Till 2035: Distribution by Type of Therapy
- 13.3.4.1. Next Generation Complement Therapeutics Market for Monotherapy, Till 2035
- 13.3.4.2. Next Generation Complement Therapeutics Market for Combination Therapy, Till 2035
- 13.3.5. Next Generation Complement Therapeutics Market for Marketed Drugs, Till 2035: Distribution by Route of Administration
- 13.3.5.1. Next Generation Complement Therapeutics Market for Intravenous Drugs, Till 2035
- 13.3.5.2. Next Generation Complement Therapeutics Market for Subcutaneous Drugs, Till 2035
- 13.3.5.3. Next Generation Complement Therapeutics Market for Oral Drugs, Till 2035
- 13.3.1. Next Generation Complement Therapeutics Market for Marketed Drugs, Till 2035: Distribution by Target Disease Indication
- 13.4. Product-wise Sales Forecast for Marketed Drugs
- 13.4.1. Berinert (CSL Behring)
- 13.4.1.1. Sales Forecast (USD Billion)
- 13.4.2. EMPAVELI (Apellis Pharmaceuticals)
- 13.4.2.1. Sales Forecast (USD Billion)
- 13.4.3. ORLADEYO (BioCryst Pharmaceuticals)
- 13.4.3.1. Sales Forecast (USD Billion)
- 13.4.4. Ruconest (Pharming)
- 13.4.4.1. Sales Forecast (USD Billion)
- 13.4.5. Soliris (Alexion Pharmaceuticals)
- 13.4.5.1. Sales Forecast (USD Billion)
- 13.4.6. Takhzyro (Takeda)
- 13.4.6.1. Sales Forecast (USD Billion)
- 13.4.7. Ultomiris (Alexion Pharmaceuticals)
- 13.4.7.1. Sales Forecast (USD Billion)
- 13.4.1. Berinert (CSL Behring)
- 13.5. Global Next Generation Complement Therapeutics Market for Phase III Drugs, Till 2035
- 13.5.1. Next Generation Complement Therapeutics Market for Phase III Drugs, Till 2035: Distribution by Target Disease Indication
- 13.5.1.1. Next Generation Complement Therapeutics Market for Atypical Hemolytic Uremic Syndrome, Till 2035
- 13.5.1.2. Next Generation Complement Therapeutics Market for Cardiac Transplantation Rejection, Till 2035
- 13.5.1.3. Next Generation Complement Therapeutics Market for Cold Agglutinin Disease, Till 2035
- 13.5.1.4. Next Generation Complement Therapeutics Market for COVID-19, Till 2035
- 13.5.1.5. Next Generation Complement Therapeutics Market for Guillain-Barre Syndrome, Till 2035
- 13.5.1.6. Next Generation Complement Therapeutics Market for Generalized Myasthenia Gravis, Till 2035
- 13.5.1.7. Next Generation Complement Therapeutics Market for Neuromyelitis Optica, Till 2035
- 13.5.1.8. Next Generation Complement Therapeutics Market for Paroxysmal Nocturnal Hemoglobinuria, Till 2035
- 13.5.2. Next Generation Complement Therapeutics Market for Phase III Drugs, Till 2035: Distribution by Therapeutic Area
- 13.5.2.1. Next Generation Complement Therapeutics Market for Cardiovascular Disorders, Till 2035
- 13.5.2.2. Next Generation Complement Therapeutics Market for Hematological and Vascular Disorders, Till 2035
- 13.5.2.3. Next Generation Complement Therapeutics Market for Infectious Diseases, Till 2035
- 13.5.2.4. Next Generation Complement Therapeutics Market for Neurological Disorders, Till 2035
- 13.5.2.5. Next Generation Complement Therapeutics Market for Neuromuscular Disorders, Till 2035
- 13.5.2.6. Next Generation Complement Therapeutics Market for Genetic Disorders, Till 2035
- 13.5.3. Next Generation Complement Therapeutics Market for Phase III Drugs, Till 2035: Distribution by Target Pathway
- 13.5.3.1. Next Generation Complement Therapeutics Market for Terminal Pathway, Till 2035
- 13.5.3.2. Next Generation Complement Therapeutics Market for Lectin Pathway, Till 2035
- 13.5.3.3. Next Generation Complement Therapeutics Market for Classical Pathway, Till 2035
- 13.5.4. Next Generation Complement Therapeutics Market for Phase III Drugs, Till 2035: Distribution by Type of Therapy
- 13.5.4.1. Next Generation Complement Therapeutics Market for Monotherapy, Till 2035
- 13.5.4.2. Next Generation Complement Therapeutics Market for Combination Therapy, Till 2035
- 13.5.5. Next Generation Complement Therapeutics Market for Phase III Drugs, Till 2035: Distribution by Route of Administration
- 13.5.5.1. Next Generation Complement Therapeutics Market for Intravenous Drugs, Till 2035
- 13.5.5.2. Next Generation Complement Therapeutics Market for Subcutaneous Drugs, Till 2035
- 13.5.6. Next Generation Complement Therapeutics Market for Phase III Drugs, Till 2035: Distribution by Geography
- 13.5.6.1. Next Generation Complement Therapeutics Market in North America, Till 2035
- 13.5.6.1.1. Next Generation Complement Therapeutics Market in US, Till 2035
- 13.5.6.1.2. Next Generation Complement Therapeutics Market in Canada, Till 2035
- 13.5.6.2. Next Generation Complement Therapeutics Market in Europe, Till 2035
- 13.5.6.2.1. Next Generation Complement Therapeutics Market in UK, Till 2035
- 13.5.6.2.2. Next Generation Complement Therapeutics Market in Germany, Till 2035
- 13.5.6.2.3. Next Generation Complement Therapeutics Market in France, Till 2035
- 13.5.6.2.4. Next Generation Complement Therapeutics Market in Italy, Till 2035
- 13.5.6.2.5. Next Generation Complement Therapeutics Market in Spain, Till 2035
- 13.5.6.3. Next Generation Complement Therapeutics Market in Asia Pacific, Till 2035
- 13.5.6.3.1. Next Generation Complement Therapeutics Market in Australia, Till 2035
- 13.5.6.3.2. Next Generation Complement Therapeutics Market in Japan, Till 2035
- 13.5.6.3.3. Next Generation Complement Therapeutics Market in China, Till 2035
- 13.5.6.3.4. Next Generation Complement Therapeutics Market in India, Till 2035
- 13.5.6.1. Next Generation Complement Therapeutics Market in North America, Till 2035
- 13.5.1. Next Generation Complement Therapeutics Market for Phase III Drugs, Till 2035: Distribution by Target Disease Indication
- 13.6. Product-wise Sales Forecast for Phase III Drugs
- 13.6.1. Narsoplimab (Omeros)
- 13.6.1.1. Target Patient Population
- 13.6.1.2. Sales Forecast (USD Billion)
- 13.6.1.3. Net Present Value (USD Billion)
- 13.6.1.4. Value Creation Analysis
- 13.6.2. REGN3918 (Regeneron)
- 13.6.2.1. Target Patient Population
- 13.6.2.2. Sales Forecast (USD Billion)
- 13.6.2.3. Net Present Value (USD Billion)
- 13.6.2.4. Value Creation Analysis
- 13.6.3. RG6107 (Ruconest)
- 13.6.3.1. Target Patient Population
- 13.6.3.2. Sales Forecast (USD Billion)
- 13.6.3.3. Net Present Value (USD Billion)
- 13.6.3.4. Value Creation Analysis
- 13.6.4. rVA576 (Akari Therapeutics)
- 13.6.4.1. Target Patient Population
- 13.6.4.2. Sales Forecast (USD Billion)
- 13.6.4.3. Net Present Value (USD Billion)
- 13.6.4.4. Value Creation Analysis
- 13.6.5. SAR445088 (Sanofi)
- 13.6.5.1. Target Patient Population
- 13.6.5.2. Sales Forecast (USD Billion)
- 13.6.5.3. Net Present Value (USD Billion)
- 13.6.5.4. Value Creation Analysis
- 13.6.6. Soliris (Alexion Pharmaceuticals)
- 13.6.6.1. Target Patient Population
- 13.6.6.2. Sales Forecast (USD Billion)
- 13.6.6.3. Net Present Value (USD Billion)
- 13.6.6.4. Value Creation Analysis
- 13.6.7. Sutimlimab (Bioverativ)
- 13.6.7.1. Target Patient Population
- 13.6.7.2. Sales Forecast (USD Billion)
- 13.6.7.3. Net Present Value (USD Billion)
- 13.6.7.4. Value Creation Analysis
- 13.6.8. Vilobelimab (InflaRx)
- 13.6.8.1. Target Patient Population
- 13.6.8.2. Sales Forecast (USD Billion)
- 13.6.8.3. Net Present Value (USD Billion)
- 13.6.8.4. Value Creation Analysis
- 13.6.9. Zilucoplan (UCB)
- 13.6.9.1. Target Patient Population
- 13.6.9.2. Sales Forecast (USD Billion)
- 13.6.9.3. Net Present Value (USD Billion)
- 13.6.9.4. Value Creation Analysis
- 13.6.1. Narsoplimab (Omeros)
- 13.7. Summary: Phase III Drugs
14. EXPERT OPINION
- 14.1. Company A
- 14.1.1. Overview of Organization
- 14.1.2. Expert Opinion: Physician
- 14.2. Company B
- 14.2.1. Overview of Organization
- 14.2.2. Expert Opinion: Hematologist Oncologist
- 14.3. Company C
- 14.3.1. Overview of Organization
- 14.3.2. Expert Opinion: Senior Scientific Consultant
- 14.4. Company D
- 14.4.1. Overview of Organization
- 14.4.2. Expert Opinion: Nephrology Clinician-Scientist
- 14.5. Company E
- 14.5.1. Overview of Organization
- 14.5.2. Expert Opinion: Professor of Nephrology
15. APPENDIX 1: LIST OF FIGURES AND TABLES
16. APPNEDIX 2: LIST OF COMPANIES AND ORGANIZATIONS
List of Tables
- Table 3.1 Sources of Key Complement Proteins
- Table 3.2 Functions of Complement Proteins of Classical Pathway
- Table 3.3 Diseases Related to Defects in Complement Proteins
- Table 4.1 Next Generation Complement Therapeutics: Development Pipeline
- Table 4.2 List of Drugs with Special Designations
- Table 4.3 Next Generation Complement Therapeutics: List of Developers
- Table 5.1 Amgen: Product Portfolio
- Table 5.2 Recent Developments and Future Outlook
- Table 5.3 CSL Behring: Product Portfolio
- Table 5.4 Recent Developments and Future Outlook
- Table 5.5 Innovent Biologics: Product Portfolio
- Table 5.6 Recent Developments and Future Outlook
- Table 5.7 Novartis: Product Portfolio
- Table 5.8 Recent Developments and Future Outlook
- Table 5.9 Regeneron: Product Portfolio
- Table 5.10 Recent Developments and Future Outlook
- Table 5.11 Roche: Product Portfolio
- Table 5.12 Recent Developments and Future Outlook
- Table 5.13 Sanofi: Product Portfolio
- Table 5.14 Recent Developments and Future Outlook
- Table 5.15 Takeda: Product Portfolio
- Table 5.16 Recent Developments and Future Outlook
- Table 5.17 UCB: Product Portfolio
- Table 5.18 Recent Developments and Future Outlook
- Table 6.1 Next Generation Complement Therapeutics: List of Clinical Trials
- Table 7.1 Next Generation Complement Therapeutics: List of Publications
- Table 9.1 Next Generation Complement Therapeutics: List of Patents
- Table 10.1 Next Generation Complement Therapeutics: List of Partnerships and Collaborations, Since 2014
- Table 11.1 Next Generation Complement Therapeutics: List of Funding and Investments
- Table 12.1 Big Pharma Players: Information on Revenues Generated
- Table 13.1 Next Generation Complement Therapeutics: List of Forecasted Marketed Drugs
- Table 13.2 Next Generation Complement Therapeutics: List of Forecasted Phase III Drugs
- Table 13.3 Summary: Phase III Drugs
- Table 15.1 Global Next Generation Complement Therapeutics Market, Till 2035 (USD Billion)
- Table 15.2 Global Next Generation Complement Therapeutics Market for Marketed Drugs, Till 2035 (USD Billion)
- Table 15.3 Next Generation Complement Therapeutics Market for Marketed Drugs, Till 2035 (USD Billion): Distribution by Target Disease Indication
- Table 15.4 Next Generation Complement Therapeutics Market for Paroxysmal Nocturnal Hemoglobinuria, Till 2035 (USD Billion)
- Table 15.5 Next Generation Complement Therapeutics Market for Hereditary Angioedema, Till 2035 (USD Billion)
- Table 15.6 Next Generation Complement Therapeutics Market for Marketed Drugs, Till 2035 (USD Billion): Distribution by Type of Molecule
- Table 15.7 Next Generation Complement Therapeutics Market for Biologics, Till 2035 (USD Billion)
- Table 15.8 Next Generation Complement Therapeutics Market for Small Molecules, Till 2035 (USD Billion)
- Table 15.9 Next Generation Complement Therapeutics Market for Marketed Drugs, Till 2035 (USD Billion): Distribution by Target Pathway
- Table 15.10 Next Generation Complement Therapeutics Market for Terminal Pathway, Till 2035 (USD Billion)
- Table 15.11 Next Generation Complement Therapeutics Market for Classical Pathway, Till 2035 (USD Billion)
- Table 15.12 Next Generation Complement Therapeutics Market for Alternate Pathway, Till 2035 (USD Billion)
- Table 15.15 Next Generation Complement Therapeutics Market for Lectin Pathway, Till 2035 (USD Billion)
- Table 15.14 Next Generation Complement Therapeutics Market for Marketed Drugs, Till 2035 (USD Billion): Distribution by Type of Therapy
- Table 15.15 Next Generation Complement Therapeutics Market for Monotherapy, Till 2035 (USD Billion)
- Table 15.16 Next Generation Complement Therapeutics Market for Combination Therapy, Till 2035 (USD Billion)
- Table 15.17 Next Generation Complement Therapeutics Market for Marketed Drugs, Till 2035 (USD Billion): Distribution by Route of Administration
- Table 15.18 Next Generation Complement Therapeutics Market for Intravenous Drugs, Till 2035 (USD Billion)
- Table 15.19 Next Generation Complement Therapeutics Market for Subcutaneous Drugs, Till 2035 (USD Billion)
- Table 15.20 Next Generation Complement Therapeutics Market for Oral Drugs, Till 2035 (USD Billion)
- Table 15.21 Berinert Sales Forecast, Till 2035 (USD Billion)
- Table 15.22 EMPAVELI Sales Forecast, Till 2035 (USD Billion)
- Table 15.23 ORLADEYO Sales Forecast, Till 2035 (USD Billion)
- Table 15.24 Ruconest Sales Forecast, Till 2035 (USD Billion)
- Table 15.25 Soliris Sales Forecast, Till 2035 (USD Billion)
- Table 15.26 Takhzyro Sales Forecast, Till 2035 (USD Billion)
- Table 15.27 Ultomiris Sales Forecast, Till 2035 (USD Billion)
- Table 15.28 Global Next Generation Complement Therapeutics Market for Phase III Drugs, Till 2035 (USD Billion)
- Table 15.29 Next Generation Complement Therapeutics Market for Phase III Drugs, Till 2035 (USD Billion): Distribution by Target Disease Indication
- Table 15.30 Next Generation Complement Therapeutics Market for Atypical Hemolytic Uremic Syndrome, Till 2035 (USD Billion)
- Table 15.31 Next Generation Complement Therapeutics Market for Cardiac Transplantation Rejection, Till 2035 (USD Billion)
- Table 15.32 Next Generation Complement Therapeutics Market for Cold Agglutinin Disease, Till 2035 (USD Billion)
- Table 15.33 Next Generation Complement Therapeutics Market for COVID-19, Till 2035 (USD Billion)
- Table 15.34 Next Generation Complement Therapeutics Market for Guillain-Barre Syndrome, Till 2035 (USD Billion)
- Table 15.35 Next Generation Complement Therapeutics Market for Generalized Myasthenia Gravis, Till 2035 (USD Billion)
- Table 15.36 Next Generation Complement Therapeutics Market for Neuromyelitis Optica, Till 2035 (USD Billion)
- Table 15.37 Next Generation Complement Therapeutics Market for Paroxysmal Nocturnal Hemoglobinuria, Till 2035 (USD Billion)
- Table 15.38 Next Generation Complement Therapeutics Market for Phase III Drugs, Till 2035 (USD Billion): Distribution by Therapeutic Area
- Table 15.39 Next Generation Complement Therapeutics Market for Cardiovascular Disorders, Till 2035 (USD Billion)
- Table 15.40 Next Generation Complement Therapeutics Market for Hematological and Vascular Disorders, Till 2035 (USD Billion)
- Table 15.41 Next Generation Complement Therapeutics Market for Infectious Diseases, Till 2035 (USD Billion)
- Table 15.42 Next Generation Complement Therapeutics Market for Neurological Disorders, Till 2035 (USD Billion)
- Table 15.43 Next Generation Complement Therapeutics Market for Neuromuscular Disorders, Till 2035 (USD Billion)
- Table 15.44 Next Generation Complement Therapeutics Market for Genetic Disorders, Till 2035 (USD Billion)
- Table 15.45 Next Generation Complement Therapeutics Market for Phase III Drugs, Till 2035 (USD Billion): Distribution by Target Pathway
- Table 15.46 Next Generation Complement Therapeutics Market for Terminal Pathway, Till 2035 (USD Billion)
- Table 15.47 Next Generation Complement Therapeutics Market for Lectin Pathway, Till 2035 (USD Billion)
- Table 15.48 Next Generation Complement Therapeutics Market for Classical Pathway, Till 2035 (USD Billion)
- Table 15.49 Next Generation Complement Therapeutics Market for Phase III Drugs, Till 2035 (USD Billion): Distribution by Type of Therapy
- Table 15.50 Next Generation Complement Therapeutics Market for Monotherapy, Till 2035 (USD Billion)
- Table 15.51 Next Generation Complement Therapeutics Market for Combination Therapy, Till 2035 (USD Billion)
- Table 15.52 Next Generation Complement Therapeutics Market for Phase III Drugs, Till 2035 (USD Billion): Distribution by Route of Administration
- Table 15.53 Next Generation Complement Therapeutics Market for Intravenous Drugs, Till 2035 (USD Billion)
- Table 15.54 Next Generation Complement Therapeutics Market for Subcutaneous Drugs, Till 2035 (USD Billion)
- Table 15.55 Next Generation Complement Therapeutics Market for Phase III Drugs, Till 2035 (USD Billion): Distribution by Geography
- Table 15.56 Next Generation Complement Therapeutics Market in North America, Till 2035 (USD Billion)
- Table 15.57 Next Generation Complement Therapeutics Market in US, Till 2035 (USD Billion)
- Table 15.58 Next Generation Complement Therapeutics Market in Canada, Till 2035 (USD Billion)
- Table 15.59 Next Generation Complement Therapeutics Market in Europe, Till 2035 (USD Billion)
- Table 15.60 Next Generation Complement Therapeutics Market in UK, Till 2035 (USD Billion)
- Table 15.61 Next Generation Complement Therapeutics Market in Germany, Till 2035 (USD Billion)
- Table 15.62 Next Generation Complement Therapeutics Market in France, Till 2035 (USD Billion)
- Table 15.63 Next Generation Complement Therapeutics Market in Italy, Till 2035 (USD Billion)
- Table 15.64 Next Generation Complement Therapeutics Market in Spain, Till 2035 (USD Billion)
- Table 15.65 Next Generation Complement Therapeutics Market in Asia Pacific, Till 2035 (USD Billion)
- Table 15.66 Next Generation Complement Therapeutics Market in Australia, Till 2035 (USD Billion)
- Table 15.67 Next Generation Complement Therapeutics Market in Japan, Till 2035 (USD Billion)
- Table 15.68 Next Generation Complement Therapeutics Market in China, Till 2035 (USD Billion)
- Table 15.69 Next Generation Complement Therapeutics Market in India, Till 2035 (USD Billion)
- Table 15.70 Narsoplimab: Target Patient Population
- Table 15.71 Narsoplimab Sales Forecast, Till 2035 (USD Billion)
- Table 15.72 REGN3918: Target Patient Population
- Table 15.73 REGN3918 Sales Forecast, Till 2035 (USD Billion)
- Table 15.74 RG6107: Target Patient Population
- Table 15.75 RG6107 Sales Forecast, Till 2035 (USD Billion)
- Table 15.76 rVA576: Target Patient Population
- Table 15.77 rVA576 Sales Forecast, Till 2035 (USD Billion)
- Table 15.78 SAR445088: Target Patient Population
- Table 15.79 SAR445088 Sales Forecast, Till 2035 (USD Billion)
- Table 15.80 Soliris: Target Patient Population
- Table 15.81 Soliris Sales Forecast, Till 2035 (USD Billion)
- Table 15.82 Sutimlimab: Target Patient Population
- Table 15.83 Sutimlimab Sales Forecast, Till 2035 (USD Billion)
- Table 15.84 Vilobelimab: Target Patient Population
- Table 15.85 Vilobelimab Sales Forecast, Till 2035 (USD Billion)
- Table 15.86 Zilucoplan: Target Patient Population
- Table 15.87 Zilucoplan Sales Forecast, Till 2035 (USD Billion)
List of Figures
- Figure 3.1 Immune Cells Involved in Complement System
- Figure 3.2 Role of Complement in Homeostasis and Stress Conditions
- Figure 3.3 Activation of Complement System
- Figure 3.4 Steps in Complement Activation
- Figure 3.5 Pathways of Complement System
- Figure 3.6 Consequences of a Dysregulated Complement System
- Figure 3.7 Types of Complement Therapeutics
- Figure 3.8 Limitations of Complement Therapeutics
- Figure 3.9 Future of Next Generation Complement Therapeutics
- Figure 4.1 Next Generation Complement Therapeutics: Distribution by Status of Development
- Figure 4.2 Next Generation Complement Therapeutics: Distribution by Type of Molecule
- Figure 4.3 Next Generation Complement Therapeutics: Distribution by Status of Development and Type of Molecule
- Figure 4.4 Next Generation Complement Therapeutics: Distribution by Type of Drug
- Figure 4.5 Next Generation Complement Therapeutics: Distribution by Biological Target
- Figure 4.6 Next Generation Complement Therapeutics: Distribution by Target Pathway
- Figure 4.7 Next Generation Complement Therapeutics: Distribution by Mechanism of Action
- Figure 4.8 Next Generation Complement Therapeutics: Distribution by Mechanism of Action and Target Pathway
- Figure 4.9 Next Generation Complement Therapeutics: Distribution by Target Disease Indication(s)
- Figure 4.10 Next Generation Complement Therapeutics: Distribution by Status of Development and Target Disease Indication(s)
- Figure 4.11 Next Generation Complement Therapeutics: Distribution by Therapeutic Area
- Figure 4.12 Next Generation Complement Therapeutics: Distribution by Therapeutic Area and Type of Molecule
- Figure 4.13 Next Generation Complement Therapeutics: Distribution by Route of Administration
- Figure 4.14 Next Generation Complement Therapeutics: Distribution by Type of Therapy
- Figure 4.15 Next Generation Complement Therapeutics: Distribution by Dosing Frequency
- Figure 4.16 Grid Analysis: Distribution by Type of Therapy, Type of Molecule, Route of Administration and Mechanism of Action
- Figure 4.17 Next Generation Complement Therapeutics: Distribution by Special Designation
- Figure 4.18 Next Generation Complement Therapeutics Developers: Distribution by Year of Establishment
- Figure 4.19 Next Generation Complement Therapeutics Developers: Distribution by Company Size
- Figure 4.20 Next Generation Complement Therapeutics Developers: Distribution by Region of Headquarters
- Figure 4.21 Next Generation Complement Therapeutics Developers: Distribution by Company Size and Region of Headquarters
- Figure 4.22 Leading Players: Distribution by Number of Therapeutics
- Figure 5.1 Amgen: Financial Information
- Figure 5.2 CSL Behring: Financial Information
- Figure 5.3 Innovent Biologics: Financial Information
- Figure 5.4 Novartis: Financial Information
- Figure 5.5 Regeneron: Financial Information
- Figure 5.6 Roche: Financial Information
- Figure 5.7 Sanofi: Financial Information
- Figure 5.8 Takeda: Financial Information
- Figure 5.9 UCB: Financial Information
- Figure 6.1 Clinical Trial Analysis: Distribution by Trial Status
- Figure 6.2 Clinical Trial Analysis: Cumulative Distribution by Trial Registration Year, Since Pre-2016
- Figure 6.3 Clinical Trial Analysis: Distribution by Trial Registration Year and Status, Since Pre-2001
- Figure 6.4 Clinical Trial Analysis: Distribution by Trial Phase
- Figure 6.5 Clinical Trial Analysis: Distribution by Trial Phase and Patients Enrolled
- Figure 6.6 Clinical Trial Analysis: Distribution by Trial Registration Year and Patients Enrolled
- Figure 6.7 Clinical Trial Analysis: Distribution by Type of Sponsor / Collaborator
- Figure 6.8 Clinical Trial Analysis: Distribution by Type of Study
- Figure 6.9 Clinical Trial Analysis: Distribution by Study Design
- Figure 6.10 Most Active Industry Players: Distribution by Number of Trials
- Figure 6.11 Most Active Non-Industry Players: Distribution by Number of Trials
- Figure 6.12 Clinical Trial Analysis: Distribution by Disease Indication
- Figure 6.13 Most Popular Therapeutic Areas: Distribution by Number of Trials
- Figure 6.14 Clinical Trial Analysis: Distribution by Type of Treatment
- Figure 6.15 Clinical Trial Analysis: Distribution by Type of Drug
- Figure 6.16 Word Cloud Analysis: Emerging Focus Areas
- Figure 6.17 Clinical Trial Analysis: Distribution by Top Indications and Phase of the Trial
- Figure 6.18 Clinical Trial Analysis: Distribution by Top Indications and Leading Industry Players
- Figure 6.19 Clinical Trial Analysis: Distribution by Trial Location
- Figure 6.20 Clinical Trial Analysis: Distribution by Geography and Trial Status
- Figure 7.1 Publication Analysis: Distribution by Year of Publication
- Figure 7.2 Word Cloud Analysis: Emerging Focus Areas
- Figure 7.3 Top Authors: Distribution by Number of Publications
- Figure 7.4 Key Journals: Distribution by Number of Publications
- Figure 7.5 Key Journals: Distribution by Impact Factor
- Figure 7.6 Popular Indications: Distribution by Number of Publications
- Figure 7.7 Popular Therapeutic Areas: Distribution by Number of Publications
- Figure 8.1 Grant Analysis: Distribution by Year of Grants Awarded
- Figure 8.2 Grant Analysis: Distribution by Amount Awarded
- Figure 8.3 Grant Analysis: Distribution by Funding Institute Center
- Figure 8.4 Grant Analysis: Distribution by Support Period
- Figure 8.5 Grant Analysis: Distribution by Funding Institute Center and Support Period
- Figure 8.6 Grant Analysis: Distribution by Type of Grant
- Figure 8.7 Grant Analysis: Distribution by Activity Code
- Figure 8.8 Popular Recipient Organizations: Distribution by Number of Grants
- Figure 8.9 Popular Recipient Organizations: Distribution by Amount Awarded
- Figure 8.10 Popular NIH Departments: Distribution by Number of Grants
- Figure 8.11 Grant Analysis: Distribution by Study Section
- Figure 8.12 Grant Analysis: Distribution by Type of Recipient Organization
- Figure 8.13 Word Cloud Analysis: Emerging Focus Areas
- Figure 8.14 Grants Analysis: Distribution by Purpose of Grant
- Figure 8.15 Prominent Program Officers: Distribution by Number of Grants
- Figure 8.16 Grant Analysis: Distribution by Location of Recipient Organizations
- Figure 9.1 Patent Analysis: Distribution by Patent Publication Year
- Figure 9.2 Patent Analysis: Year-wise Distribution of Granted Patents
- Figure 9.3 Patent Analysis: Distribution by Type of Patent
- Figure 9.4 Patent Analysis: Distribution by Granted Patents and Patent Applications
- Figure 9.5 Patent Analysis: Distribution by Geography
- Figure 9.6 Patent Analysis: Distribution by CPC Symbols
- Figure 9.7 Patent Analysis: Distribution by Type of Applicant
- Figure 9.8 Patent Analysis: Distribution of Patents by Age
- Figure 9.9 Word Cloud Analysis: Emerging Focus Areas
- Figure 9.10 Leading Industry Players: Distribution by Number of Patents
- Figure 9.11 Leading Non-Industry Players: Distribution by Number of Patents
- Figure 9.12 Leading Individual Assignees: Distribution by Number of Patents
- Figure 9.13 Leading Players: Benchmarking by Patent Characteristics (CPC Symbols)
- Figure 9.14 Patent Valuation: Distribution by Relative Valuation
- Figure 10.1 Partnerships and Collaborations: Distribution by Year-wise Trend of Partnership
- Figure 10.2 Partnerships and Collaborations: Distribution by Type of Partnership
- Figure 10.3 Partnerships and Collaborations: Distribution by Year and Type of Partnership
- Figure 10.4 Most Popular Drug: Distribution by Number of Partnerships
- Figure 10.5 Partnerships and Collaborations: Distribution by Biological Target
- Figure 10.6 Partnerships and Collaborations: Distribution by Target Pathway
- Figure 10.7 Word Cloud Analysis: Emerging Focus Areas
- Figure 10.8 Partnerships and Collaborations: Distribution by Drug and Type of Partnership
- Figure 10.9 Partnerships and Collaborations: Distribution by Type of Partner
- Figure 10.10 Partnerships and Collaborations: Distribution by Popular Disease Indication
- Figure 10.11 Partnerships and Collaborations: Distribution by Popular Disease Indication and Type of Partnership
- Figure 10.12 Partnerships and Collaborations: Distribution by Therapeutic Area
- Figure 10.13 Partnerships and Collaborations: Distribution by Therapeutic Area and Type of Partnership
- Figure 10.14 Regional Distribution of Partnerships
- Figure 10.15 Intercontinental and Intracontinental Agreements
- Figure 11.1 Funding and Investments: Cumulative Year-wise Trend
- Figure 11.2 Funding and Investments: Distribution by Amount Invested per Year
- Figure 11.3 Funding and Investments: Distribution by Type of Funding and Year of Establishment
- Figure 11.4 Funding and Investments: Distribution of Instances by Type of Funding
- Figure 11.5 Funding and Investments: Distribution of Amount Invested by Type of Funding
- Figure 11.6 Funding and Investments: Distribution by Year, Type of Funding and Amount Invested
- Figure 11.7 Most Active Investors: Distribution by Number of Instances
- Figure 11.8 Most Active Players: Distribution by Number of Funding Instances
- Figure 11.9 Most Active Players: Distribution by Amount Raised
- Figure 11.10 Funding and Investments: Distribution of Amount by Drug
- Figure 11.11 Funding and Investments: Distribution of Number of Instances by Drug
- Figure 11.12 Funding and Investments: Summary of Investments
- Figure 12.1 Distribution by Supplier Strength
- Figure 12.2 Distribution by Portfolio Strength
- Figure 12.3 Distribution by Portfolio Diversity
- Figure 12.4 Benchmarking: Spider Web Analysis
- Figure 12.5 Benchmarking: Harvey Ball Analysis
- Figure 12.6 Benchmarking: Wind Rose Chart
- Figure 13.1 Global Next Generation Complement Therapeutics Market, Till 2035 (USD Billion)
- Figure 13.2 Global Next Generation Complement Therapeutics Market for Marketed Drugs, Till 2035 (USD Billion)
- Figure 13.3 Next Generation Complement Therapeutics Market for Marketed Drugs, Till 2035 (USD Billion): Distribution by Target Disease Indication
- Figure 13.4 Next Generation Complement Therapeutics Market for Paroxysmal Nocturnal Hemoglobinuria, Till 2035 (USD Billion)
- Figure 13.5 Next Generation Complement Therapeutics Market for Hereditary Angioedema, Till 2035 (USD Billion)
- Figure 13.6 Next Generation Complement Therapeutics Market for Marketed Drugs, Till 2035 (USD Billion): Distribution by Type of Molecule
- Figure 13.7 Next Generation Complement Therapeutics Market for Biologics, Till 2035 (USD Billion)
- Figure 13.8 Next Generation Complement Therapeutics Market for Small Molecules, Till 2035 (USD Billion)
- Figure 13.9 Next Generation Complement Therapeutics Market for Marketed Drugs, Till 2035 (USD Billion): Distribution by Target Pathway
- Figure 13.10 Next Generation Complement Therapeutics Market for Terminal Pathway, Till 2035 (USD Billion)
- Figure 13.11 Next Generation Complement Therapeutics Market for Classical Pathway, Till 2035 (USD Billion)
- Figure 13.12 Next Generation Complement Therapeutics Market for Alternate Pathway, Till 2035 (USD Billion)
- Figure 13.13 Next Generation Complement Therapeutics Market for Lectin Pathway, Till 2035 (USD Billion)
- Figure 13.14 Next Generation Complement Therapeutics Market for Marketed Drugs, Till 2035 (USD Billion): Distribution by Type of Therapy
- Figure 13.15 Next Generation Complement Therapeutics Market for Monotherapy, Till 2035 (USD Billion)
- Figure 13.16 Next Generation Complement Therapeutics Market for Combination Therapy, Till 2035 (USD Billion)
- Figure 13.17 Next Generation Complement Therapeutics Market for Marketed Drugs, Till 2035 (USD Billion): Distribution by Route of Administration
- Figure 13.18 Next Generation Complement Therapeutics Market for Intravenous Drugs, Till 2035 (USD Billion)
- Figure 13.19 Next Generation Complement Therapeutics Market for Subcutaneous Drugs, Till 2035 (USD Billion)
- Figure 13.20 Next Generation Complement Therapeutics Market for Oral Drugs, Till 2035 (USD Billion)
- Figure 13.21 Berinert Sales Forecast, Till 2035 (USD Billion)
- Figure 13.22 EMPAVELI Sales Forecast, Till 2035 (USD Billion)
- Figure 13.23 ORLADEYO Sales Forecast, Till 2035 (USD Billion)
- Figure 13.24 Ruconest Sales Forecast, Till 2035 (USD Billion)
- Figure 13.25 Soliris Sales Forecast, Till 2035 (USD Billion)
- Figure 13.26 Takhzyro Sales Forecast, Till 2035 (USD Billion)
- Figure 13.27 Ultomiris Sales Forecast, Till 2035 (USD Billion)
- Figure 13.28 Global Next Generation Complement Therapeutics Market for Phase III Drugs, Till 2035 (USD Billion)
- Figure 13.29 Next Generation Complement Therapeutics Market for Phase III Drugs, Till 2035 (USD Billion): Distribution by Target Disease Indication
- Figure 13.30 Next Generation Complement Therapeutics Market for Atypical Hemolytic Uremic Syndrome, Till 2035 (USD Billion)
- Figure 13.31 Next Generation Complement Therapeutics Market for Cardiac Transplantation Rejection, Till 2035 (USD Billion)
- Figure 13.32 Next Generation Complement Therapeutics Market for Cold Agglutinin Disease, Till 2035 (USD Billion)
- Figure 13.33 Next Generation Complement Therapeutics Market for COVID-19, Till 2035 (USD Billion)
- Figure 13.34 Next Generation Complement Therapeutics Market for Guillain-Barre Syndrome, Till 2035 (USD Billion)
- Figure 13.35 Next Generation Complement Therapeutics Market for Generalized Myasthenia Gravis, Till 2035 (USD Billion)
- Figure 13.36 Next Generation Complement Therapeutics Market for Neuromyelitis Optica, Till 2035 (USD Billion)
- Figure 13.37 Next Generation Complement Therapeutics Market for Paroxysmal Nocturnal Hemoglobinuria, Till 2035 (USD Billion)
- Figure 13.38 Next Generation Complement Therapeutics Market for Phase III Drugs, Till 2035 (USD Billion): Distribution by Therapeutic Area
- Figure 13.39 Next Generation Complement Therapeutics Market for Cardiovascular Disorders, Till 2035 (USD Billion)
- Figure 13.40 Next Generation Complement Therapeutics Market for Hematological and Vascular Disorders, Till 2035 (USD Billion)
- Figure 13.41 Next Generation Complement Therapeutics Market for Infectious Diseases, Till 2035 (USD Billion)
- Figure 13.42 Next Generation Complement Therapeutics Market for Neurological Disorders, Till 2035 (USD Billion)
- Figure 13.43 Next Generation Complement Therapeutics Market for Neuromuscular Disorders, Till 2035 (USD Billion)
- Figure 13.44 Next Generation Complement Therapeutics Market for Genetic Disorders, Till 2035 (USD Billion)
- Figure 13.45 Next Generation Complement Therapeutics Market for Phase III Drugs, Till 2035 (USD Billion): Distribution by Target Pathway
- Figure 13.46 Next Generation Complement Therapeutics Market for Terminal Pathway, Till 2035 (USD Billion)
- Figure 13.47 Next Generation Complement Therapeutics Market for Lectin Pathway, Till 2035 (USD Billion)
- Figure 13.48 Next Generation Complement Therapeutics Market for Classical Pathway, Till 2035 (USD Billion)
- Figure 13.49 Next Generation Complement Therapeutics Market for Phase III Drugs, Till 2035 (USD Billion): Distribution by Type of Therapy
- Figure 13.50 Next Generation Complement Therapeutics Market for Monotherapy, Till 2035 (USD Billion)
- Figure 13.51 Next Generation Complement Therapeutics Market for Combination Therapy, Till 2035 (USD Billion)
- Figure 13.52 Next Generation Complement Therapeutics Market for Phase III Drugs, Till 2035 (USD Billion): Distribution by Route of Administration
- Figure 13.53 Next Generation Complement Therapeutics Market for Intravenous Drugs, Till 2035 (USD Billion)
- Figure 13.54 Next Generation Complement Therapeutics Market for Subcutaneous Drugs, Till 2035 (USD Billion)
- Figure 13.55 Next Generation Complement Therapeutics Market for Phase III Drugs, Till 2035 (USD Billion): Distribution by Geography
- Figure 13.56 Next Generation Complement Therapeutics Market in North America, Till 2035 (USD Billion)
- Figure 13.57 Next Generation Complement Therapeutics Market in US, Till 2035 (USD Billion)
- Figure 13.58 Next Generation Complement Therapeutics Market in Canada, Till 2035 (USD Billion)
- Figure 13.59 Next Generation Complement Therapeutics Market in Europe, Till 2035 (USD Billion)
- Figure 13.60 Next Generation Complement Therapeutics Market in UK, Till 2035 (USD Billion)
- Figure 13.61 Next Generation Complement Therapeutics Market in Germany, Till 2035 (USD Billion)
- Figure 13.62 Next Generation Complement Therapeutics Market in France, Till 2035 (USD Billion)
- Figure 13.63 Next Generation Complement Therapeutics Market in Italy, Till 2035 (USD Billion)
- Figure 13.64 Next Generation Complement Therapeutics Market in Spain, Till 2035 (USD Billion)
- Figure 13.65 Next Generation Complement Therapeutics Market in Asia Pacific, Till 2035 (USD Billion)
- Figure 13.66 Next Generation Complement Therapeutics Market in Australia, Till 2035 (USD Billion)
- Figure 13.67 Next Generation Complement Therapeutics Market in Japan, Till 2035 (USD Billion)
- Figure 13.68 Next Generation Complement Therapeutics Market in China, Till 2035 (USD Billion)
- Figure 13.69 Next Generation Complement Therapeutics Market in India, Till 2035 (USD Billion)
- Figure 13.70 Narsoplimab: Target Patient Population
- Figure 13.71 Narsoplimab Sales Forecast, Till 2035 (USD Billion)
- Figure 13.72 REGN3918: Target Patient Population
- Figure 13.73 REGN3918 Sales Forecast, Till 2035 (USD Billion)
- Figure 13.74 RG6107: Target Patient Population
- Figure 13.75 RG6107 Sales Forecast, Till 2035 (USD Billion)
- Figure 13.76 rVA576: Target Patient Population
- Figure 13.77 rVA576 Sales Forecast, Till 2035 (USD Billion)
- Figure 13.78 SAR445088: Target Patient Population
- Figure 13.79 SAR445088 Sales Forecast, Till 2035 (USD Billion)
- Figure 13.80 Soliris: Target Patient Population
- Figure 13.81 Soliris Sales Forecast, Till 2035 (USD Billion)
- Figure 13.82 Sutimlimab: Target Patient Population
- Figure 13.83 Sutimlimab Sales Forecast, Till 2035 (USD Billion)
- Figure 13.84 Vilobelimab: Target Patient Population
- Figure 13.85 Vilobelimab Sales Forecast, Till 2035 (USD Billion)
- Figure 13.86 Zilucoplan: Target Patient Population
- Figure 13.87 Zilucoplan Sales Forecast, Till 2035 (USD Billion)