


 |
市場調查報告書
商品編碼
1762533
生物製劑合約研究組織市場:產業趨勢及全球預測 - 依生物製劑類型、業務規模、治療領域和地區Biologics Contract Research Organization Market: Industry Trends and Global Forecasts - Distribution by Type of Biologic, Scale of Operation, Therapeutic Area, and Geography |
||||||
生物製劑合約研究組織市場:概覽
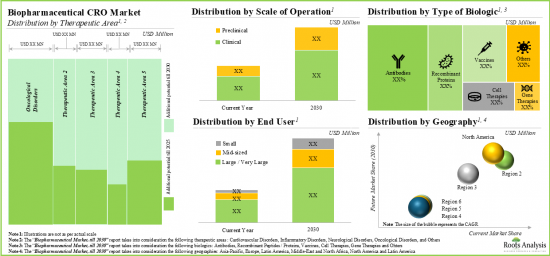
今年全球生物製劑合約研究組織市場規模達 215億美元。預計在預測期內,市場將以 13%的年複合成長率成長。
市場區隔包括根據以下參數進行的市場規模和機會分析:
生物製劑類型
- 疫苗
- 細胞療法
- 基因療法
- 抗體
- 重組蛋白/勝肽
- 其他
業務規模
- 臨床業務
- 臨床前業務
治療領域
- 腫瘤學
- 心血管疾病
- 發炎性疾病
- 神經系統疾病
- 其他
地區
- 北美
- 歐洲
- 亞洲太平洋地區
- 拉丁美洲
- 中東和北非
- 其他地區
生物製劑合約研究組織市場:成長與趨勢
生物製劑是製藥業成長最快的領域之一。這得益於該領域的快速創新,而創新的驅動力源於對有效和個人化藥物介入的需求。然而,生物製劑的開發和臨床試驗是高度複雜且成本高昂的過程,需要專業知識和先進的生物加工技術。因此,許多生物製劑公司選擇將其藥物發現和臨床研究活動外包。
目前,生物製劑公司採用一種商業模式,將開發流程外包給外部服務供應商,同時仍負責藥物研發。這些外部研究服務提供者是各種生物製劑合約研究組織(CRO),它們承擔通常由開發公司承擔的一項或多項職責。這些職責包括方案設計、試驗選擇或監測、報告評估以及準備向美國 FDA 提交的文件。生物製劑 CRO 的主要優勢包括時間效率、成本效益、關鍵創新和品質創新。因此,生物製劑合約研究組織市場預計將逐步擴大,以滿足生物製劑申辦者日益成長的研發需求。
生物製劑合約研究組織市場:關鍵洞察
本報告分析了生物製劑合約研究組織市場的現狀,並揭示了潛在的成長機會。主要調查結果包括:
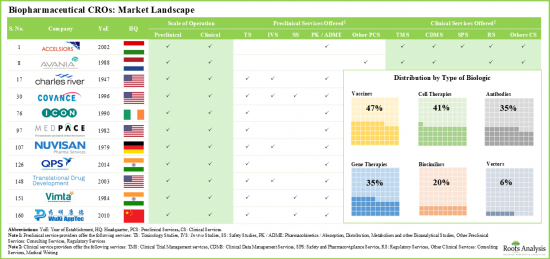
- 目前,160 家公司聲稱擁有為各類生物製劑提供合約開發服務和臨床試驗支援的必要能力。
- 約 50%的合約研究組織僅提供臨床服務,而 12%的合約研究組織則提供與生物製劑臨床研究相關的所有服務。
- 目前的市場格局較為分散,既有成熟的公司,也有擁有豐富產品組合支持臨床前和臨床研究的專業服務提供者。
- 據估計,大型製藥公司目前將其近 45%的內部研發活動外包給合約研究組織(CRO)。
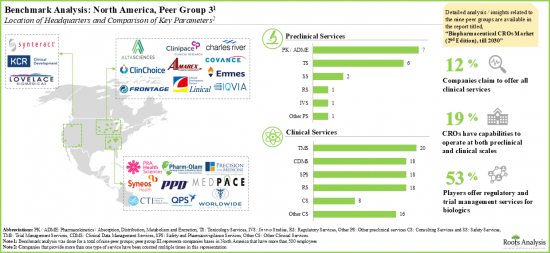
- 超過三分之二的合約研究組織位於北美和歐洲,其中許多是中小型企業。
- 為了獲得競爭優勢,他們積極擴展現有能力,進一步提升各自的服務水準,並跟上不斷發展的行業基準。
- 目前,生物製劑開發商評估/開發超過 8,000 種候選產品,這為生物製劑合約研究組織市場創造了機會。
- 利害關係人對該領域的興趣也反映在近期合作活動的增加。自2016年以來,產業參與者已與申辦者和/或其他合約研究組織(CRO)簽署了多份合約。
- 近20%的CRO 提供臨床和臨床前規模的生物製劑研究服務。
- 隨著一站式服務需求的不斷成長,行業利益相關者積極整合與生物製劑研究相關的能力,主要透過併購和內部擴張。
- 預計未來十年該市場的年複合成長率約為 13%,且在治療領域、企業規模、生物製劑類型、最終用戶和地區方面都將呈現多元化發展機會。
Biocon 合約研究組織市場參與者
- Biocon
- Covance
- ICON
- Medpace
- Pharmaron
- PPD
- PRA Health Sciences
- Syneos Health
- Vimta Labs
- WuXi AppTec
目錄
第1章 簡介
第2章 執行摘要
第3章 簡介
第3章 簡介
- 章節概述
- 生物製劑概述
- 合約研究組織概述
- 合約研究組織(CRO)的演變
- 合約研究組織分類
- CRO 提供的服務
- 外包給 CRO 的優勢
- 外包給 CRO 的風險
第4章 外包指南
- 章節概述
- 生物製劑研究外包
- 外包模式
- 選擇合適的外包模式
- 選擇 CRO 合作夥伴
- CRO 在藥物開發過程中的作用
- 結論
第5章 市場格局
- 章節概述
- Biocon
- Covance
- ICON
- Medpace
- Pharmaron
- PPD
- PRA Health Sciences
- Syneos Health
- Vimta Labs
- WuXi AppTec
第7章 基準分析
- 章節概述
- 調查方法
- 基準分析:同業組
第8章 夥伴關係與合作
- 章節概述
- 合作模式
- 生物製劑CRO:近期合作夥伴關係與合作
第9章 併購
第10章 吸引力與競爭力矩陣
第11章 市場預測
- 章節概述
- 預測研究方法與關鍵假設
- 全球生物製劑 CRO 市場
- 北美生物製劑 CRO 市場
- 歐洲生物製劑 CRO 服務市場
- 亞太生物製劑 CRO 服務市場
- 拉丁美洲生物製劑 CRO 服務市場
- 拉丁美洲生物製劑 CRO 服務市場
第12章 SWOT 分析
第13章 結論
第14章 研究筆記
第15章 附錄1:表格資料
第16章 附錄2:公司與組織清單
BIOLOGICS CONTRACT RESEARCH ORGANIZATION MARKET: OVERVIEW
As per Roots Analysis, the global biologics contract research organization market valued at USD 21.5 billion in the current year is anticipated to grow at a lucrative CAGR of 13% during the forecast period.
The market sizing and opportunity analysis has been segmented across the following parameters:
Type of Biologic
- Vaccines
- Cell Therapy
- Gene Therapy
- Antibodies
- Recombinant Proteins / Peptides
- Others
Scale of Operation
- Clinical Operations
- Preclinical Operations
Therapeutic Area
- Oncological Disorders
- Cardiovascular Disorders
- Inflammatory Disorders
- Neurological Disorders
- Other Therapeutic Areas
Geography
- North America
- Europe
- Asia-Pacific
- Latin America
- Middle East and North Africa
- Rest of the World
BIOLOGICS CONTRACT RESEARCH ORGANIZATION MARKET: GROWTH AND TRENDS
Biologics represent one of the fastest growing segments of the pharmaceutical industry. This can
be attributed to the rapid pace of innovation in this field, driven by the need for effective and personalized pharmacological interventions. However, the development and clinical testing of biologics is a highly complex and costly process that demands specialized expertise and advanced bioprocessing technologies. As a result, many biopharmaceutical companies are choosing to outsource their drug discovery and clinical research operations.
Currently, biopharmaceutical companies are embracing a business model, wherein the development processes are outsourced to external service providers, whereas the company itself is responsible for the R&D of drugs. These external research service providers are various biopharma contract research organizations (CRO) that take on one or more responsibilities typically held by a developer. Examples of such responsibilities include protocol design, selection or monitoring of investigations, evaluation of reports, and preparation of documentation for submission to the US FDA. Key advantages offered by biopharma CRO include time efficiency, cost effectiveness, key to innovation, and quality innovation. Consequently, the biologics contract research organization market is anticipated to expand gradually to fulfil the growing R&D demands of biopharmaceutical sponsors.
BIOLOGICS CONTRACT RESEARCH ORGANIZATION MARKET: KEY INSIGHTS
The report delves into the current state of the biologics contract research organization market and identifies potential growth opportunities within industry. Some key findings from the report include:
- Presently, 160 players claim to have the necessary capabilities to offer contract research services and clinical trial support for different types of biopharmaceutical products.
- About 50% of all the players offer only clinical services; of these, 12% CROs provide all the services associated with clinical research of biologics.
- The current market landscape is fragmented, featuring a mix of well-established players and specialty service providers, having extensive portfolios to support preclinical and clinical research.
- It is estimated that big pharma players presently outsource close to 45% of their internal R&D operations to CROs.
- More than two-thirds of the contract research service providers are based in North America and Europe; most of these players are small and mid-sized companies.
- In order to gain a competitive edge, companies are actively expanding their existing capabilities in order to further augment their respective offerings and also comply with evolving industry benchmarks.
- Over 8,000 product candidates are currently being evaluated / under development biologic drug developers, presenting opportunities in the biologics contract research organization market.
- The growing interest of stakeholders in this field is also reflected in the increase in partnership activity in the recent past; since 2016, industry players have signed multiple deals with sponsor and / or other CROs.
- Close to 20% of the CROs provide research services for biologics at the clinical and preclinical scales.
- With the rising demand for one-stop shops, industry stakeholders are actively consolidating their capabilities related to biopharmaceutical research, mostly through mergers and acquisitions, and internal expansions.
- The market is expected to grow at a CAGR of ~13% in the coming decade; the opportunity is likely to be well distributed across therapeutic areas, scales of operation, types of biologics, end users and geographical regions.
Example Players in the Biologics Contract Research Organization Market
- Biocon
- Covance
- ICON
- Medpace
- Pharmaron
- PPD
- PRA Health Sciences
- Syneos Health
- Vimta Labs
- WuXi AppTec
BIOLOGICS CONTRACT RESEARCH ORGANIZATION MARKET: RESEARCH COVERAGE
- Market Sizing and Opportunity Analysis: The report features an in-depth analysis of the global biologics contract research organization market, focusing on key market segments, including [A] type of biologic, [B] scale of operation, [C] therapeutic area and [D] geography.
- Market Landscape: A comprehensive evaluation of the biopharmaceutical services market, based on several relevant parameters, such as [A] year of establishment, [B] company size, [C] location of headquarters, [D] types of biologics manufactured, [E] scale of operation and [F] types of services offered (including clinical services and preclinical services).
- Company Profiles: In-depth profiles of CROs engaged in offering biopharmaceutical related services, focusing on [A] overview of the company, [B] financial information (if available), [C] service portfolio and [D] recent developments and an informed future outlook.
- Benchmarking Analysis: A comprehensive benchmark analysis of players engaged in biologics contract research organization market based on the [A] capabilities of companies with a peer groups with an aim to gain a competitive edge.
- Partnerships and Collaborations: An insightful analysis of the deals inked by stakeholders in the biologics contract research organization market, based on several parameters, such as [A] year of partnership, [B] type of partnership, [C] most active players (in terms of number of partnerships signed), [D] scale of operation and [E] geography.
- Mergers and Acquisitions: An in-depth analysis of the mergers and acquisitions undertaken in this domain, based on relevant parameters, such as [A] year of acquisition, [B] type of collaboration, [C] geography, [D] most active acquirers, [E] ownership change matrix, [F] key value drivers and [G] acquisition deal multiples.
- Attractiveness Competitiveness Matrix: A comprehensive acquisition target analysis, considering the historical trend of the activity of companies that have acquired other firms since 2016, and providing a means for other industry players to identify potential acquisition targets.
- SWOT Analysis: An analysis of industry affiliated trends, opportunities and challenges, which are likely to impact the evolution of biologics contract research organization market; it includes a Harvey ball analysis, assessing the relative impact of each SWOT parameter on industry dynamics.
KEY QUESTIONS ANSWERED IN THIS REPORT
- How many companies are currently engaged in this market?
- Which are the leading companies in this market?
- What factors are likely to influence the evolution of this market?
- What is the current and future market size?
- What is the CAGR of this market?
- How is the current and future market opportunity likely to be distributed across key market segments?
REASONS TO BUY THIS REPORT
- The report provides a comprehensive market analysis, offering detailed revenue projections of the overall market and its specific sub-segments. This information is valuable to both established market leaders and emerging entrants.
- Stakeholders can leverage the report to gain a deeper understanding of the competitive dynamics within the market. By analyzing the competitive landscape, businesses can make informed decisions to optimize their market positioning and develop effective go-to-market strategies.
- The report offers stakeholders a comprehensive overview of the market, including key drivers, barriers, opportunities, and challenges. This information empowers stakeholders to stay abreast of market trends and make data-driven decisions to capitalize on growth prospects.
ADDITIONAL BENEFITS
- Complimentary PPT Insights Packs
- Complimentary Excel Data Packs for all Analytical Modules in the Report
- 15% Free Content Customization
- Detailed Report Walkthrough Session with Research Team
- Free Updated report if the report is 6-12 months old or older
TABLE OF CONTENTS
1. PREFACE
- 1.1. Scope of the Report
- 1.2. Research Methodology
- 1.2.1. Research Assumptions
- 1.2.2. Project Methodology
- 1.2.3. Forecast Methodology
- 1.2.4. Robust Quality Control
- 1.2.5. Key Considerations
- 1.2.5.1. Demographics
- 1.2.5.2. Economic Factors
- 1.2.5.3. Government Regulations
- 1.2.5.4. Supply Chain
- 1.2.5.5. COVID Impact / Related Factors
- 1.2.5.6. Market Access
- 1.2.5.7. Healthcare Policies
- 1.2.5.8. Industry Consolidation
- 1.3 Key Questions Answered
- 1.4. Chapter Outlines
2. EXECUTIVE SUMMARY
3. INTRODUCTION
3 Introduction
- 3.1. Chapter Overview
- 3.2. Overview of Biologics
- 3.2.1. Types of Biologics
- 3.3. Overview of Contract Research Organizations (CROs)
- 3.4. Evolution of CROs
- 3.5. Classification of CROs
- 3.6. Services Offered by CROs
- 3.7. Advantages of Outsourcing Operations to CROs
- 3.8. Risks Associated with Outsourcing Operations to CROs
4. GUIDE TO OUTSOURCING
- 4.1. Chapter Overview
- 4.2. Outsourcing Biologics Research
- 4.3. Models of Outsourcing
- 4.3.1. Transactional Outsourcing Model
- 4.3.2. Performance / Outcome-based Business Model
- 4.3.3. Staff Augmentation Model
- 4.3.4. Phase-Dependent Outsourcing Model
- 4.4. Selecting an Appropriate Outsourcing Model
- 4.4.1. Hybrid Approach
- 4.5. Selecting a CRO Partner
- 4.5.1. Key Considerations for Outsourcing Biologics-related Operations
- 4.6. Role of CROs in the Drug Development Process
- 4.6.1. Discovery and Preclinical Research
- 4.6.2. Early Clinical Research
- 4.6.3. Clinical Research and Laboratory Services
- 4.7. Conclusion
5. MARKET LANDSCAPE
- 5.1. Chapter Overview
- 5.2. Biopharmaceutical CROs: Overall Market Landscape
- 5.2.1. Analysis by Year of Establishment, Company Size and Location of Headquarters
- 5.2.2. Analysis by Scale of Operation
- 5.3. Preclinical Biopharmaceutical CROs
- 5.3.1. Analysis by Year of Establishment
- 5.3.2. Analysis by Company Size
- 5.3.3. Analysis by Location of Headquarters
- 5.3.4. Analysis by Type of Biologic
- 5.3.5. Analysis by Type of Services Offered
- 5.4. Clinical Biopharmaceutical CROs
- 5.4.1. Analysis by Year of Establishment
- 5.4.2. Analysis by Company Size
- 5.4.3. Analysis by Location of Headquarters
- 5.4.4. Analysis by Type of Biologics
- 5.4.5. Analysis by Type of Services Offered
6. COMPANY PROFILES
- 6.1. Chapter Overview
- 6.2. Biocon
- 6.2.1. Company Overview
- 6.2.2. Financial Information
- 6.2.3. Services Portfolio
- 6.2.4. Future Outlook
- 6.3. Covance
- 6.3.1. Company Overview
- 6.3.2. Service Portfolio
- 6.3.3. Financial Information
- 6.3.4. Future Outlook
- 6.4. ICON
- 6.4.1. Company Overview
- 6.4.2. Financial Information
- 6.4.3. Service Portfolio
- 6.4.4. Future Outlook
- 6.5. Medpace
- 6.5.1. Company Overview
- 6.5.2. Financial Information
- 6.5.3. Service Portfolio
- 6.5.4. Future Outlook
- 6.6. Pharmaron
- 6.6.1. Company Overview
- 6.6.2. Services Portfolio
- 6.6.3. Future Outlook
- 6.7. PPD
- 6.7.1. Company Overview
- 6.7.2. Service Portfolio
- 6.7.3. Financial Information
- 6.7.4. Future Outlook
- 6.8. PRA Health Sciences
- 6.8.1. Company Overview
- 6.8.2. Financial Information
- 6.8.3. Service Portfolio
- 6.8.4. Future Outlook
- 6.9. Syneos Health
- 6.9.1. Company Overview
- 6.9.2. Financial Information
- 6.9.3. Services Portfolio
- 6.9.4. Future Outlook
- 6.10. Vimta Labs
- 6.10.1. Company Overview
- 6.10.2. Services Portfolio
- 6.10.3. Financial Information
- 6.10.4. Future Outlook
- 6.11. WuXi AppTec
- 6.11.1. Company Overview
- 6.11.2. Financial Information
- 6.11.3. Service Portfolio
- 6.11.4. Future Outlook
7. BENCHMARK ANALYSIS
- 7.1. Chapter Overview
- 7.2. Methodology
- 7.3. Benchmark Analysis: Peer Groups
- 7.3.1. Peer Group I
- 7.3.2. Peer Group II
- 7.3.3. Peer Group III
- 7.3.4. Peer Group IV
- 7.3.5. Peer Group V
- 7.3.6. Peer Group VI
- 7.3.7. Peer Group VII
- 7.3.8. Peer Group VIII
8. PARTNERSHIPS AND COLLABORATIONS
- 8.1. Chapter Overview
- 8.2. Partnership Models
- 8.3. Biopharmaceutical CROs: Recent Partnerships and Collaborations
- 8.3.1. Analysis by Year of Partnership
- 8.3.2. Analysis by Type of Partnership Model
- 8.3.2.1. Analysis by Year of Partnership and Type of Partnership Model
- 8.3.3. Most Active Players: Analysis by Number of Partnerships
- 8.3.4. Analysis by Scale of Operation
- 8.3.5. Analysis by Geography
- 8.3.5.1. Country-wise Analysis
- 8.3.5.2. Intercontinental and Intracontinental Agreements
9. MERGERS AND ACQUISITIONS
- 9.1. Chapter Overview
- 9.2. Merger and Acquisition Models
- 9.3. Biopharmaceutical CROs: Mergers and Acquisitions
- 9.3.1. Analysis by Year of Acquisition
- 9.3.2. Analysis by Type of Collaboration
- 9.3.3. Analysis by Geography
- 9.3.3.1. Continent-wise Distribution
- 9.3.3.2. Country-wise Distribution
- 9.3.4. Ownership Change Matrix
- 9.3.5. Most Active Acquirers: Analysis by Number of Acquisitions
- 9.4. Distribution by Key Value Drivers
- 9.4.1. Analysis by Key Value Drivers
- 9.4.2. Analysis by Key Value Drivers and Year of Acquisitions
- 9.5. Valuation Analysis: Acquisition Deal Multiples
10. ATTRACTIVENESS COMPETATIVENESS MATRIX
- 10.1. Chapter Overview
- 10.2. AC Matrix: Overview
- 10.2.1. Strong Business Segment
- 10.2.2. Average Business Segment
- 10.2.3. Weak Business Segment
- 10.3. Analytical Methodology
- 10.4. AC Matrix: Contract Manufacturing Scenario in North America
- 10.5. AC Matrix: Contract Manufacturing Scenario in Europe
- 10.6. AC Matrix: Contract Manufacturing Scenario in Asia Pacific and Middle East
11. MARKET FORECAST
- 11.1. Chapter Overview
- 11.2. Forecast Methodology and Key Assumptions
- 11.3. Global Biopharmaceutical CROs Market
- 11.3.1. Global Biopharmaceutical CROs Market: Distribution by Types of Biologics
- 11.3.2. Global Biopharmaceutical CROs Market: Distribution by Therapeutic Area
- 11.3.3. Global Biopharmaceutical CROs Market: Distribution by Scale of Operation
- 11.3.4. Global Biopharmaceutical CROs Market: Distribution by Geography
- 11.4. Biopharmaceutical CROs Market in North America
- 11.4.1. Biopharmaceutical CROs Market in North America: Distribution by Therapeutic Area
- 11.4.1.1. Biopharmaceutical CROs Market for Oncological Disorders in North America, Till 2035
- 11.4.1.2. Biopharmaceutical CROs Market for Cardiovascular Disorders in North America, Till 2035
- 11.4.1.3. Biopharmaceutical CROs Market for Inflammatory Disorders in North America, Till 2035
- 11.4.1.4. Biopharmaceutical CROs Market for Neurological Disorders in North America, Till 2035
- 11.4.1.5. Biopharmaceutical CROs Market for Other Therapeutic Areas in North America, Till 2035
- 11.4.2. Biopharmaceutical CROs Market in North America: Distribution by Scale of Operation
- 11.4.2.1. Biopharmaceutical CROs Market for Preclinical Operations in North America, Till 2035
- 11.4.2.2. Biopharmaceutical CROs Market for Clinical Operations in North America, Till 2035
- 11.4.1. Biopharmaceutical CROs Market in North America: Distribution by Therapeutic Area
- 11.5. Biopharmaceutical CRO Services Market in Europe
- 11.5.1. Biopharmaceutical CRO Services Market: Distribution by Therapeutic Area in Europe
- 11.5.1.1. Biopharmaceutical CRO Services Market for Oncological Disorders in Europe, Till 2035
- 11.5.1.2. Biopharmaceutical CRO Services Market for Cardiovascular Disorders in Europe, Till 2035
- 11.5.1.3. Biopharmaceutical CRO Services Market for Inflammatory Disorders in Europe, Till 2035
- 11.5.1.4. Biopharmaceutical CRO Services Market for Neurological Disorders in Europe, Till 2035
- 11.5.1.5. Biopharmaceutical CRO Services Market for Other Therapeutic Areas in Europe, Till 2035
- 11.5.2. Biopharmaceutical CRO Services Market: Distribution by Scale of Operation in Europe
- 11.5.2.1. Biopharmaceutical CRO Services Market for Preclinical Operations in Europe, Till 2035
- 11.5.2.2. Biopharmaceutical CRO Services Market for Clinical Operations in Europe, Till 2035
- 11.5.1. Biopharmaceutical CRO Services Market: Distribution by Therapeutic Area in Europe
- 11.6. Biopharmaceutical CRO Services Market in Asia-Pacific
- 11.6.1. Biopharmaceutical CRO Services Market: Distribution by Therapeutic Area in Asia-Pacific
- 11.6.1.1. Biopharmaceutical CRO Services Market for Oncological Disorders in Asia-Pacific, Till 2035
- 11.6.1.2. Biopharmaceutical CRO Services Market for Cardiovascular Disorders in Asia-Pacific, Till 2035
- 11.6.1.3. Biopharmaceutical CRO Services Market for Inflammatory Disorders in Asia-Pacific, Till 2035
- 11.6.1.4. Biopharmaceutical CRO Services Market for Neurological Disorders in Asia-Pacific, Till 2035
- 11.6.1.5. Biopharmaceutical CRO Services Market for Other Therapeutic Areas in Asia-Pacific, Till 2035
- 11.6.2. Biopharmaceutical CRO Services Market: Distribution by Scale of Operation in Asia-Pacific
- 11.6.2.1. Biopharmaceutical CRO Services Market for Preclinical Operations in Asia-Pacific, Till 2035
- 11.6.2.2. Biopharmaceutical CRO Services Market for Clinical Operations in Asia-Pacific, Till 2035
- 11.6.1. Biopharmaceutical CRO Services Market: Distribution by Therapeutic Area in Asia-Pacific
- 11.7. Biopharmaceutical CRO Services Market in Latin America
- 11.8. Biopharmaceutical CRO Services Market in Middle East North America
12. SWOT ANALYSIS
- 12.1. Chapter Overview
- 12.2. Strengths
- 12.3. Weaknesses
- 12.4. Opportunities
- 12.5. Threats
- 12.6. Comparison of SWOT Factors
13. CONCLUDING REMARKS
- 13.1. Chapter Overview
14. SURVEY TRANSCRIPTS
15. APPENDIX I: TABULATED DATA
16. APPENDIX II: LIST OF COMPANIES AND ORGANIZATIONS
List of Tables
- Table 4.1 Attributes of Transactional Outsourcing Based Business Model
- Table 4.2 Comparison of Key Factors Considered by Biologic Developers for Selecting a CRO Partner: Harvey Ball Analysis
- Table 5.1 Biopharmaceutical CROs: Information on Year of Establishment, Location of Headquarters, Company Size and Types of Biologics
- Table 5.2 Biopharmaceutical Preclinical CROs: Information on Types of Services Offered
- Table 5.3 Biopharmaceutical Clinical CROs: Information on Types of Services Offered
- Table 6.1 Biocon: Company Overview
- Table 6.2 Biocon: Future Outlook
- Table 6.3 Covance: Company Overview
- Table 6.4 Covance: Future Outlook
- Table 6.5 ICON: Company Overview
- Table 6.6 ICON: Future Outlook
- Table 6.7 Medpace: Company Overview
- Table 6.8 Medpace: Future Outlook
- Table 6.9 Pharmaron: Company Overview
- Table 6.10 Pharmaron: Future Outlook
- Table 6.11 PPD: Company Overview
- Table 6.12 PPD: Future Outlook
- Table 6.13 PRA Health Sciences: Company Overview
- Table 6.14 PRA Health Sciences: Future Outlook
- Table 6.15 Syneos Health: Company Overview
- Table 6.16 Syneos Health: Future Outlook
- Table 6.17 VIMTA Labs: Company Overview
- Table 6.18 WuXi App-Tec: Company Overview
- Table 6.19 WuXi App Tec: Future Outlook
- Table 7.1 Benchmark Analysis: Peer Groups
- Table 8.1 Partnerships and Collaborations: List of Agreements, Since 2016
- Table 9.1 Mergers and Acquisitions: List of Mergers / Acquisitions, Since 2016
- Table 9.2 Mergers and Acquisitions: Information on Key Value Drivers, Since 2016
- Table 9.3 Mergers and Acquisitions: Deal Multiples, Since 2016
- Table 15.1 Biopharmaceutical CROs: Distribution by Year of Establishment, Company Size and Location of Headquarters
- Table 15.2 Biopharmaceutical CROs: Distribution by Scale of Operation
- Table 15.3 Biopharmaceutical Preclinical CROs: Distribution by Year of Establishment
- Table 15.4 Biopharmaceutical Preclinical CROs: Distribution by Company Size
- Table 15.5 Biopharmaceutical Preclinical CROs Distribution by Location of Headquarters
- Table 15.6 Biopharmaceutical Preclinical CROs: Distribution by Types of Biologics
- Table 15.8 Biopharmaceutical Preclinical CROs: Distribution by Types of Services Offered
- Table 15.9 Biopharmaceutical Preclinical CROs: Distribution by Number of Services Offered
- Table 15.10 Biopharmaceutical Preclinical CROs: Distribution by Types of Biologics and Types Services Offered
- Table 15.11 Biopharmaceutical Clinical CROs: Distribution by Year of Establishment
- Table 15.12 Biopharmaceutical Clinical CROs: Distribution by Company Size
- Table 15.13 Biopharmaceutical Clinical CROs: Distribution by Location of Headquarters
- Table 15.14 Biopharmaceutical Clinical CROs: Distribution by Types of Biologics
- Table 15.15 Biopharmaceutical Clinical CROs: Distribution by Types of Services Offered
- Table 15.16 Biopharmaceutical Clinical CROs: Distribution by Number of Services Offered
- Table 15.17 Biopharmaceutical Clinical CROs: Distribution by Types of Biologics and Types of Services Offered
- Table 15.18 Biocon: Annual Service Revenues, Since 2016 (INR Billion)
- Table 15.19 Covance: Annual Service Revenues, Since 2016 (USD Billion)
- Table 15.20 ICON: Annual Revenues, Since 2016 (USD Billion)
- Table 15.21 Medpace: Annual Service Revenues, Since 2016 (USD Billion)
- Table 15.22 PPD: Annual Service Revenues, Since 2016 (USD Billion)
- Table 15.23 PRA Health Sciences: Annual Revenues, Since 2016 (USD Billion)
- Table 15.24 Syneos: Annual Service Revenues, Since 2016 (USD Billion)
- Table 15.25 Vimta Labs: Annual Service Revenues, Since 2016 (INR Billion)
- Table 15.26 WuXi AppTec: Annual Service Revenues, Since 2016 (USD Billion)
- Table 15.27 Partnerships and Collaborations: Distribution by Year of Partnership
- Table 15.28 Partnerships and Collaborations: Distribution by Type of Partnership Model
- Table 15.29 Partnerships and Collaborations: Distribution by Year of Partnership and Type of Partnership Model
- Table 15.30 Most Active Players: Distribution by Number of Partnerships
- Table 15.31 Partnerships and Collaborations: Distribution by Scale of Operation
- Table 15.32 Partnerships and Collaborations: Distribution by Geography
- Table 15.33 Partnerships and Collaborations: Country-Wise Distribution
- Table 15.34 Partnerships and Collaborations: Intercontinental and Intracontinental Agreements
- Table 15.35 Mergers and Acquisitions: Distribution by Year of Merger / Acquisition (Since 2016)
- Table 15.36 Mergers and Acquisitions: Distribution by Type of Merger / Acquisition
- Table 15.37 Mergers and Acquisitions: Distribution by Year and Type of Agreement
- Table 15.38 Mergers and Acquisitions: Continent-wise Distribution
- Table 15.39 Mergers and Acquisitions: Continent-wise Distribution
- Table 15.40 Mergers and Acquisitions: Country-wise Distribution
- Table 15.41 Mergers and Acquisitions: Ownership Change Matrix
- Table 15.42 Mergers and Acquisitions: Key Value Drivers
- Table 15.43 Mergers and Acquisitions: Distribution by Year of Acquisition and Key Value Drivers
- Table 15.44 Mergers and Acquisitions: Deal Multiples Based on Revenue
- Table 15.45 Mergers and Acquisitions: Deal Multiples Based on Year of Experience
- Table 15.46 Global Biopharmaceutical CROs Market: Distribution by Types of Biologics
- Table 15.47 Global Biopharmaceutical CROs Market: Distribution by Therapeutic Area
- Table 15.48 Global Biopharmaceutical CROs Market: Distribution by Scale of Operation
- Table 15.49 Global Biopharmaceutical CROs Market: Distribution by Geography
- Table 15.50 Biopharmaceutical CROs Market in North America, Conservative, Base and Optimistic Scenarios, Till 2035 (USD Million)
- Table 15.51 Biopharmaceutical CROs Market for Oncological Disorders in North America, Conservative, Base and Optimistic Scenarios, Till 2035 (USD Million)
- Table 15.52 Biopharmaceutical CROs Market for Cardiovascular Disorders in North America, Conservative, Base and Optimistic Scenarios, Till 2035 (USD Million)
- Table 15.53 Biopharmaceutical CROs Market for Inflammatory Disorders in North America, Conservative, Base and Optimistic Scenarios, Till 2035 (USD Million)
- Table 15.54 Biopharmaceutical CROs Market for Neurological Disorders in North America, Conservative, Base and Optimistic Scenarios, Till 2035 (USD Million)
- Table 15.55 Biopharmaceutical CROs Market for Other Therapeutic Areas in North America, Conservative, Base and Optimistic Scenarios, Till 2035 (USD Million)
- Table 15.56 Biopharmaceutical CROs Market for Preclinical Operations in North America, Conservative, Base and Optimistic Scenarios, Till 2035 (USD Million)
- Table 15.57 Biopharmaceutical CROs Market for Clinical Operations in North America, Conservative, Base and Optimistic Scenarios, Till 2035 (USD Million)
- Table 15.58 Biopharmaceutical CROs Market in Europe, Till 2035 (USD Million)
- Table 15.59 Biopharmaceutical CROs Market for Oncological Disorders in Europe, Conservative, Base and Optimistic Scenarios, Till 2035 (USD Million)
- Table 15.60 Biopharmaceutical CROs Market for Cardiovascular Disorders in Europe, Till 2035 (USD Million)
- Table 15.61 Biopharmaceutical CROs Market for Inflammatory Disorders in Europe, Conservative, Base and Optimistic Scenarios, Till 2035 (USD Million)
- Table 15.62 Biopharmaceutical CROs Market for Neurological Disorders in Europe, Conservative, Base and Optimistic Scenarios, Till 2035 (USD Million)
- Table 15.63 Biopharmaceutical CROs Market for Other Therapeutic Areas in Europe, Conservative, Base and Optimistic Scenarios, Till 2035 (USD Million)
- Table 15.64 Biopharmaceutical CROs Market for Preclinical Operations in Europe, Conservative, Base and Optimistic Scenarios, Till 2035 (USD Million)
- Table 15.65 Biopharmaceutical CROs Market for Clinical Operations in Europe, Conservative, Base and Optimistic Scenarios, Till 2035 (USD Million)
- Table 15.66 Biopharmaceutical CROs Market in Asia-Pacific, Conservative, Base and Optimistic Scenarios, Till 2035 (USD Million)
- Table 15.67 Biopharmaceutical CROs Market for Oncological Disorders in Asia-Pacific, Conservative, Base and Optimistic Scenarios, Till 2035 (USD Million)
- Table 15.68 Biopharmaceutical CROs Market for Cardiovascular Disorders in Asia-Pacific, Conservative, Base and Optimistic Scenarios, Till 2035 (USD Million)
- Table 15.69 Biopharmaceutical CROs Market for Inflammatory Disorders in Asia-Pacific, Conservative, Base and Optimistic Scenarios, Till 2035 (USD Million)
- Table 15.70 Biopharmaceutical CROs Market for Neurological Disorders in Asia-Pacific, Conservative, Base and Optimistic Scenarios, Till 2035 (USD Million)
- Table 15.71 Biopharmaceutical CROs Market for Other Therapeutic Areas in Asia-Pacific, Conservative, Base and Optimistic Scenarios, Till 2035 (USD Million)
- Table 15.72 Biopharmaceutical CROs Market for Preclinical Operations in Asia-Pacific, Conservative, Base and Optimistic Scenarios, Till 2035 (USD Million)
- Table 15.73 Biopharmaceutical CROs Market for Clinical Operations in Asia-Pacific, Conservative, Base and Optimistic Scenarios, Till 2035 (USD Million)
- Table 15.74 Biopharmaceutical CROs Market for Preclinical Operations in Latin America, Conservative, Base and Optimistic Scenarios, Till 2035 (USD Million)
- Table 15.75 Biopharmaceutical CROs Market for Preclinical Operations in Middle East North Africa, Conservative, Base and Optimistic Scenarios, Till 2035 (USD Million)
- Table 15.76 Biopharmaceutical CROs Market: Conservative, Base and Optimistic Scenarios (USD Million)
List of Figures
- Figure 3.1 Types of Biologics
- Figure 3.2 Stages of the Drug Development Process
- Figure 3.3 Commonly Offered Services by CROs
- Figure 3.4 Advantages of Outsourcing Operations to CROs
- Figure 3.5 Risks Associated with Outsourcing Operations to CROs
- Figure 4.1 Guiding Models for Outsourcing
- Figure 4.2 Key Characteristics of Transactional Outsourcing Model
- Figure 4.3 Key Characteristics of Performance / Outcome based Business Model
- Figure 4.4 Steps to Consider before Outsourcing
- Figure 4.5 Key Considerations while Selecting a CRO Partner
- Figure 4.6 Role of CROs in the Drug Development Process
- Figure 5.1 Biopharmaceutical CROs: Distribution by Year of Establishment, Company Size and Location of Headquarters
- Figure 5.2 Biopharmaceutical CROs: Distribution by Scale of Operation
- Figure 5.3 Biopharmaceutical Preclinical CROs: Distribution by Year of Establishment
- Figure 5.4 Biopharmaceutical Preclinical CROs: Distribution by Company Size
- Figure 5.5 Biopharmaceutical Preclinical CROs Distribution by Location of Headquarters
- Figure 5.6 Biopharmaceutical Preclinical CROs: Distribution by Types of Biologics
- Figure 5.7 Biopharmaceutical Preclinical CROs: Distribution by Types of Services Offered
- Figure 5.8 Biopharmaceutical Preclinical CROs: Distribution by Number of Services Offered
- Figure 5.9 Biopharmaceutical Preclinical CROs: Distribution by Types of Biologics and Types of Services Offered
- Figure 5.10 Biopharmaceutical Clinical CROs: Distribution by Year of Establishment
- Figure 5.11 Biopharmaceutical Clinical CROs: Distribution by Company Size
- Figure 5.12 Biopharmaceutical Clinical CROs: Distribution by Location of Headquarters
- Figure 5.13 Biopharmaceutical Clinical CROs: Distribution by Types of Biologics
- Figure 5.14 Biopharmaceutical Clinical CROs: Distribution by Types of Services Offered
- Figure 5.15 Biopharmaceutical Clinical CROs: Distribution by Number of Services Offered
- Figure 5.16 Biopharmaceutical Clinical CROs: Distribution by Types of Biologics and Types of Services Offered
- Figure 6.1 Biocon: Annual Services Revenues, Since 2016 (INR Billion)
- Figure 6.2 Biocon: Service Portfolio
- Figure 6.3 Covance: Annual Services Revenues, Since 2016 (USD Billion)
- Figure 6.4 Covance: Service Portfolio
- Figure 6.5 ICON: Annual Revenues, Since 2016 (USD Billion)
- Figure 6.6 ICON: Service Portfolio
- Figure 6.7 Medpace: Annual Services Revenues, Since 2016 (USD Billion)
- Figure 6.8 Medpace: Service Portfolio
- Figure 6.9 Medpace: Regulatory Affair Capabilities
- Figure 6.10 Pharmaron: Service Portfolio
- Figure 6.11 PPD: Annual Services Revenues, Since 2016 (USD Billion)
- Figure 6.12 PPD: Service Portfolio
- Figure 6.13 PRA Health Sciences: Annual Revenues, Since 2016 (USD Billion)
- Figure 6.14 PRA Health Sciences: Service Portfolio
- Figure 6.15 Syneos Health: Annual Services Revenues, Since 2016 (USD Billion)
- Figure 6.16 Syneos Health: Service Portfolio
- Figure 6.17 Vimta Labs: Annual Service Revenues, Since 2016 (INR Billion)
- Figure 6.18 Vimta Labs: Service Portfolio
- Figure 6.19 WuXi App Tec: Annual Services Revenues, Since 2016 (USD Billion)
- Figure 6.20 WuXi App Tec: Service Portfolio
- Figure 7.1 Benchmark Analysis: Distribution by Company Size and Location of Headquarters
- Figure 7.2 Benchmark Analysis: Peer Group I
- Figure 7.3 Benchmark Analysis: Peer Group II
- Figure 7.4 Benchmark Analysis: Peer Group III
- Figure 7.5 Benchmark Analysis: Peer Group IV
- Figure 7.6 Benchmark Analysis: Peer Group V
- Figure 7.7 Benchmark Analysis: Peer Group VI
- Figure 7.8 Benchmark Analysis: Peer Group VII
- Figure 7.9 Benchmark Analysis: Peer Group VIII
- Figure 8.1 Partnerships and Collaborations: Distribution by Year of Partnership
- Figure 8.2 Partnerships and Collaborations: Distribution by Type of Partnership Model
- Figure 8.3 Partnerships and Collaborations: Distribution by Year of Partnership and Type of Partnership Model
- Figure 8.4 Most Active Players: Distribution by Number of Partnerships
- Figure 8.5 Partnerships and Collaborations: Distribution by Scale of Operation
- Figure 8.6 Partnerships and Collaborations: Distribution by Geography
- Figure 8.7 Partnerships and Collaborations: Country-Wise Distribution
- Figure 8.8 Partnerships and Collaborations: Intercontinental and Intracontinental Agreements
- Figure 9.1 Mergers and Acquisitions: Distribution by Year of Merger / Acquisition (Since 2016)
- Figure 9.2 Mergers and Acquisitions: Distribution by Type of Merger / Acquisition
- Figure 9.3 Mergers and Acquisitions: Distribution by Year and Type of Merger / Acquisition
- Figure 9.4 Mergers and Acquisitions: Continent-wise Distribution
- Figure 9.5 Mergers and Acquisitions: Region-wise Distribution
- Figure 9.6 Mergers and Acquisitions: Country-wise Distribution
- Figure 9.7 Mergers and Acquisitions: Ownership Change Matrix
- Figure 9.8 Mergers and Acquisitions: Key Value Drivers
- Figure 9.9 Mergers and Acquisitions: Distribution by Year of Acquisition and Key Value Drivers
- Figure 9.10 Mergers and Acquisitions: Deal Multiples Based on Revenue
- Figure 9.11 Mergers and Acquisitions: Deal Multiples Based on Year of Experience
- Figure 10.1. AC Matrix: Pictorial Representation
- Figure 10.2. AC Matrix: Positioning of Different Biologics in North America
- Figure 10.3. AC Matrix: Positioning of Different Biologics in Europe
- Figure 10.4. AC Matrix: Positioning of Different Biologics in Asia Pacific
- Figure 11.1 Biopharmaceutical CROs: Market Forecast Methodology
- Figure 11.2 Global Biopharmaceutical CROs Market, Till 2035
- Figure 11.3 Global Biopharmaceutical CROs Market: Distribution by Types of Biologics
- Figure 11.4 Global Biopharmaceutical CROs Market: Distribution by Therapeutic Area
- Figure 11.5 Global Biopharmaceutical CROs Market: Distribution by Scale of Operation
- Figure 11.6 Global Biopharmaceutical CROs Market: Distribution by Geography
- Figure 11.7 Biopharmaceutical CROs Market in North America, Till 2035 (USD Million)
- Figure 11.8 Biopharmaceutical CROs Market for Oncological Disorders in North America, Till 2035 (USD Million)
- Figure 11.9 Biopharmaceutical CROs Market for Cardiovascular Disorders in North America, Till 2035 (USD Million)
- Figure 11.10 Biopharmaceutical CROs Market for Inflammatory Disorders in North America, Till 2035 (USD Million)
- Figure 11.11 Biopharmaceutical CROs Market for Neurological Disorders in North America, Till 2035 (USD Million)
- Figure 11.12 Biopharmaceutical CROs Market for Other Therapeutic Areas in North America, Till 2035 (USD Million)
- Figure 11.13 Biopharmaceutical CROs Market for Preclinical Operations in North America, Till 2035 (USD Million)
- Figure 11.14 Biopharmaceutical CROs Market for Clinical Operations in North America, Till 2035 (USD Million
- Figure 11.15 Biopharmaceutical CROs Market in Europe, Till 2035 (USD Million)
- Figure 11.16 Biopharmaceutical CROs Market for Oncological Disorders in Europe, Till 2035 (USD Million)
- Figure 11.17 Biopharmaceutical CROs Market for Cardiovascular Disorders in Europe, Till 2035 (USD Million)
- Figure 11.18 Biopharmaceutical CROs Market for Inflammatory Disorders in Europe, Till 2035 (USD Million)
- Figure 11.19 Biopharmaceutical CROs Market for Neurological Disorders in Europe, Till 2035 (USD Million)
- Figure 11.20 Biopharmaceutical CROs Market for Other Therapeutic Areas in Europe, Till 2035 (USD Million)
- Figure 11.21 Biopharmaceutical CROs Market for Preclinical Operations in Europe, Till 2035 (USD Million)
- Figure 11.22 Biopharmaceutical CROs Market for Clinical Operations in Europe, Till 2035 (USD Million)
- Figure 11.23 Biopharmaceutical CROs Market in Asia-Pacific, Till 2035 (USD Million)
- Figure 11.24 Biopharmaceutical CROs Market for Oncological Disorders in Asia-Pacific, Till 2035 (USD Million)
- Figure 11.25 Biopharmaceutical CROs Market for Cardiovascular Disorders in Asia-Pacific, Till 2035 (USD Million)
- Figure 11.26 Biopharmaceutical CROs Market for Inflammatory Disorders in Asia-Pacific, Till 2035 (USD Million)
- Figure 11.27 Biopharmaceutical CROs Market for Neurological Disorders in Asia-Pacific, Till 2035 (USD Million)
- Figure 11.28 Biopharmaceutical CROs Market for Other Therapeutic Areas in Asia-Pacific, Till 2035 (USD Million)
- Figure 11.29 Biopharmaceutical CROs Market for Preclinical Operations in Asia-Pacific, Till 2035 (USD Million)
- Figure 11.30 Biopharmaceutical CROs Market for Clinical Operations in Asia-Pacific, Till 2035 (USD Million)
- Figure 11.31 Biopharmaceutical CROs Market in Latin America, Till 2035 (USD Million)
- Figure 11.32 Biopharmaceutical CROs Market in Middle East North Africa, Till 2035 (USD Million)
- Figure 11.33 Biopharmaceutical CROs Market: Conservative, Base and Optimistic Scenarios (USD Million)
- Figure 12.1 Biopharmaceutical CROs SWOT Analysis: Overview
- Figure 12.2 Comparison of SWOT Factors: Harvey Ball Analysis
- Figure 13.1 Concluding Remarks: Current Market Landscape for Preclinical Biopharmaceutical CROs
- Figure 13.2 Concluding Remarks: Current Market Landscape for Clinical Biopharmaceutical CROs
- Figure 13.3 Concluding Remarks: Recent Partnerships
- Figure 13.4 Concluding Remarks: Mergers and Acquisitions
- Figure 13.5 Concluding Remarks: Clinical Trial Analysis
- Figure 13.6 Concluding Remarks: Market Sizing and Opportunity Analysis
 大麻素類藥物研發市場分析及預測(至2034年):類型、產品、服務、技術、應用、形式、最終用戶、階段、模式與功能生技藥品委外研發機構市場分析及至2034年的預測:類型、產品、服務、技術、應用、最終使用者、流程與部署
 合約委外研發機構服務市場按服務類型、治療領域、開發階段、最終用戶和合約期限分類 - 全球預測 2025-2032臨床研究服務市場按服務類型、試驗階段、治療領域和最終用戶分類-2025-2032 年全球預測醫療保健合約研究組織市場按類型、服務、治療領域和最終用戶分類 - 2025 年至 2032 年全球預測
 合約研發組織服務市場(按類型、治療領域、模式、最終用戶和地區分類)—預測至 2030 年
 專業CRO市場:產業趨勢及全球預測 - 依治療領域、服務類型及重點地區劃分製藥合約研究組織(CRO)服務市場:產業趨勢及全球預測 - 依業務規模、目標治療領域和重點地區
 合約研究組織市場-全球產業規模、佔有率、趨勢、機會和預測(按服務、應用、地區和競爭細分,2020-2030 年預測)全球微生物組分析市場:市場規模、佔有率、趨勢分析(按產品/服務、技術、最終用途和地區)、細分市場預測(2025-2030 年)