


 |
市場調查報告書
商品編碼
1762530
製藥合約研究組織(CRO)服務市場:產業趨勢及全球預測 - 依業務規模、目標治療領域和重點地區Pharma Contract Research Organization Services Market: Industry Trends and Global Forecasts - Distribution by Scale of Operation, Target Therapeutic Area and Key Geographies |
||||||
製藥合約研究組織(CRO)服務市場:概覽
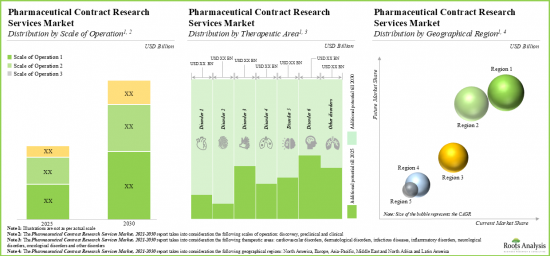
今年全球製藥合約研究組織(CRO)服務市場規模達 250億美元。預計在預測期內,市場將以 10%的年複合成長率成長。
市場區隔包括根據以下參數進行的市場規模和機會分析:
業務規模
- 發現服務
- 臨床前服務
- 臨床服務
目標治療領域
- 心血管疾病
- 皮膚病
- 傳染病
- 發炎性疾病
- 神經系統疾病
- 腫瘤疾病
- 眼科疾病
- 呼吸系統疾病
- 其他疾病
主要地區
- 北美
- 歐洲
- 亞太地區
- 拉丁美洲
- 中東及北非
- 世界其他地區
製藥合約研究組織(CRO)市場:成長與趨勢
整個藥物開發過程從識別有前景的候選藥物開始,到將臨床批准的產品推向市場。整個過程大約需要 10 到 15年。此外,臨床研究和藥物發現都需要大量資金,平均投資額在 40億美元到 100億美元之間。因此,由於藥物發現和研發需要巨額的資本投入和複雜的基礎設施,創新者越來越依賴製藥合約研究組織。
製藥市場外包趨勢的日益成長,歸因於CRO提供的多樣化服務及其最佳化臨床研究時間表的能力。此外,CRO還提供多種優勢,包括客製化服務、成本節約和先進技術,這促使許多製藥公司將其研究活動外包。此外,隨著對新型療法的需求不斷成長,CRO有望引領客製化服務和個人化醫療等新趨勢。
製藥合約研究組織(CRO):關鍵洞察
本報告分析了全球製藥合約研究組織(CRO)服務市場的現狀,並探討了潛在的成長機會。報告的主要調查結果包括:
- 目前,一些產業參與者聲稱擁有提供各種藥物介入所需的廣泛合約研究服務和臨床試驗支援所需的能力。
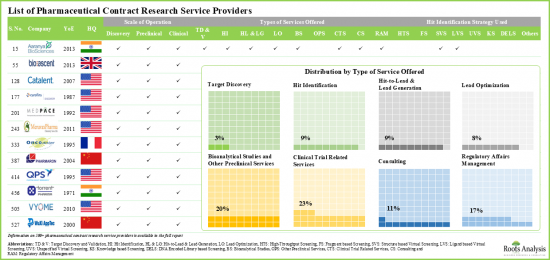
- 市場分散,成熟企業和規模較小的企業都在多個治療領域以不同的營運規模提供合約研究服務。
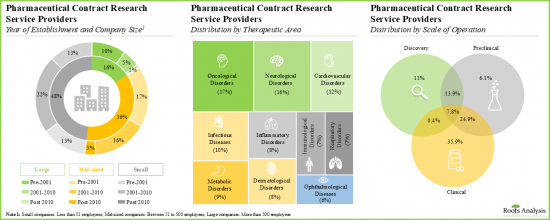
- 超過 40%的公司成立於2010年後。例如,Assay.Works、Celerion、Concept Life Sciences、Molecular Forecaster 和 ProRelix Research。
- 大多數利害關係人提供用於治療各種癌症、神經系統疾病和心血管疾病的小分子藥物介入研發服務。
- 在各種臨床研究服務中,這些公司主要提供臨床試驗管理、醫學寫作、藥物警戒研究、生物統計學和資料管理服務的支援。
- 為了滿足客戶和利害關係人不斷變化的臨床研究相關需求,利害關係人已在全球已開發地區和發展中地區建立業務。
- 為了獲得競爭優勢,服務提供者積極升級現有能力並增加新功能,以擴充各自的產品組合併保持與現有基準的一致。
- 利害關係人對該領域日益成長的興趣也反映在合作夥伴關係的增加上,自2018年以來,產業新進者已與CRO簽署了多項策略協議。
- 在指定期間,合作活動的年複合成長率為15%,其中大多數與公司收購有關。
- 過去,現有企業和新進業者都已在腫瘤學和神經系統疾病領域建立了多個策略聯盟。
- 北美和歐洲的現有企業透過策略性收購積極加強其市場地位,產品組合和地理擴張是關鍵的價值驅動因素之一。
- 目前,生物製藥CRO市場由成熟公司和專業服務提供者提供良好的服務,提供了成長機會。
- 超過三分之二的研發外包公司位於北美和歐洲,其中大多數是中小企業。
- 近20%的CRO提供臨床和臨床前規模的生物製劑研究服務,例如Alliance Pharma和Covance。
- 約50%的CRO僅提供臨床服務,而12%的CRO提供與生物製劑臨床研究相關的所有服務。
- 專有的總擁有成本模型可以估算在20年的時間跨度內在不同地區建立合約研究機構的直接成本和間接成本。
- 預計製藥CRO市場將以每年10%的速度成長,並且預期在不同規模、治療領域和主要地區,機會將更加多樣化。
進入合約藥物開發組織(CRO)服務市場的公司範例
- Albany Molecular Research(AMRI)
- BioDuro
- BOC Sciences
- Catalent Pharma
- Charles River Laboratories
- ChemDiv
- Covance
- Medpace
- QPS
- Concept Life Sciences
- Evotec
- ChemPartner
- Pharmaron
- Syngene
- Torrent Pharma
- WuXi AppTec
目錄
第1章 前言
第2章 執行摘要
第3章 簡介
- 章節概述
- 藥物開發概述
- 藥物發現流程
- 小分子發現的挑戰
- 藥物發現外包的必要性
- 選擇合約研究服務提供者的指南
- 結論
第4章 藥物合約開發服務提供者:市場格局
- 章節概述
- 藥物合約開發服務提供者:產業參與者
第5章 公司個人資料
- 章節概述
- 北美藥品合約開發服務提供者
- Albany Molecular Research(AMRI)
- BioDuro
- BOC Sciences
- Catalent Pharma
- Charles River Laboratories
- ChemDiv
- Covance
- Medpace
- QPS
- 歐洲藥物開發服務提供者
- Concept Life Sciences
- Evotec
- 藥物開發服務提供者亞太地區
- ChemPartner
- Pharmaron
- Syngene
- Torrent Pharma
- WuXi AppTec
第6章 公司競爭力分析
- 章節概述
- 研究方法
- 關鍵參數
- 競爭力分析:醫藥合約開發服務提供者
第7章 合作與合作
- 章節概述
- 合作模式
- 醫藥合約開發服務提供者:合作夥伴關係與合作列表
第8章 併購
第9章 市場預測與機會分析
- 章節概述
- 預測研究方法與關鍵假設
- 2035年全球合約開發服務供應商市場
- 2035年全球合約開發服務供應商市場:依業務規模
- 2035年全球合約開發服務提供者市場:依涵蓋治療領域
- 2035年全球合約開發服務供應商市場:依地區
第10章 合約開發組織的總擁有成本
第11章 案例研究:生物製藥合約開發服務市場
- 章節概述
- 生物製藥合約研究組織:市場格局
- 臨床前生物製藥合約研究組織
- 臨床生物製藥CRO
第12章 高層洞察
第13章 總結
第14章 附錄1:表格資料
PHARMA CONTRACT RESEARCH ORGANIZATION (CRO) SERVICES MARKET: OVERVIEW
As per Roots Analysis, the global pharma contract research organization (CRO) services market valued at USD 25 billion in the current year is anticipated to grow at a lucrative CAGR of 10% during the forecast period.
The market sizing and opportunity analysis has been segmented across the following parameters:
Scale of Operation
- Discovery Services
- Preclinical Services
- Clinical Stage Services
Target Therapeutic Area
- Cardiovascular Disorders
- Dermatological Disorders
- Infectious Disorders
- Inflammatory Disorders
- Neurological Disorders
- Oncological Disorders
- Ophthalmological Disorders
- Respiratory Disorders
- Other Disorders
Key Geographies
- North America
- Europe
- Asia- Pacific
- Latin America
- Middle East and North Africa
- Rest of the World
PHARMA CONTRACT RESEARCH ORGANIZATION (CRO) SERVICES MARKET: GROWTH AND TRENDS
The overall drug development process starts from identifying a promising pharmacological candidate to bringing a clinically approved product to market. This entire process spans around 10 to 15 years. Additionally, both clinical research and drug discovery demand substantial financial resources, with average investments ranging from USD 4 to 10 billion. Therefore, owing to the prohibitive capital investments and complex infrastructure requirements for drug discovery and development, the innovators are increasingly relying on the pharmaceutical contract research service providers.
The rising trend of outsourcing in the pharmaceuticals market can be attributed to the variety of services offered by CROs, and their ability to optimize the clinical research timeline. Moreover, CROs provide several benefits including customized services, reduced costs and access to advanced technologies that have prompted a number of pharmaceutical companies to outsource their research operations. Further, as the demand for novel therapeutics continues to evolve, CROs are expected to navigate through the emerging trends, such as customized services and personalized medicine.
PHARMA CONTRACT RESEARCH ORGANIZATION (CRO) SERVICES MARKET: KEY INSIGHTS
The report delves into the current state of the global pharma contract research organization (CRO) services market and identifies potential growth opportunities within industry. Some key findings from the report include:
- Presently, several industry players claim to have the necessary capabilities to provide a wide range of contract research services and clinical trial support for a variety of pharmaceutical interventions.
- The market is fragmented, featuring the presence of both established players and small firms that offer contract research services, encompassing multiple therapeutic areas and at different scales of operation.
- More than 40% of players were established post 2010; examples of such companies include Assay.Works, Celerion, Concept Life Sciences, Molecular Forecaster and ProRelix Research.
- Majority of the stakeholders offer services for research and development of small molecule pharmacological interventions for the treatment of various oncological, neurological and cardiovascular disorders.
- Amongst the various clinical research services, companies primarily offer support for clinical trial management, medical writing, pharmacovigilance studies, biostatistics and data management services.
- To cater to the evolving clinical research-related needs of clients / sponsors, stakeholders have established their presence in both developed and developing regions of the world.
- In pursuit of gaining a competitive edge, service providers are actively upgrading their existing capabilities and adding new competencies in order to augment their respective portfolios and comply to existing benchmarks.
- The rising interest of stakeholders in this domain is also reflected in the increase in partnerships; since 2018, industry players have entered into multiple strategic agreements with CROs.
- The partnership activity has increased at a CAGR of 15% during the given time period; majority of the instances were related to acquisition of companies.
- In the past, both established players and new entrants have forged multiple strategic partnerships for oncological and neurological disorders.
- Established players in North America and Europe are actively consolidating their presence in the market through strategic acquisitions; portfolio and geographical expansion are amongst the key value drivers.
- The current biopharmaceutical CRO market landscape is a growing opportunity area, well served via well-established players and specialty service providers.
- More than two-thirds of the contract research service providers are based in North America and Europe; most of these players are small and mid-sized companies.
- Close to 20% of the CROs provide research services for biologics at the clinical and preclinical scales; examples include Alliance Pharma, and Covance.
- About 50% of the overall players offer only clinical services; of these, 12% CROs provide all the services associated with clinical research of biologics.
- Our proprietary total cost of ownership model suggests an informed estimate of direct and indirect expenses while setting up a contract research facility in different regions over a span of 20 years.
- The pharmaceutical CROs market is projected to grow at an annualized rate of 10% and the opportunity is expected to be well distributed across different scales of operation, therapeutic areas and key geographies.
Example Players in the Pharma Contract Research Organization (CRO) Services Market
- Albany Molecular Research (AMRI)
- BioDuro
- BOC Sciences
- Catalent Pharma
- Charles River Laboratories
- ChemDiv
- Covance
- Medpace
- QPS
- Concept Life Sciences
- Evotec
- ChemPartner
- Pharmaron
- Syngene
- Torrent Pharma
- WuXi AppTec
PHARMA CONTRACT RESEARCH ORGANIZATION (CRO) SERVICES MARKET: RESEARCH COVERAGE
- Market Sizing and Opportunity Analysis: The report features an in-depth analysis of the pharma contract research organization (CRO) services market, focusing on key market segments, including [A] scale of operation, [B] target therapeutic area and [C] key geographies.
- Market Landscape: A comprehensive evaluation of the companies offering pharmaceutical contract research services, based on several relevant parameters, such as [A] year of establishment, [B] company size, [C] scale of operation, [D] location of headquarters, [E] type(s) of services offered, [F] hit identification strategy used, [G] type of business model and [H] target therapeutic area.
- Company Profiles: In-depth profiles of the pharma CRO companies offering pharmaceutical related services, focusing on [A] overview of the company, [B] financial information (if available), [C] service portfolio and [D] recent developments and an informed future outlook.
- Company Competitiveness Analysis: A comprehensive competitive analysis of pharma CRO companies, examining factors, such as [A] supplier strength and [B] service strength.
- Partnerships and Collaborations: An insightful analysis of the deals inked by stakeholders in the pharma CRO market, based on several parameters, such as [A] year of agreement, [B] type of agreement, [C] scale of operation and [D] target therapeutic area.
- Mergers and Acquisitions: An in-depth analysis of the mergers and acquisitions undertaken in this domain, based on relevant parameters, such as [A] year of acquisition, [B] type of collaboration and [C] geographical location of the companies.
- Total Cost of Ownership in Pharmaceutical Contract Research Organization: An insightful analysis of the total cost of ownership for a pharmaceutical CRO. It features an informed estimate of direct and indirect costs taking into consideration close to 100 relevant parameters over a span of 20 years.
- Case Study: A detailed discussion on current market landscape of biopharmaceutical CROs, including information on the [A] year of establishment, [B] company size, [C] scale of operation and [D] type of services offered.
KEY QUESTIONS ANSWERED IN THIS REPORT
- How many companies are currently engaged in this market?
- Which are the leading companies in this market?
- What factors are likely to influence the evolution of this market?
- What is the current and future market size?
- What is the CAGR of this market?
- How is the current and future market opportunity likely to be distributed across key market segments?
REASONS TO BUY THIS REPORT
- The report provides a comprehensive market analysis, offering detailed revenue projections of the overall market and its specific sub-segments. This information is valuable to both established market leaders and emerging entrants.
- Stakeholders can leverage the report to gain a deeper understanding of the competitive dynamics within the market. By analyzing the competitive landscape, businesses can make informed decisions to optimize their market positioning and develop effective go-to-market strategies.
- The report offers stakeholders a comprehensive overview of the market, including key drivers, barriers, opportunities, and challenges. This information empowers stakeholders to stay abreast of market trends and make data-driven decisions to capitalize on growth prospects.
ADDITIONAL BENEFITS
- Complimentary PPT Insights Packs
- Complimentary Excel Data Packs for all Analytical Modules in the Report
- 15% Free Content Customization
- Detailed Report Walkthrough Session with Research Team
- Free Updated report if the report is 6-12 months old or older
TABLE OF CONTENTS
1. PREFACE
- 1.1. Scope of the Report
- 1.2. Research Methodology
- 1.2.1. Research Assumptions
- 1.2.2. Project Methodology
- 1.2.3. Forecast Methodology
- 1.2.4. Robust Quality Control
- 1.2.5. Key Considerations
- 1.2.5.1. Demographics
- 1.2.5.2. Economic Factors
- 1.2.5.3. Government Regulations
- 1.2.5.4. Supply Chain
- 1.2.5.5. COVID Impact / Related Factors
- 1.2.5.6. Market Access
- 1.2.5.7. Healthcare Policies
- 1.2.5.8. Industry Consolidation
- 1.3 Key Questions Answered
- 1.4. Chapter Outlines
2. EXECUTIVE SUMMARY
3. INTRODUCTION
- 3.1. Chapter Overview
- 3.2. Overview of Drug Development
- 3.3. Drug Discovery Process
- 3.3.1. Target Identification
- 3.3.2. Target Discovery and Validation
- 3.3.3. Hit Generation
- 3.3.3.1. High-Throughput Screening
- 3.3.3.2. Fragment-based Screening
- 3.3.3.3. Virtual Screening
- 3.3.3.4. DNA-Encoded Libraries Screening
- 3.3.4. Hit-to-Lead and Lead Generation
- 3.3.5. Lead Optimization
- 3.4. Challenges Associated with Small Molecule Discovery
- 3.5. Need for Outsourcing Drug Discovery Operations
- 3.6. Guidelines for Selecting a Contract Research Service Provider
- 3.7. Concluding Remarks
4. PHARMACEUTICAL CONTRACT RESEARCH SERVICE PROVIDERS: MARKET LANDSCAPE
- 4.1. Chapter Overview
- 4.2. Pharmaceutical Contract Research Service Providers: List of Industry Players
- 4.2.1. Analysis by Year of Establishment
- 4.2.2. Analysis by Company Size
- 4.2.3. Analysis by Scale of Operation
- 4.2.4. Analysis by Location of Headquarters
- 4.2.5. Analysis by Company Size and Scale of Operation
- 4.2.6. Analysis by Types of Services Offered
- 4.2.7. Analysis by Location of Headquarters and Types of Services Offered
- 4.2.8. Analysis by Hit Identification Strategy Used
- 4.2.9. Analysis by Type of Business Model
- 4.2.10. Analysis by Target Therapeutic Area
5. COMPANY PROFILES
- 5.1. Chapter Overview
- 5.2. Pharmaceutical Contract Research Service Providers in North America
- 5.2.1. Albany Molecular Research (AMRI)
- 5.2.1.1. Company Overview
- 5.2.1.2. Financial Information
- 5.2.1.3. Service Portfolio
- 5.2.1.4. Recent Developments and Future Outlook
- 5.2.2. BioDuro
- 5.2.2.1. Company Overview
- 5.2.2.2. Service Portfolio
- 5.2.2.3. Recent Developments and Future Outlook
- 5.2.3. BOC Sciences
- 5.2.3.1. Company Overview
- 5.2.3.2. Service Portfolio
- 5.2.3.3. Recent Developments and Future Outlook
- 5.2.4. Catalent Pharma
- 5.2.4.1. Company Overview
- 5.2.4.2. Financial Information
- 5.2.4.3. Service Portfolio
- 5.2.4.4. Recent Developments and Future Outlook
- 5.2.5. Charles River Laboratories
- 5.2.5.1. Company Overview
- 5.2.5.2. Financial Information
- 5.2.5.3. Service Portfolio
- 5.2.5.4. Recent Developments and Future Outlook
- 5.2.6. ChemDiv
- 5.2.6.1. Company Overview
- 5.2.6.2. Service Portfolio
- 5.2.6.3. Recent Developments and Future Outlook
- 5.2.7. Covance
- 5.2.7.1. Company Overview
- 5.2.7.2. Financial Information
- 5.2.7.3. Service Portfolio
- 5.2.7.4. Recent Developments and Future Outlook
- 5.2.8. Medpace
- 5.2.8.1. Company Overview
- 5.2.8.2. Financial Information
- 5.2.8.3. Service Portfolio
- 5.2.8.4. Recent Developments and Future Outlook
- 5.2.9. QPS
- 5.2.9.1. Company Overview
- 5.2.9.2. Service Portfolio
- 5.2.9.3. Recent Developments and Future Outlook
- 5.2.1. Albany Molecular Research (AMRI)
- 5.3. Pharmaceutical Contract Research Service Providers in Europe
- 5.3.1. Concept Life Sciences
- 5.3.1.1. Company Overview
- 5.3.1.2. Service Portfolio
- 5.3.1.3. Recent Developments and Future Outlook
- 5.3.2. Evotec
- 5.3.2.1. Company Overview
- 5.3.2.2. Financial Information
- 5.3.2.3. Service Portfolio
- 5.3.2.4. Recent Developments and Future Outlook
- 5.3.1. Concept Life Sciences
- 5.4. Pharmaceutical Contract Research Service Providers in Asia-Pacific
- 5.4.1. ChemPartner
- 5.4.1.1. Company Overview
- 5.4.1.2. Financial Information
- 5.4.1.3. Service Portfolio
- 5.4.1.4. Recent Developments and Future Outlook
- 5.4.2. Pharmaron
- 5.4.2.1. Company Overview
- 5.4.2.2. Service Portfolio
- 5.4.2.3. Recent Developments and Future Outlook
- 5.4.3. Syngene
- 5.4.3.1. Company Overview
- 5.4.3.2. Financial Information
- 5.4.3.3. Service Portfolio
- 5.4.3.4. Recent Developments and Future Outlook
- 5.4.4. Torrent Pharma
- 5.4.4.1. Company Overview
- 5.4.4.2. Financial Information
- 5.4.4.3. Service Portfolio
- 5.4.4.4. Recent Developments and Future Outlook
- 5.4.5. WuXi AppTec
- 5.4.5.1. Company Overview
- 5.4.5.2. Financial Information
- 5.4.5.3. Service Portfolio
- 5.4.5.4. Recent Developments and Future Outlook
- 5.4.1. ChemPartner
6. COMPANY COMPETITIVENESS ANALYSIS
- 6.1. Chapter Overview
- 6.2. Methodology
- 6.3. Key Parameters
- 6.4. Company Competitiveness Analysis: Pharmaceutical Contract Research Service Providers
- 6.4.1. Pharmaceutical Contract Research Service Providers based in North America
- 6.4.2. Pharmaceutical Contract Research Service Providers based in Europe
- 6.4.3. Pharmaceutical Contract Research Service Providers based in Asia- Pacific and Rest of the World
7. PARTNERSHIPS AND COLLABORATIONS
- 7.1. Chapter Overview
- 7.2. Partnership Models
- 7.3. Pharmaceutical Contract Research Service Providers: List of Partnerships and Collaborations
- 7.3.1. Analysis by Year of Partnership
- 7.3.2. Analysis by Type of Partnership
- 7.3.3. Analysis by Scale of Operation
- 7.3.4. Analysis by Target Therapeutic Area
- 7.3.5. Analysis by Year of Partnership and Type of Partner
- 7.3.6. Analysis by Type of Partnership and Type of Partner
- 7.3.7. Most Active Players: Analysis by Number of Partnerships
- 7.3.8. Regional Analysis
- 7.3.8.1. Intercontinental and Intracontinental Agreements
8. MERGERS AND ACQUISITIONS
- 8.1. Chapter Overview
- 8.2. Merger and Acquisition Models
- 8.3. Pharmaceutical Contract Research Service Providers: Mergers and Acquisitions
- 8.3.1. Analysis by Year of Acquisition
- 8.3.2. Analysis by Geography
- 8.3.3. Intercontinental and Intracontinental Deals
- 8.4. Analysis by Key Value Drivers
- 8.4.1. Mergers and Acquisitions: Analysis by Key Value Drivers
- 8.5. Valuation Analysis: Acquisition Deal Multiples
- 8.5.1. Prominent Acquirers: Analysis by Number of Acquisitions
9. MARKET FORECAST AND OPPORTUNITY ANALYSIS
- 9.1. Chapter Overview
- 9.2. Forecast Methodology and Key Assumptions
- 9.3. Global Pharmaceutical Contract Research Service Providers Market, Till 2035
- 9.4. Global Pharmaceutical Contract Research Service Providers Market, Till 2035: Distribution by Scale of Operation
- 9.4.1. Global Pharmaceutical Contract Research Service Providers Market for Discovery Services, Till 2035
- 9.4.2. Global Pharmaceutical Contract Research Service Providers Market for Preclinical Services, Till 2035
- 9.4.3. Global Pharmaceutical Contract Research Service Providers Market for Clinical Services, Till 2035
- 9.5. Global Pharmaceutical Contract Research Service Providers Market, Till 2035: Distribution by Target Therapeutic Area
- 9.5.1. Global Pharmaceutical Contract Research Service Providers Market for Oncological Disorders, Till 2035
- 9.5.2. Global Pharmaceutical Contract Research Service Providers Market for Infectious Diseases, Till 2035
- 9.5.3. Global Pharmaceutical Contract Research Service Providers Market for Neurological Disorders, Till 2035
- 9.5.4. Global Pharmaceutical Contract Research Service Providers Market for Inflammatory Disorders, Till 2035
- 9.5.5. Global Pharmaceutical Contract Research Service Providers Market for Cardiovascular Disorders, Till 2035
- 9.5.6. Global Pharmaceutical Contract Research Service Providers Market for Dermatological Disorders, Till 2035
- 9.5.7. Global Pharmaceutical Contract Research Service Providers Market for Ophthalmological Diseases, Till 2035
- 9.5.8. Global Pharmaceutical Contract Research Service Providers Market for Respiratory Disorders, Till 2035
- 9.5.9. Global Pharmaceutical Contract Research Service Providers Market for Other Disorders, Till 2035
- 9.6. Global Pharmaceutical Contract Research Service Providers Market, Till 2035: Distribution by Region
- 9.6.1. Pharmaceutical Contract Research Service Providers Market in North America, Till 2035
- 9.6.2. Pharmaceutical Contract Research Service Providers Market in Europe, Till 2035
- 9.6.3. Pharmaceutical Contract Research Service Providers Market in Asia-Pacific, Till 2035
- 9.6.4. Pharmaceutical Contract Research Service Providers Market in Middle East, Till 2035
- 9.6.5. Pharmaceutical Contract Research Service Providers Market in Latin America, Till 2035
10. TOTAL COST OF OWNERSHIP IN PHARMACEUTICAL CONTRACT RESEARCH ORGANIZATION
- 10.1. Chapter Overview
- 10.2. Key Assumptions and Methodology
- 10.3. Output
11. CASE STUDY: BIOPHARMACEUTICAL CONTRACT RESEARCH SERVICES MARKET
- 11.1. Chapter Overview
- 11.2. Biopharmaceutical CROs: Overall Market Landscape
- 11.2.1. Analysis by Year of Establishment, Company Size and Location of Headquarters
- 11.2.2. Analysis by Scale of Operation
- 11.3. Preclinical Biopharmaceutical CROs
- 11.3.1. Analysis by Year of Establishment
- 11.3.2. Analysis by Company Size
- 11.3.3. Analysis by Location of Headquarters
- 11.3.4. Analysis by Type of Biologic
- 11.3.5. Analysis by Type of Services Offered
- 11.4. Clinical Biopharmaceutical CROs
- 11.4.1. Analysis by Year of Establishment
- 11.4.2. Analysis by Company Size
- 11.4.3. Analysis by Location of Headquarters
- 11.4.4. Analysis by Type of Biologics
- 11.4.5. Analysis by Type of Services Offered
12. EXECUTIVE INSIGHTS
- 12.1. Chapter Overview
- 12.2. Company A
- 12.2.1. Company Snapshot
- 12.2.2. Interview Transcript: Founder and Chief Executive Officer
13. CONCLUDING REMARKS
14. APPENDIX 1: TABULATED DATA
List of Tables
- Table 4.1 Pharmaceutical Contract Research Service Providers: List of Industry Players
- Table 4.2 Pharmaceutical Contract Research Service Providers: Information on Scale of Operation
- Table 4.3 Pharmaceutical Contract Research Service Providers: Information on Types of Services Offered
- Table 4.4 Pharmaceutical Contract Research Service Providers: Information on Hit Identification Strategy Used
- Table 4.5 Pharmaceutical Contract Research Service Providers: Information on Type of Business Model
- Table 4.6 Pharmaceutical Contract Research Service Providers: Information on Type of Business Model
- Table 4.7 Pharmaceutical Contract Research Service Providers: Information on Target Therapeutic Area
- Table 5.1 Pharmaceutical Contract Research Service Providers: List of Profiled Companies
- Table 5.2 AMRI: Company Overview
- Table 5.3 AMRI: Service Portfolio
- Table 5.4 AMRI: Recent Developments and Future Outlook
- Table 5.5 BioDuro: Company Overview
- Table 5.6 BioDuro: Service Portfolio
- Table 5.7 BioDuro: Recent Developments and Future Outlook
- Table 5.8 BOC Sciences: Company Overview
- Table 5.9 BOC Sciences: Service Portfolio
- Table 5.10 BOC Sciences: Recent Developments and Future Outlook
- Table 5.11 Catalent Pharma: Company Overview
- Table 5.12 Catalent Pharma: Service Portfolio
- Table 5.13 Catalent Pharma: Recent Developments and Future Outlook
- Table 5.14 Charles River Laboratories: Company Overview
- Table 5.15 Charles River Laboratories: Service Portfolio
- Table 5.16 Charles River Laboratories: Recent Developments and Future Outlook
- Table 5.17 ChemDiv: Company Overview
- Table 5.18 ChemDiv: Service Portfolio
- Table 5.19 ChemDiv: Recent Developments and Future Outlook
- Table 5.20 Covance: Company Overview
- Table 5.21 Covance: Service Portfolio
- Table 5.22 Covance: Recent Developments and Future Outlook
- Table 5.23 Medpace: Company Overview
- Table 5.24 Medpace: Service Portfolio
- Table 5.25 Medpace: Recent Developments and Future Outlook
- Table 5.26 QPS: Company Overview
- Table 5.27 QPS: Service Portfolio
- Table 5.28 QPS: Recent Developments and Future Outlook
- Table 5.29 Concept Life Sciences: Company Overview
- Table 5.30 Concept Life Sciences: Service Portfolio
- Table 5.31 Concept Life Sciences: Recent Developments and Future Outlook
- Table 5.32 Evotec: Company Overview
- Table 5.33 Evotec: Service Portfolio
- Table 5.34 Evotec: Recent Developments and Future Outlook
- Table 5.35 ChemPartner: Company Overview
- Table 5.36 ChemPartner: Service Portfolio
- Table 5.37 ChemPartner: Recent Developments and Future Outlook
- Table 5.38 Pharmaron: Company Overview
- Table 5.39 Pharmaron: Service Portfolio
- Table 5.40 Pharmaron: Recent Developments and Future Outlook
- Table 5.41 Syngene: Company Overview
- Table 5.42 Syngene: Service Portfolio
- Table 5.43 Syngene: Recent Developments and Future Outlook
- Table 5.44 Torrent Pharma: Company Overview
- Table 5.45 Torrent Pharma: Service Portfolio
- Table 5.46 Torrent Pharma: Recent Developments and Future Outlook
- Table 5.47 WuXi AppTec: Company Overview
- Table 5.48 WuXi AppTec: Service Portfolio
- Table 5.49 WuXi AppTec: Recent Developments and Future Outlook
- Table 7.1 Pharmaceutical Contract Research Service Providers: List of Partnerships and Collaborations
- Table 8.1 Mergers and Acquisitions: List of Mergers / Acquisitions, Since 2018
- Table 8.2 Mergers and Acquisitions: Information on Key Value Drivers, Since 2018
- Table 8.3 Mergers and Acquisitions: Deal Multiples, Since 2018
- Table 11.2 Biopharmaceutical Preclinical CROs: Information on Types of Services Offered
- Table 11.3 Biopharmaceutical Clinical CROs: Information on Types of Services Offered
- Table 12.1 ChemoGenics Biopharma: Key Highlights
- Table 14.1 Pharmaceutical Contract Research Service Providers: Distribution by Year of Establishment
- Table 14.2 Pharmaceutical Contract Research Service Providers: Distribution by Scale of Operation
- Table 14.3 Pharmaceutical Contract Research Service Providers: Distribution by Company Size
- Table 14.4 Pharmaceutical Contract Research Service Providers: Distribution by Location of Headquarters
- Table 14.5 World Map Representation: Analysis by Geography
- Table 14.6 Pharmaceutical Contract Research Service Providers: Distribution by Company Size and Scale of Operation
- Table 14.7 Pharmaceutical Contract Research Service Providers: Distribution by Types of Services Offered
- Table 14.9 Pharmaceutical Contract Research Service Providers: Distribution by Hit Identification Strategy Used
- Table 14.10 Pharmaceutical Contract Research Service Providers: Distribution by Type of Business Model
- Table 14.11 Pharmaceutical Contract Research Service Providers: Distribution by Target Therapeutic Area
- Table 14.12 Catalent Pharma: Annual Revenues, Since 2016 (USD Billion)
- Table 14.13 Charles River Laboratories: Annual Revenues, Since 2016 (USD Billion)
- Table 14.14 Covance: Annual Revenues, Since 2016 (USD Billion)
- Table 14.15 Medpace: Annual Revenues, Since 2016 (USD Billion)
- Table 14.16 Evotec: Annual Revenues, Since 2016 (EUR Million)
- Table 14.17 Syngene: Annual Revenues, Since 2016 (INR Billion)
- Table 14.18 Torrent Pharma: Annual Revenues, Since 2016 (INR Million)
- Table 14.19 WuXi AppTec: Annual Revenues, Since 2017 (RMB Billion)
- Table 14.20 Partnerships and Collaborations: Cumulative Year-wise Trend, Since 2018
- Table 14.21 Partnerships and Collaborations: Distribution by Type of Partnership
- Table 14.22 Partnerships and Collaborations: Distribution by Year and Type of Partnership
- Table 14.23 Partnerships and Collaborations: Distribution by Scale of Operation
- Table 14.24 Partnerships and Collaborations: Distribution by Target Therapeutic Area
- Table 14.25 Partnerships and Collaborations: Distribution by Year of Partnership and Type of Partner
- Table 14.26 Partnerships and Collaborations: Distribution by Type of Partnership and Type of Partner
- Table 14.27 Most Active Players: Distribution by Number of Partnerships
- Table 14.28 Partnerships and Collaborations: Regional Distribution
- Table 14.29 Partnerships and Collaborations: Intercontinental and Intracontinental Agreements
- Table 14.30 Mergers and Acquisitions: List of Mergers / Acquisitions, Since 2016
- Table 14.31 Mergers and Acquisitions: Information on Key Value Drivers, Since 2016
- Table 14.32 Mergers and Acquisitions: Deal Multiples, Since 2016
- Table 14.33 Global Pharmaceutical Contract Research Services Market, Till 2035 (USD Billion)
- Table 14.34 Global Pharmaceutical Contract Research Services Market, Till 2035: Distribution by Scale of Operation (USD Billion)
- Table 14.35 Global Pharmaceutical Contract Research Services Market for Discovery Services, Till 2035 (USD Billion)
- Table 14.36 Global Pharmaceutical Contract Research Services Market for Preclinical Services, Till 2035 (USD Billion)
- Table 14.37 Global Pharmaceutical Contract Research Services Market for Clinical Stage Services, Till 2035 (USD Billion)
- Table 14.38 Global Pharmaceutical Contract Research Services Market, Till 2035: Distribution by Target Therapeutic Area (USD Billion)
- Table 14.39 Global Pharmaceutical Contract Research Services Market for Oncological Disorders, Till 2035 (USD Billion)
- Table 14.40 Global Pharmaceutical Contract Research Services Market for Infectious Diseases, Till 2035 (USD Billion)
- Table 14.41 Global Pharmaceutical Contract Research Services Market for Neurological Disorders, Till 2035 (USD Billion)
- Table 14.42 Global Pharmaceutical Contract Research Services Market for Inflammatory Disorders, Till 2035 (USD Billion)
- Table 14.43 Global Pharmaceutical Contract Research Services Market for Cardiovascular Disorders, Till 2035 (USD Billion)
- Table 14.44 Global Pharmaceutical Contract Research Services Market for Dermatological Disorders, Till 2035 (USD Billion)
- Table 14.45 Global Pharmaceutical Contract Research Services Market for Ophthalmological Disorders, Till 2035 (USD Billion)
- Table 14.46 Global Pharmaceutical Contract Research Services Market for Respiratory Disorders, Till 2035 (USD Billion)
- Table 14.47 Global Pharmaceutical Contract Research Services Market for Other Disorders, Till 2035 (USD Billion)
- Table 14.48 Global Pharmaceutical Contract Research Services Market, Till 2035: Distribution by Geography (USD Billion)
- Table 14.49 Global Pharmaceutical Contract Research Services Market in North America, Till 2035 (USD Billion)
- Table 14.50 Global Pharmaceutical Contract Research Services Market in Europe, Till 2035 (USD Billion)
- Table 14.51 Global Pharmaceutical Contract Research Services Market in Asia-Pacific, Till 2035 (USD Billion)
- Table 14.52 Global Pharmaceutical Contract Research Services Market in Middle East and North Africa, Till 2035 (USD Billion)
- Table 14.53 Global Pharmaceutical Contract Research Services Market in Latin America, Till 2035 (USD Billion)
- Table 14.54 Total Cost of Ownership in Pharmaceutical Contract Research Organization: Output
- Table 14.55 Biopharmaceutical CROs: Distribution by Year of Establishment, Company Size and Location of Headquarters
- Table 14.56 Biopharmaceutical CROs: Distribution by Scale of Operation
- Table 14.57 Biopharmaceutical Preclinical CROs: Distribution by Year of Establishment
- Table 14.58 Biopharmaceutical Preclinical CROs: Distribution by Company Size
- Table 14.59 Biopharmaceutical Preclinical CROs Distribution by Location of Headquarters
- Table 14.60 Biopharmaceutical Preclinical CROs: Distribution by Types of Biologics
- Table 14.61 Biopharmaceutical Preclinical CROs: Distribution by Types of Services Offered
- Table 14.62 Biopharmaceutical Preclinical CROs: Distribution by Number of Services Offered
- Table 14.63 Biopharmaceutical Preclinical CROs: Distribution by Types of Biologics and Types of Services Offered
- Table 14.64 Biopharmaceutical Clinical CROs: Distribution by Year of Establishment
- Table 14.65 Biopharmaceutical Clinical CROs: Distribution by Company Size
- Table 14.66 Biopharmaceutical Clinical CROs: Distribution by Location of Headquarters
- Table 14.67 Biopharmaceutical Clinical CROs: Distribution by Types of Biologics
- Table 14.68 Biopharmaceutical Clinical CROs: Distribution by Types of Services Offered
- Table 14.69 Biopharmaceutical Clinical CROs: Distribution by Number of Services Offered
- Table 14.70 Biopharmaceutical Clinical CROs: Distribution by Types of Biologics and Types of Services Offered
List of Figures
- Figure 3.1 Drug Discovery and Development Pipeline
- Figure 3.2 Drug Discovery Process
- Figure 3.3 Guidelines for Selecting a Contract Research Service Provider
- Figure 4.1 Pharmaceutical Contract Research Service Providers: Distribution by Year of Establishment
- Figure 4.2 Pharmaceutical Contract Research Service Providers: Distribution by Company Size
- Figure 4.3 Pharmaceutical Contract Research Service Providers: Distribution by Scale of Operation
- Figure 4.4 Pharmaceutical Contract Research Service Providers: Distribution by Location of Headquarters
- Figure 4.5 World Map Representation: Analysis by Geography
- Figure 4.6 Pharmaceutical Contract Research Service Providers: Distribution by Company Size and Scale of Operation
- Figure 4.7 Pharmaceutical Contract Research Service Providers: Distribution by Types of Services Offered
- Figure 4.8 Pharmaceutical Contract Research Service Providers: Distribution by Location of Headquarters and Types of Services Offered
- Figure 4.9 Pharmaceutical Contract Research Service Providers: Distribution by Hit Identification Strategy Used
- Figure 4.10 Pharmaceutical Contract Research Service Providers: Distribution by Type of Business Model
- Figure 4.11 Pharmaceutical Contract Research Service Providers: Distribution by Target Therapeutic Area
- Figure 5.1 Catalent Pharma: Annual Revenues, Since 2016 (USD Billion)
- Figure 5.2 Charles River Laboratories: Annual Revenues, Since 2016 (USD Billion)
- Figure 5.3 Covance: Annual Revenues, Since 2016 (USD Billion)
- Figure 5.4 Medpace: Annual Revenues, Since 2016 (USD Billion)
- Figure 5.5 Evotec: Annual Revenues, Since 2016 (EUR Million)
- Figure 5.6 Syngene: Annual Revenues, Since 2016 (INR Billion)
- Figure 5.7 Torrent Pharma: Annual Revenues, Since 2016 (INR Million)
- Figure 5.8 WuXi AppTec: Annual Revenues, Since 2017 (RMB Billion)
- Figure 6.1 Company Competitiveness Analysis: Pharmaceutical Contract Research Service Providers based in North America
- Figure 6.2 Company Competitiveness Analysis: Pharmaceutical Contract Research Service Providers based in Europe
- Figure 6.3 Company Competitiveness Analysis: Pharmaceutical Contract Research Service Providers based in Asia Pacific and Rest of the World
- Figure 7.1 Partnerships and Collaborations: Cumulative Year-wise Trend, Since 2018
- Figure 7.2 Partnerships and Collaborations: Distribution by Type of Partnership
- Figure 7.3 Partnerships and Collaborations: Distribution by Year and Type of Partnership
- Figure 7.4 Partnerships and Collaborations: Distribution by Scale of Operation
- Figure 7.5 Partnerships and Collaborations: Distribution by Target Therapeutic Area
- Figure 7.6 Partnerships and Collaborations: Distribution by Year of Partnership and Type of Partner
- Figure 7.7 Partnerships and Collaborations: Distribution by Type of Partnership and Type of Partner
- Figure 7.8 Most Active Players: Distribution by Number of Partnerships
- Figure 7.9 Partnerships and Collaborations: Regional Distribution
- Figure 7.10 Partnerships and Collaborations: Intercontinental and Intracontinental Agreements
- Figure 8.1 Mergers and Acquisitions: Distribution by Year of Merger / Acquisition Since 2018
- Figure 8.2 Mergers and Acquisitions: Distribution by Type of Merger / Acquisition
- Figure 8.3 Mergers and Acquisitions: Distribution by Year and Type of Merger / Acquisition
- Figure 8.4 Mergers and Acquisitions: Continent-wise Distribution
- Figure 8.5 Mergers and Acquisitions: Region-wise Distribution
- Figure 8.6 Mergers and Acquisitions: Country-wise Distribution
- Figure 8.7 Mergers and Acquisitions: Ownership Change Matrix
- Figure 8.8 Mergers and Acquisitions: Key Value Drivers
- Figure 8.9 Mergers and Acquisitions: Distribution by Year of Acquisition and Key Value Drivers
- Figure 8.10 Mergers and Acquisitions: Deal Multiples Based on Revenue
- Figure 8.11 Mergers and Acquisitions: Deal Multiples Based on Year of Experience
- Figure 9.1 Global Pharmaceutical Contract Research Services Market, Till 2035 (USD Billion)
- Figure 9.2 Global Pharmaceutical Contract Research Services Market, Till 2035: Distribution by Scale of Operation (USD Billion)
- Figure 9.3 Global Pharmaceutical Contract Research Services Market for Discovery Services, Till 2035 (USD Billion)
- Figure 9.4 Global Pharmaceutical Contract Research Services Market for Preclinical Services, Till 2035 (USD Billion)
- Figure 9.5 Global Pharmaceutical Contract Research Services Market for Clinical Stage Services, Till 2035 (USD Billion)
- Figure 9.6 Global Pharmaceutical Contract Research Services Market, Till 2035: Distribution by Target Therapeutic Area (USD Billion)
- Figure 9.7 Global Pharmaceutical Contract Research Services Market for Oncological Disorders, Till 2035 (USD Billion)
- Figure 9.8 Global Pharmaceutical Contract Research Services Market for Infectious Diseases, Till 2035 (USD Billion)
- Figure 9.9 Global Pharmaceutical Contract Research Services Market for Neurological Disorders, Till 2035 (USD Billion)
- Figure 9.10 Global Pharmaceutical Contract Research Services Market for Inflammatory Disorders, Till 2035 (USD Billion)
- Figure 9.11 Global Pharmaceutical Contract Research Services Market for Cardiovascular Disorders, Till 2035 (USD Billion)
- Figure 9.12 Global Pharmaceutical Contract Research Services Market for Dermatological Disorders, Till 2035 (USD Billion)
- Figure 9.13 Global Pharmaceutical Contract Research Services Market for Ophthalmological Diseases, Till 2035 (USD Billion)
- Figure 9.14 Global Pharmaceutical Contract Research Services Market for Respiratory Disorders, Till 2035 (USD Billion)
- Figure 9.15 Global Pharmaceutical Contract Research Services Market for Other Disorders, Till 2035 (USD Billion)
- Figure 9.16 Global Pharmaceutical Contract Research Services Market, Till 2035: Distribution by Geography (USD Billion)
- Figure 9.17 Global Pharmaceutical Contract Research Services Market in North America, Till 2035 (USD Billion)
- Figure 9.18 Global Pharmaceutical Contract Research Services Market in Europe, Till 2035 (USD Billion)
- Figure 9.19 Global Pharmaceutical Contract Research Services Market in Asia-Pacific, Till 2035 (USD Billion)
- Figure 9.20 Global Pharmaceutical Contract Research Services Market in Middle East and North Africa, Till 2035 (USD Billion)
- Figure 9.21 Global Pharmaceutical Contract Research Services Market in Latin America, Till 2035 (USD Billion)
- Figure 10.1 Total Cost of Ownership in Pharmaceutical Contract Research Organization: Output
- Figure 11.1 Biopharmaceutical CROs: Distribution by Year of Establishment, Company Size and Location of Headquarters
- Figure 11.2 Biopharmaceutical CROs: Distribution by Scale of Operation
- Figure 11.3 Biopharmaceutical Preclinical CROs: Distribution by Year of Establishment
- Figure 11.4 Biopharmaceutical Preclinical CROs: Distribution by Company Size
- Figure 11.5 Biopharmaceutical Preclinical CROs Distribution by Location of Headquarters
- Figure 11.6 Biopharmaceutical Preclinical CROs: Distribution by Types of Biologics
- Figure 11.7 Biopharmaceutical Preclinical CROs: Distribution by Types of Services Offered
- Figure 11.8 Biopharmaceutical Preclinical CROs: Distribution by Number of Services Offered
- Figure 11.9 Biopharmaceutical Preclinical CROs: Distribution by Types of Biologics and Types of Services Offered
- Figure 11.10 Biopharmaceutical Clinical CROs: Distribution by Year of Establishment
- Figure 11.11 Biopharmaceutical Clinical CROs: Distribution by Company Size
- Figure 11.12 Biopharmaceutical Clinical CROs: Distribution by Location of Headquarters
- Figure 11.13 Biopharmaceutical Clinical CROs: Distribution by Types of Biologics
- Figure 11.14 Biopharmaceutical Clinical CROs: Distribution by Types of Services Offered
- Figure 11.15 Biopharmaceutical Clinical CROs: Distribution by Number of Services Offered
- Figure 11.16 Biopharmaceutical Clinical CROs: Distribution by Types of Biologics and Types of Services Offered
- Figure 13.1 Concluding Remarks: Overall Market Landscape
- Figure 13.2 Concluding Remarks: Partnerships and Collaborations
- Figure 13.3 Concluding Remarks: Mergers and Acquisitions
- Figure 13.4 Concluding Remarks: Market Forecast
- Figure 13.5 Concluding Remarks: Total Cost of Ownership in Pharmaceutical Contract Research Organization
 臨床前資產市場:按服務、模型類型、最終用戶和地區分類委外研發機構(CRO) 市場:按服務類型、最終用戶、階段、外包類型、治療領域、臨床試驗類型、所用技術和地區分類
 2035年醫藥合約商業化(CCO)市場分析及預測:按類型、產品、服務、技術、組件、應用、最終用戶、模式和階段分類大麻素藥物發現與開發市場分析及預測(至2035年):按類型、產品、服務、技術、應用、形式、最終用戶、階段、模式和功能分類
 全球合約研究組織(CRO)市場規模、佔有率、趨勢和成長分析報告(2026-2034年)全球合約研究組織 (CRO) 服務市場:市場規模、份額、成長率、行業分析、按類型、應用和地區劃分的考慮因素以及未來預測 (2026-2034)
 全球CRDMO服務市場評估:依服務類型、產品類型、治療領域、最終用戶、地區、機會和預測(2018-2032年)
 受託研究機構市場規模、佔有率和成長分析(按治療領域、最終用戶和地區分類)—產業預測(2026-2033 年)
 合約委外研發機構服務市場按服務類型、治療領域、開發階段、最終用戶和合約期限分類 - 全球預測 2025-2032
 專業CRO市場:產業趨勢及全球預測 - 依治療領域、服務類型及重點地區劃分