


 |
市場調查報告書
商品編碼
1737057
DNA合成技術與服務市場:各DNA合成方法,主要的應用各領域,不同企業規模,各主要地區DNA Synthesis Technologies and Services Market Distribution by Method of DNA Synthesis, Key Applications Areas, Company Size, and Key Geographical Regions |
||||||
據估計,全球 DNA 合成技術與服務市場規模預計將從目前的 12 億美元增長到 2035 年的 86 億美元,預測期內的複合年增長率為 21.6%。
市場區隔與機會分析依下列參數劃分:
各DNA合成方法
- 化學的方法
- 酵素的方法
主要的應用各領域
- 調查·診斷
- 治療藥
不同企業規模
- 小規模
- 中規模
- 大企業
各主要地區
- 北美
- 歐洲
- 亞太地區
- 其他地區
DNA 合成技術與服務市場:成長與趨勢
人工 DNA 合成的概念對各領域都有廣泛的影響,包括基因電路設計、基因工程、基因組合成以及遺傳疾病的診斷和治療。值得注意的是,合成生物學已成為一項顛覆性技術,可為全球醫療保健、農業、製造業和環境問題提供新的解決方案。此外,分子生物學領域的最新趨勢,例如用於 DNA 化學合成的自動化強效化學品的開發,正在促進生物系統工程化,從而實現基因組的高通量研究。結合新一代定序 (NGS) 技術產生的定序數據,合成生物學可以定量分析 RNA 和 DNA,以研究與疾病和其他生物現象相關的遺傳變異。
值得注意的是,過去幾年新冠肺炎 (COVID-19) 的蔓延極大地推動了基於 DNA 和 RNA 的疫苗的研發,這些疫苗可在患者體內誘導強烈的免疫反應。此外,客製化 DNA 和 RNA 合成與基因編輯 CRISPR 技術以及其他合成生物學技術的結合,有望改變多種疾病的治療標準。 DNA 合成技術不僅促進了 DNA 的平行合成,還提供了無與倫比的精確度、可擴展性和速度。
多家公司已經開發了自己的酶促 DNA 合成平台,與傳統 DNA 合成方法相比,這些平台具有顯著優勢,例如可以合成更長的 DNA 片段、更易於獲取和更便捷。此外,相當一部分醫學研究人員和藥物開發人員更願意將其 DNA 合成和複製任務外包給聲稱擁有 DNA 合成和製造專業知識的第三方平台和服務提供者。隨著 DNA 需求在各種應用中的不斷增長,DNA 合成和 DNA 複製平台服務產業在預測期內可能會出現顯著的市場成長。
DNA 合成技術與服務市場:關鍵洞察
本報告深入探討了 DNA 合成技術和服務市場的現狀,並識別了該行業內的潛在成長機會。報告的主要發現包括:
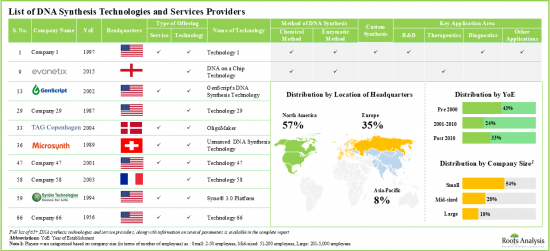
- 目前,約有 65 家公司聲稱擁有 DNA 合成技術和相關服務的必要專業知識。其中,超過 50% 是規模較小且新成立的公司。
- 這些技術和服務提供者聲稱使用經濟高效的 DNA 合成方法,並可能應用於各種生物醫學領域。
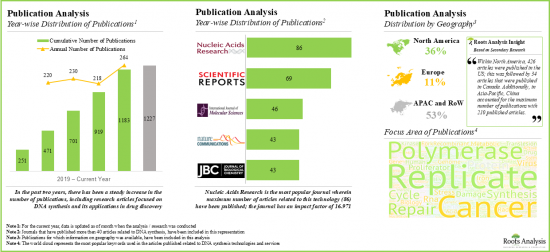
- 近年來,與 DNA 合成技術和服務相關的科學文獻出版數量顯著增加,此類論文已在 50 多個國家/地區發表。
- 人們對 DNA 合成技術和服務日益增長的興趣也體現在近期合作活動的增加上,事實上,從 2019 年到 2021 年,合作活動的複合年增長率達到了 18%。
- 過去幾年中,已向各個組織頒發了 150 項學術資助,以支持 DNA 合成技術領域持續的研究和創新工作。
- 意識到DNA合成技術和服務市場的潛力,多家投資者在過去五年中已投資超過7.5億美元。
- 自2016年以來,已有超過11,000項與DNA合成技術相關的專利被申請/授予,為該產業建立了強大的智慧財產權組合。
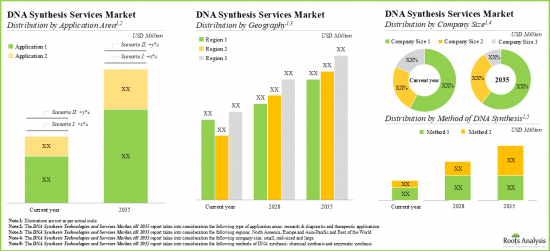
- 預計到2035年,DNA合成服務市場將以每年超過21.5%的速度成長,且成長機會可能會因合成方法、應用領域、公司規模和地區而異。
DNA 合成技術與服務市場:主要細分市場
根據 DNA 合成方法,市場分為化學法和酵素法。目前,化學法 DNA 合成在全球 DNA 合成技術與服務市場中佔比最大。此外,由於酶在 DNA 分離和合成中的應用日益增多,酶法有望以更快的速度增長。
根據主要應用,市場分為研究和診斷治療兩大領域。目前,研究和診斷領域在全球 DNA 合成技術與服務市場中佔比最高。值得注意的是,治療領域的DNA合成技術和服務市場可望維持相對較高的複合年增長率。
依公司規模劃分,市場分為小型、中型和大型公司。目前,大型公司在DNA合成技術和服務市場中佔最大佔有率。此外,值得注意的是,小型公司在DNA合成技術和服務市場中預計將保持相對較高的複合年增長率。
依主要地區劃分,市場分為北美、歐洲、亞太地區及世界其他地區。目前,北美在全球DNA合成技術和服務市場中佔據主導地位,佔據最大的收入佔有率。
本報告提供全球DNA合成技術與服務市場的相關調查,提供市場概要,以及各DNA合成方法,主要的應用各領域,不同企業規模,各主要地區的趨勢,及加入此市場的主要企業簡介等資訊。
目錄
第1章 序文
第2章 摘要整理
第3章 簡介
- 章概要
- DNA合成簡介
- DNA合成的結構要素
- DNA合成技術
- DNA合成的應用
- 未來展望
第4章 市場概要:DNA合成技術和服務
- 章概要
- DNA合成技術和服務:市場形勢
- DNA合成技術和服務:主要產業的參與企業
第5章 企業簡介
- 章概要
- Ajinomoto Bio-Pharma Services
- ATUM
- DNA Script
- Eurofins Genomics
- Gene Universal
- GenScript
- Synbio Technologies
第6章 案例研究:寡核甘酸製造(調查及診斷的應用)
- 章概要
- 研究招呼診斷用途重點的寡核甘酸製造商:市場形勢
第7章 案例研究:寡核甘酸製造商(治療用途)
- 章概要
- 治療用途重點的寡核甘酸製造商:市場形勢
第8章 夥伴關係和合作
第9章 資金籌措與投資分析
第10章 津貼分析
第11章 出版物的分析
第12章 專利分析
第13章 與DNA合成服務:市場預測機會分析
- 章概要
- 主要的前提與預測調查手法
- 全球DNA合成服務市場(到2035年)
- 北美DNA合成服務市場(到2035年)
- 歐洲的DNA合成服務市場(到2035年)
- 亞太地區及其他地區的DNA合成服務市場(到2035年)
第14章 結論
第15章 附錄1:表格形式資料
第16章 附錄II:企業及組織的一覽
DNA SYNTHESIS TECHNOLOGIES AND SERVICES MARKET: OVERVIEW
As per Roots Analysis, the global DNA synthesis technologies and services market is estimated to grow from USD 1.20 billion in the current year to USD 8.6 billion by 2035, at a CAGR of 21.6% during the forecast period, till 2035.
The market sizing and opportunity analysis has been segmented across the following parameters:
Method of DNA Synthesis
- Chemical Method
- Enzymatic Method
Key Applications Areas
- Research & Diagnostics
- Therapeutics
Company Size
- Small
- Mid-Sized
- Large
Key Geographical Regions
- North America
- Europe
- Asia-Pacific
- Rest of the World
DNA SYNTHESIS TECHNOLOGIES AND SERVICES MARKET: GROWTH AND TRENDS
The concept of artificial DNA synthesis has a far-reaching impact across multiple areas, including genetic circuit design, genetic engineering, genome synthesis, diagnosis and treatment of genetic diseases. It is worth mentioning that synthetic biology has emerged as a disruptive technology, capable of delivering new solutions to global healthcare, agriculture, manufacturing and environmental challenges. Moreover, the recent advancements in the field of molecular biology, such as the development of automatic robust chemistries (used for chemical synthesis of DNA) have contributed towards the engineering of biological systems by enabling high-throughput study genomes. Synthetic biology, when combined with sequenced data generated by next generation sequencing (NGS) technology, allows quantitative analysis of RNA and DNA to study the genetic variations associated with the disease or other biological phenomena.
Notably, the spread of the COVID-19 in the past few years has given a significant boost to the development of DNA and RNA-based vaccines to induce potent immune responses in patients. Moreover, customized DNA and RNA synthesis coupled with CRISPR technologies for gene editing and other synthetic biology technologies have demonstrated the potential to change the standard of care for a wide range of disease indications. DNA synthesis technologies not only facilitate parallelized synthesis of DNA but also provide unmatched precision, scalability and speed.
Several companies have developed proprietary enzymatic DNA synthesis platforms offering distinct advantages (such as the potential to increase the length of DNA fragments, greater accessibility and convenience) over conventional DNA synthesis methods. Furthermore, a significant proportion of medical researchers and drug developers prefer to outsource DNA synthesis and replication operations to third-party platforms / service providers who claim to provide expertise in DNA synthesis and production. Given the rising need for DNA across a wide range of applications, we are led to believe that the DNA synthesis and DNA replication platforms and services industry is likely to witness noteworthy market growth during the forecast period.
DNA SYNTHESIS TECHNOLOGIES AND SERVICES MARKET: KEY INSIGHTS
The report delves into the current state of the DNA synthesis technologies and services market and identifies potential growth opportunities within the industry. Some key findings from the report include:
- Around 65 companies presently claim to have the required expertise for DNA synthesis technologies and affiliated services; of these, more than 50% of players are small companies and have recently been established.
- These technology and service providers claim to employ different cost-effective methods for the synthesis of DNA, having applications in various biomedical fields.
- There has been a notable increase in the published scientific literature related to DNA synthesis technologies and services in the last few years; such articles have been published in over 50 countries.
- The growing interest in DNA synthesis technologies and services is reflected by the increase in partnership activity in the recent past; in fact, between 2019 and 2021, the partnership activity increased at a CAGR of 18%.
- Over the past few years, 150 academic grants have been awarded to various organizations in order to support the ongoing efforts related to research and innovation in the field of DNA synthesis technologies.
- Several investors, having realized the future opportunity associated with the DNA synthesis technologies and services market, have invested more than USD 750 million in the past five years.
- More than 11,000 patents have been filed / granted related to DNA synthesis technologies since 2016, establishing a strong portfolio of intellectual property within this industry.
- The DNA synthesis services market is expected to witness an annualized growth rate of more than 21.5% till 2035; the opportunity is likely to be distributed across method of synthesis, application area, company size and geography.
DNA SYNTHESIS TECHNOLOGIES AND SERVICES MARKET: KEY SEGMENTS
Chemical Method Segment Occupies the Largest Share of the DNA Synthesis Technologies and Services Market
Based on the method of DNA synthesis, the market is segmented into chemical method and enzymatic method. At present, the chemical method of DNA synthesis holds the maximum share of the global DNA synthesis technologies and services market. Additionally, the enzymatic method segment is likely to grow at a faster pace owing to the increasing use of enzymes for DNA isolation and synthesis.
By Key Application Area, Therapeutics is the Fastest Growing Segment of the Global DNA Synthesis Technologies and Services Market
Based on the key application area, the market is segmented into research and diagnostics, and therapeutics. Currently, the research and diagnostics segment captures the highest proportion of the global DNA synthesis technologies and services market. It is worth highlighting that the DNA synthesis technologies and services market for therapeutics segment is likely to grow at a relatively higher CAGR.
Large Company Size Segment Occupy the Largest Share of the DNA Synthesis Technologies and Services Market by Company Size
Based on the company size, the market is segmented into small, mid-sized and large companies. At present, the large companies segment holds the maximum share of the DNA synthesis technologies and services market. Further, it is worth highlighting that the DNA synthesis technologies and services market for small companies' segment is likely to grow at a relatively higher CAGR.
North America Accounts for the Largest Share of the Market
Based on key geographical regions, the market is segmented into North America, Europe, Asia-Pacific and Rest of the World. Currently, North America dominates the global DNA synthesis technologies and services market and accounts for the largest revenue share.
Example Players in the DNA Synthesis Technologies and Services Market
- Ajinomoto Bio-Pharma Services
- ATUM
- DNA Script
- Eurofins Genomics
- Gene Universal
- GenScript
- Synbio Technologies
DNA SYNTHESIS TECHNOLOGIES AND SERVICES MARKET: RESEARCH COVERAGE
- Market Sizing and Opportunity Analysis: The report features an in-depth analysis of the global DNA synthesis technologies and services market, focusing on key market segments, including [A] method of DNA synthesis, [B] key application area, [C] company size and [D] key geographical regions.
- Market Landscape: A comprehensive evaluation of DNA synthesis technologies and services, based on several relevant parameters, such as [A] type of offering, [B] method of DNA synthesis, [C] type of DNA molecule, [D] custom offerings and [E] application area. Additionally, the report provides information on drug developers, focusing on [F] year of establishment, [G] company size and [H] location of headquarters.
- Company Profiles: In-depth profiles of key players engaged in providing technologies and services for DNA synthesis, focusing on [A] overview of the company, [B] financial information (if available), [C] technology / service portfolio, and [D] recent developments and [E] an informed future outlook.
- Case Study 1: A detailed discussion on the current market landscape of oligonucleotide manufacturers focused on research and diagnostic applications, based on [A] year of establishment, [B] company size, [C] scale of operation, [D] location of headquarters, [E] number of manufacturing facilities, [F] location of facility, [G] regulatory accreditations and certifications received, [H] type of oligonucleotide manufactured, [I] type of offering, [J] type of manufacturing service(s) offered and [K] type of modification(s) offered.
- Case Study 2: A detailed discussion on the current market landscape of oligonucleotide manufacturers focused on research and therapeutic applications, based on [A] year of establishment, [B] company size, [C] scale of operation, [D] location of headquarters, [E] number of manufacturing facilities, [F] location of facility, [G] regulatory accreditations and certifications received, [H] type of oligonucleotide manufactured, [I] type of offering, [J] type of manufacturing service(s) offered and [K] type of modification(s) offered.
- Partnerships and Collaborations: An insightful analysis of the deals inked by stakeholders in the DNA synthesis technologies and services market, based on several parameters, such as [A] year of partnership, [B] type of partnership, [C] type of partner, [D] most active players (in terms of the number of partnerships signed) and [E] geographical distribution of partnership activity.
- Funding and Investment Analysis: An in-depth analysis of the fundings raised by DNA synthesis technologies and services companies, based on relevant parameters, such as [A] year of funding, [B] amount invested, [C] type of funding, [D] leading players, [E] leading investors and [F] geography.
- Grants Analysis: An in-depth analysis of academic grants that have been awarded to various research institutes for projects related to DNA synthesis technologies and services, based on relevant parameters, such as [A] year of grant award, [B] amount awarded, [C] type of funding institute, [D] popular NIH departments, [E] support period, [F] emerging focus area, [G] purpose of grants, [H] grant activity code, [I] local recipients, [J] type of recipient organization, [K] study section and [L] type of grant application. The chapter also highlights the popular recipient organizations and prominent program officers.
- Publication Analysis: An insightful analysis of more than 12,000 peer-reviewed scientific articles related to research on DNA synthesis technologies, based on various relevant parameters, such as [A] year of publication, [B] key focus area, [C] type of article, [D] popular keywords, [E] popular authors, [F] therapeutic area, [G] geography and [H] key journals.
- Patent Analysis: An in-depth analysis of patents filed / granted till date in the autoinjectors domain, based on various relevant parameters, such as [A] publication year, [B] geography, [C] CPC symbols, [D] emerging focus areas, [E] type of applicant, [F] leading industry players and [G] patent valuation.
KEY QUESTIONS ANSWERED IN THIS REPORT
- How many companies are currently engaged in this market?
- Which are the leading companies in this market?
- What factors are likely to influence the evolution of this market?
- What is the current and future market size?
- What is the CAGR of this market?
- How is the current and future market opportunity likely to be distributed across key market segments?
REASONS TO BUY THIS REPORT
- The report provides a comprehensive market analysis, offering detailed revenue projections of the overall market and its specific sub-segments. This information is valuable to both established market leaders and emerging entrants.
- Stakeholders can leverage the report to gain a deeper understanding of the competitive dynamics within the market. By analyzing the competitive landscape, businesses can make informed decisions to optimize their market positioning and develop effective go-to-market strategies.
- The report offers stakeholders a comprehensive overview of the market, including key drivers, barriers, opportunities, and challenges. This information empowers stakeholders to stay abreast of market trends and make data-driven decisions to capitalize on growth prospects.
ADDITIONAL BENEFITS
- Complimentary PPT Insights Packs
- Complimentary Excel Data Packs for all Analytical Modules in the Report
- 15% Free Content Customization
- Detailed Report Walkthrough Session with Research Team
- Free Updated report if the report is 6-12 months old or older
TABLE OF CONTENTS
1. PREFACE
- 1.1. Scope of the Report
- 1.2. Research Methodology
- 1.3. Key Questions Answered
- 1.4. Chapter Outlines
2. EXECUTIVE SUMMARY
3. INTRODUCTION
- 3.1. Chapter Overview
- 3.2. Introduction to DNA Synthesis
- 3.3. Components of DNA Synthesis
- 3.3.1. Substrates
- 3.3.2. Template
- 3.3.3. Primer
- 3.3.4. Enzymes
- 3.3.5. Leading Strand Synthesis
- 3.3.6. Lagging Strand Synthesis
- 3.4. DNA Synthesis Technologies
- 3.4.1. Chemical Method of DNA Synthesis
- 3.4.2. Enzymatic Method of DNA Synthesis
- 3.5. Applications of DNA Synthesis
- 3.6. Future Perspectives
4. MARKET OVERVIEW: DNA SYNTHESIS TECHNOLOGIES AND SERVICES
- 4.1. Chapter Overview
- 4.2. DNA Synthesis Technologies and Services: Overall Market Landscape
- 4.2.1. Analysis by Type of Offering
- 4.2.2. Analysis by Method of DNA Synthesis
- 4.2.3. Analysis by Type of DNA Molecule
- 4.2.4. Analysis by Custom Offerings
- 4.2.5. Analysis by Application Area
- 4.3. DNA Synthesis Technologies and Services: Key Industry Players
- 4.3.1. Analysis by Year of Establishment
- 4.3.2. Analysis by Company Size
- 4.3.3. Analysis by Location of Headquarters
- 4.3.4. Analysis by Application Area and Region
5. COMPANY PROFILES
- 5.1. Chapter Overview
- 5.2. Ajinomoto Bio-Pharma Services
- 5.2.1. Company Overview
- 5.2.2. Financial Information
- 5.2.3. Technology / Service Portfolio
- 5.2.4. Recent Developments and Future Outlook
- 5.3. ATUM
- 5.3.1. Company overview
- 5.3.2. Technology / Service Portfolio
- 5.3.3. Recent Developments and Future Outlook
- 5.4. DNA Script
- 5.4.1. Company Overview
- 5.4.2. Technology / Service Portfolio
- 5.4.3. Recent Developments and Future Outlook
- 5.5. Eurofins Genomics
- 5.5.1. Company Overview
- 5.5.2. Financial Information
- 5.5.3. Technology / Service Portfolio
- 5.5.4. Recent Developments and Future Outlook
- 5.6. Gene Universal
- 5.6.1. Company Overview
- 5.6.2. Technology / Service Portfolio
- 5.6.3. Recent Developments and Future Outlook
- 5.7. GenScript
- 5.7.1. Company Overview
- 5.7.2. Financial Information
- 5.7.3. Technology / Service Portfolio
- 5.7.4. Recent Developments and Future Outlook
- 5.8. Synbio Technologies
- 5.8.1. Company overview
- 5.8.2. Technology / Service Portfolio
- 5.8.3. Recent Developments and Future Outlook
6. CASE STUDY: OLIGONUCLEOTIDE MANUFACTURERES (RESEARCH AND DIAGNOSTIC APPLICATIONS)
- 6.1. Chapter Overview
- 6.2. Oligonucleotide Manufacturers Focused on Research and Diagnostic Applications: Overall Market Landscape
- 6.2.1. Analysis by Year of Establishment
- 6.2.2. Analysis by Company Size
- 6.2.3. Analysis by Scale of Operation
- 6.2.4. Analysis by Geographical Location
- 6.2.5. Analysis by Location of Manufacturing Facilities
- 6.2.6. Analysis by Regulatory Accreditations / Certifications Received
- 6.2.7. Analysis by Type of Oligonucleotide Manufactured
- 6.2.8. Analysis by Type of Offering
- 6.2.9. Analysis by Type of Manufacturing Service Offered
- 6.2.10. Analysis by Type of Modification
7. CASE STUDY: OLIGONUCLEOTIDE MANUFACTURERES (THERAPEUTIC APPLICATIONS)
- 7.1. Chapter Overview
- 7.2. Oligonucleotide Manufacturers Focused on Therapeutic Applications: Overall Market Landscape
- 7.2.1. Analysis by Year of Establishment
- 7.2.2. Analysis by Company Size
- 7.2.3. Analysis by Scale of Operation
- 7.2.4. Analysis by Geographical Location
- 7.2.5. Analysis by Location of Manufacturing Facilities
- 7.2.6. Analysis by Regulatory Accreditations / Certifications
- 7.2.7. Analysis by Type of Oligonucleotide Manufactured
- 7.2.8. Analysis by Type of Offering
- 7.2.9. Analysis by Type of Manufacturing Service Offered
- 7.2.10. Analysis by Type of Modification
8. PARTNERSHIPS AND COLLABORATIONS
- 8.1. Chapter Overview
- 8.2. Partnership Models
- 8.3. DNA Synthesis Technologies and Services: List of Partnerships and Collaborations
- 8.3.1. Analysis by Year of Partnership
- 8.3.2. Analysis by Type of Partnership
- 8.3.3. Analysis by Type of Partner
- 8.3.4. Analysis by Year and Type of Partner
- 8.3.5. Most Active Players: Analysis by Number of Partnerships
- 8.3.6. Regional Analysis
- 8.3.6.1. Intercontinental and Intracontinental Agreements
9. FUNDING AND INVESTMENT ANALYSIS
- 9.1. Chapter Overview
- 9.2. Types of Funding
- 9.3. DNA Synthesis Technologies: Recent Funding Instances
- 9.4. Analysis by Year of Investment
- 9.5. Analysis by Amount Invested
- 9.6. Analysis by Amount Invested
- 9.7. Analysis by Type of Funding and Amount Invested
- 9.8. Analysis by Venture Capital Funding
- 9.9. Most Active Players: Analysis by Number of Funding Instances
- 9.10. Key Investors: Analysis by Number of Funding Instances
- 9.11. Regional Analysis by Amount Invested
- 9.12. Funding and Investment Summary
10. GRANT ANALYSIS
- 10.1. Chapter Overview
- 10.2. Analysis Methodology and Key Parameters
- 10.3. DNA Synthesis Technologies and Services: List of Academic Grants
- 10.3.1. Analysis by Year of Grant Award
- 10.3.2. Analysis by Grant Amount Awarded
- 10.3.3. Analysis by Administering Institute Center
- 10.3.4. Analysis by Support Period
- 10.3.5. Analysis by Administering Institute Center and Support Period
- 10.3.6. Analysis by Type of Grant Application
- 10.3.7. Analysis by Grant Activity Code
- 10.3.8. Word Cloud of Study Titles
- 10.3.9. Analysis by Purpose of Grant Award
- 10.3.10. Popular NIH Departments: Analysis by Number of Grants
- 10.3.11. Analysis by Type of Recipient Organization
10..12. Prominent Program Officers: Analysis by Number of Grants
11. PUBLICATION ANALYSIS
- 11.1. Chapter Overview
- 11.2. Analysis Methodology and Key Parameters
- 11.3. Analysis by Year of Publication
- 11.4. Analysis by Quarterly Distribution of Publication
- 11.5. Analysis by Type of Article
- 11.6. Analysis by Popular Keywords
- 11.7. Most Popular Authors: Analysis by Number of Publications
- 11.8. Popular Publishers: Analysis by Number of Publications
- 11.9. Popular Journals: Analysis by Number of Publications
- 11.10. Analysis by Therapeutic Area
- 11.11. Geographical Analysis
12. PATENT ANALYSIS
- 12.1. Chapter Overview
- 12.2. Analysis Methodology and Key Parameters
- 12.3. DNA Synthesis Technologies and Services: Patent Analysis
- 12.3.1. Analysis by Type of Patent
- 12.3.2. Analysis by Publication Year
- 12.3.3. Analysis by Type of Patent and Publication Year
- 12.3.4. Analysis by Issuing Authority
- 12.3.5. Analysis by CPC Symbols
- 12.3.6. Analysis by Type of Applicant
- 12.3.7. Word Cloud Analysis: Emerging Focus Areas
- 12.3.8. Leading Industry Players: Analysis by Number of Patents
- 12.3.9. Leading Non-Industry Players: Analysis by Number of Patents
- 12.3.10. Leading Players: Analysis by Number of Patents
- 12.3.11. Leading Patents: International Patents
- 12.3.12. Analysis by Patent Characteristics
- 12.3.13. Patent Valuation Analysis
13. DNA SYNTHESIS SERVICES: MARKET FORECAST AND OPPORTUNITY ANALYSIS
- 13.1. Chapter Overview
- 13.2. Key Assumptions and Forecast Methodology
- 13.3. Global DNA Synthesis Services Market, Till 2035
- 13.3.1. Global DNA Synthesis Services Market: Distribution by Method of DNA Synthesis, Till 2035
- 13.3.2. Global DNA Synthesis Services Market: Distribution by Application Area, Till 2035
- 13.3.3. Global DNA Synthesis Services Market: Distribution by Company Size, Till 2035
- 13.3.4. Global DNA Synthesis Services Market: Distribution by Geography, Till 2035
- 13.4. DNA Synthesis Services Market in North America, Till 2035
- 13.4.1. DNA Synthesis Services Market in North America: Distribution by Method of DNA Synthesis, Till 2035
- 13.4.2. DNA Synthesis Services Market in North America: Distribution by Application Area, Till 2035
- 13.4.3. DNA Synthesis Services Market in North America: Distribution by Company Size, Till 2035
- 13.5. DNA Synthesis Services Market in Europe, Till 2035
- 13.5.1. DNA Synthesis Services Market in Europe: Distribution by Method of DNA Synthesis, Till 2035
- 13.5.2. DNA Synthesis Services Market in Europe: Distribution by Application Area, Till 2035
- 13.5.3. DNA Synthesis Services Market in Europe: Distribution by Company Size, Till 2035
- 13.6. DNA Synthesis Services Market in Asia-Pacific and Rest of the World, Till 2035
- 13.6.1. DNA Synthesis Services Market in Asia-Pacific and Rest of the World: Distribution by Method of DNA Synthesis, Till 2035
- 13.6.2. DNA Synthesis Services Market in Asia-Pacific and Rest of the World: Distribution by Application Area, Till 2035
- 13.6.3. DNA Synthesis Services Market in Asia-Pacific and Rest of the World: Distribution by Company Size, Till 2035
14. CONCLUDING REMARKS
15. APPENDIX 1: TABULATED DATA
16. APPENDIX II: LIST OF COMPANIES AND ORGANIZATIONS
List of Tables
- Table 4.1 DNA Synthesis Technologies and Services: Information on Developers, Type of Offering, Method of DNA Synthesis, Type of DNA Molecule, Custom Offerings and Type of Application Area
- Table 4.2 DNA Synthesis Technologies and Services Providers: Information on Year of Establishment, Company Size and Geography
- Table 5.1 DNA Synthesis Technology and Service Providers: List of Companies Profiled
- Table 5.2 Ajinomoto Bio-Pharma Services: Company Snapshot
- Table 5.3 Ajinomoto Bio-Pharma Services: Technology / Service Portfolio
- Table 5.4 Ajinomoto Bio-Pharma Services: Recent Developments and Future Outlook
- Table 5.5 ATUM: Company Snapshot
- Table 5.6 ATUM: Technology / Service Portfolio
- Table 5.7 DNA Script: Company Snapshot
- Table 5.8 DNA Script: Technology / Service Portfolio
- Table 5.9 DNA Script: Recent Developments and Future Outlook
- Table 5.10 Eurofins Genomics: Company Snapshot
- Table 5.11 Eurofins Genomics: Technology / Service Portfolio
- Table 5.12 Gene Universal: Company Snapshot
- Table 5.13 Gene Universal: Technology / Service Portfolio
- Table 5.14 GenScript: Company Snapshot
- Table 5.15 GenScript Technology / Service Portfolio
- Table 5.16 GenScript: Recent Developments and Future Outlook
- Table 5.17 Synbio Technologies: Company Snapshot
- Table 5.18 Synbio Technologies: Technology / Service Portfolio
- Table 6.1 Oligonucleotide Manufacturers Focused on Research and Diagnostic Applications: List of Industry Players
- Table 6.2 Oligonucleotide Manufacturers Focused on Research and Diagnostic Applications: Information on Location of Manufacturing Facilities and Regulatory Accreditations / Certifications
- Table 6.3 Oligonucleotide Manufacturers Focused on Research and Diagnostic Applications: Information on Type of Oligonucleotide Manufactured and Type of Service(s) Offered
- Table 6.4 Oligonucleotide Manufacturers Focused on Research and Diagnostic Applications: Information on Type of Manufacturing Service(s) Offered
- Table 6.5 Oligonucleotide Manufacturers Focused on Research and Diagnostic Applications: Information on Type of Modification(s) and Type of Purification Method(s) Used
- Table 7.1 Oligonucleotide Manufacturers Focused on Therapeutic Applications: List of Industry Players
- Table 7.2 Oligonucleotide Manufacturers Focused on Therapeutic Applications: Information on Location of Manufacturing Facilities and Regulatory Accreditations / Certifications
- Table 7.3 Oligonucleotide Manufacturers Focused on Therapeutic Applications: Information on Type of Oligonucleotide Manufactured and Type of Offering
- Table 7.4 Oligonucleotide Manufacturers Focused on Therapeutic Applications: Information on Type of Manufacturing Service(s) Offered
- Table 7.5 Oligonucleotide Manufacturers Focused on Therapeutic Applications: Information on Type of Modification(s) and Type of Purification Method(s) Used
- Table 8.1 DNA Synthesis Technologies and Services Providers: List of Partnerships and Collaborations, Since 2017 (till March)
- Table 9.1 DNA Synthesis Technologies: List of Funding Instances, Since 2017 (till March)
- Table 9.2 Funding and Investment Analysis: Summary of Investments
- Table 10.1 DNA Synthesis Technologies and Services: List of Academic Grants
- Table 12.1 Patent Analysis: CPC Symbols
- Table 12.2 Patent Analysis: Most Popular CPC Symbols
- Table 12.3 Patent Analysis: List of Top 10 CPC Symbols
- Table 12.4 Patent Analysis: List of Relatively High Value Patents
- Table 16.1 DNA Synthesis Technologies and Services: Distribution by Type of Offering
- Table 16.2 DNA Synthesis Technologies and Services: Distribution by Method of DNA Synthesis
- Table 16.3 DNA Synthesis Technologies and Services: Distribution by Type of DNA Molecule
- Table 16.4 DNA Synthesis Technologies and Services: Distribution by Custom Synthesis
- Table 16.5 DNA Synthesis Technologies and Services: Distribution by Application Area
- Table 16.6 DNA Synthesis Technologies and Service Providers: Distribution by Year of Establishment
- Table 16.7 DNA Synthesis Technologies and Service Providers: Distribution by Company Size
- Table 16.8 DNA Synthesis Technologies and Service Providers Distribution by Location of Headquarters
- Table 16.9 DNA Synthesis Technologies and Service Providers Distribution by Application and Region
- Table 16.10 Ajinomoto Bio-Pharma Services: Annual Revenues Since FY 2018 (JPY Billion)
- Table 16.11 Eurofins Genomics: Annual Revenues Since FY 2018 (JPY Billion)
- Table 16.12 GenScript: Annual Revenues, Since FY 2018 (USD Billion)
- Table 16.13 Oligonucleotide Manufacturers Focused on Research and Diagnostic Applications: Distribution by Year of Establishment
- Table 16.14 Oligonucleotide Manufacturers Focused on Research and Diagnostic Applications: Distribution by Company Size
- Table 16.15 Oligonucleotide Manufacturers Focused on Research and Diagnostic Applications: Distribution by Scale of Operation
- Table 16.16 Oligonucleotide Manufacturers Focused on Research and Diagnostic Applications: Distribution by Location of Headquarters
- Table 16.17 Oligonucleotide Manufacturers Focused on Research and Diagnostic Applications: Distribution by Location of Manufacturing Facilities (Country-wise)
- Table 16.18 Oligonucleotide Manufacturers Focused on Research and Diagnostic Applications: Distribution by Regulatory Accreditations / Certifications
- Table 16.19 Oligonucleotide Manufacturers Focused on Research and Diagnostic Applications: Distribution by Type of Oligonucleotide Manufactured
- Table 16.20 Oligonucleotide Manufacturers Focused on Research and Diagnostic Applications: Distribution by Type of Offering
- Table 16.21 Oligonucleotide Manufacturers Focused on Research and Diagnostic Applications: Distribution by Company Size and Type of Offering
- Table 16.22 Oligonucleotide Manufacturers Focused on Research and Diagnostic Applications: Distribution by Type of Oligonucleotide Manufactured and Type of Offering (Custom Synthesis)
- Table 16.23 Oligonucleotide Manufacturers Focused on Research and Diagnostic Applications: Distribution by Type of Manufacturing Service(s) Offered
- Table 16.24 Oligonucleotide Manufacturers Focused on Therapeutic Applications: Distribution by Year of Establishment
- Table 16.25 Oligonucleotide Manufacturers Focused on Therapeutic Applications: Distribution by Company Size
- Table 16.26 Oligonucleotide Manufacturers Focused on Therapeutic Applications: Distribution by Scale of Operation
- Table 16.27 Oligonucleotide Manufacturers Focused on Therapeutic Applications: Distribution by Location of Headquarters6
- Table 16.28 Oligonucleotide Manufacturers Focused on Therapeutic Applications: Distribution by Location of Manufacturing Facilities (Country-wise)
- Table 16.29 Oligonucleotide Manufacturers Focused on Therapeutic Applications: Distribution by Regulatory Accreditations / Certifications
- Table 16.30 Oligonucleotide Manufacturers Focused on Therapeutic Applications: Distribution by Type of Oligonucleotide Manufactured
- Table 16.31 Oligonucleotide Manufacturers Focused on Therapeutic Applications: Distribution by Type of Offering
- Table 16.32 Oligonucleotide Manufacturers Focused on Therapeutic Applications: Distribution by Company Size and Type of Offering16
- Table 16.33 Oligonucleotide Manufacturers Focused on Therapeutic Applications: Distribution by Type of Oligonucleotide Manufactured and Type of Offering (Modification)
- Table 16.34 Oligonucleotide Manufacturers Focused on Therapeutic Applications: Distribution by Type of Manufacturing Service (s) Offered
- Table 16.35 Partnerships and Collaborations: Cumulative Year-wise Trend, Since 2017
- Table 16.36 Partnerships and Collaborations: Distribution by Type of Partnership
- Table 16.37 Partnerships and Collaborations: Distribution by Year and Type of Partnership, Since 2017
- Table 16.38 Most Active Players: Distribution by Number of Partnerships
- Table 16.39 Partnerships and Collaborations: Distribution by Type of Partner
- Table 16.40 Partnerships and Collaborations: Distribution by Year and Type of Partner
- Table 16.41 Partnerships and Collaborations: Regional Distribution
- Table 16.42 Partnerships and Collaborations: Intercontinental and Intracontinental Agreements
- Table 16.43 DNA Synthesis Technologies: Distribution by Year of Investment, Since 2017
- Table 16.44 DNA Synthesis Technologies: Cumulative Amount Invested by Year, Since 2017 (USD Million)
- Table 16.45 Funding and Investments: Distribution by Type of Funding
- Table 16.46 Funding and Investments: Distribution of Amount Invested by Type of Funding (USD Million)
- Table 16.47 Distribution by Type of Venture Capital Funding
- Table 16.48 Most Active Players: Distribution by Number of Funding Rounds
- Table 16.49 Most Active Players: Distribution by Amount Raised Since 2017 (USD Million)
- Table 16.50 Funding and Investment: Distribution of investors by number of instances
- Table 16.51 Funding and Investment Analysis: Regional Distribution of Total Amount Invested, Since 2017
- Table 16.52 Grant Analysis: Distribution by Year of Grant Award
- Table 16.53 Grant Analysis: Distribution by Grant Amount Awarded
- Table 16.54 Grant Analysis: Distribution by Administering Institute Center
- Table 16.55 Grant Analysis: Distribution by Support Period
- Table 16.56 Grant Analysis: Distribution by Administering Institute Center and Support Year
- Table 16.57 Grant Analysis: Distribution by Type of Grant Application
- Table 16.58 Grant Analysis: Distribution by Grant Activity Code
- Table 16.59 Grant Analysis: Word Cloud of Study Titles
- Table 16.60 Grant Analysis: Distribution by Purpose of Grant Award
- Table 16.61 Grant Analysis: Distribution by Type of Recipient Organization
- Table 16.62 Popular NIH Departments: Distribution by Number of Grants
- Table 16.63 Prominent Program Officers: Distribution by Number of Grants
- Table 16.64 Publication Analysis: Cumulative Year-wise Trend, Since 2017
- Table 16.65 Publication Analysis: Quarterly Distribution of Publications
- Table 16.66 Publication Analysis: Distribution by Type of Article
- Table 16.67 Publication Analysis: Word Cloud of Study Titles
- Table 16.68 Analysis by Popular Keywords
- Table 16.69 Most Popular Authors: Distribution by Number of Publications
- Table 16.70 Popular Publishers: Distribution by Number of Publications
- Table 16.71 Popular Journals: Distribution by Number of Publications
- Table 16.72 Popular Journals: Distribution by Number of Publications
- Table 16.73 Publication Analysis: Distribution by Geography
- Table 16.74 Patent Analysis: Distribution by Type of Patent
- Table 16.75 Patent Analysis: Cumulative Distribution by Publication Year
- Table 16.76 Patent Analysis: Distribution of Granted Patents by Publication Year
- Table 16.77 Patent Analysis: Distribution of Filed Patents Publication Year
- Table 16.78 Patent Analysis: Distribution by Type of Patent and Publication Year
- Table 16.79 Patent Analysis: Distribution by Issuing Authority
- Table 16.80 Patent Analysis: Cumulative Year-wise Distribution by Type of Applicant
- Table 16.81 Leading Industry Players: Distribution by Number of Patents
- Table 16.82 Leading Non-Industry Players: Distribution by Number of Patents
- Table 16.83 Patent Analysis: Distribution by Patent Age
- Table 16.84 Patent Analysis: Distribution by Relative Valuation
- Table 16.85 Global DNA Synthesis Services Market: Distribution by Method of DNA Synthesis, Till 2035 (USD Million)
- Table 16.86 Global DNA Synthesis Services Market: Distribution by Company Size, Till 2035 (USD Million)
- Table 16.87 Global DNA Synthesis Services Market: Distribution by Company Size, Till 2035 (USD Million)
- Table 16.88 Global DNA Synthesis Services Market: Distribution by Type of Application Area, Till 2035 (USD Million)
- Table 16.89 Global DNA Synthesis Services Market: Distribution by Geography, Till 2035 (USD Million)
- Table 16.90 DNA Synthesis Services Market in North America, Till 2035 (USD Million)
- Table 16.91 DNA Synthesis Services Market in North America: Distribution by Method of DNA Synthesis, Till 2035 (USD Million)
- Table 16.92 DNA Synthesis Services Market in North America: Distribution by Type of Application Area, Till 2035 (USD Million)
- Table 16.93 DNA Synthesis Services Market in North America: Distribution by Company Size, Till 2035 (USD Million)
- Table 16.94 DNA Synthesis Services Market in Europe, Till 2035 (USD Million)
- Table 16.95 DNA Synthesis Services Market in Europe: Distribution by Method of DNA Synthesis, Till 2035 (USD Million)
- Table 16.96 DNA Synthesis Services Market in Europe: Distribution by Type of Application Area, Till 2035 (USD Million)
- Table 16.97 DNA Synthesis Services Market in Europe: Distribution by Company Size, Till 2035 (USD Million)
- Table 16.98 DNA Synthesis Services Market in Asia-Pacific and Rest of the World, Till 2035 (USD Million)
- Table 16.99 DNA Synthesis Services Market in Asia-Pacific and Rest of the World: Distribution by Method of DNA Synthesis, Till 2035 (USD Million)
- Table 16.100 DNA Synthesis Services Market in Asia-Pacific and Rest of the World: Distribution by Type of Application Area, Till 2035 (USD Million)
- Table 16.101 DNA Synthesis Services Market in Asia-Pacific and Rest of the World: Distribution by Company Size, Till 2035 (USD Million)
List of Figures
- Figure 3.1 DNA Synthesis 5' to 3'
- Figure 3.2 DNA Synthesis: Direction of Fork Movement
- Figure 3.3 Leading Strand Synthesis
- Figure 3.4 Lagging Strand Synthesis
- Figure 3.5 Applications of DNA Synthesis
- Figure 4.1 DNA Synthesis Technologies and Services: Distribution by Type of Offering
- Figure 4.2 DNA Synthesis Technologies and Services: Distribution by Method of DNA Synthesis
- Figure 4.3 DNA Synthesis Technologies and Services: Distribution by Type of DNA Molecule
- Figure 4.4 DNA Synthesis Technologies and Services: Distribution by Custom Offerings
- Figure 4.5 DNA Synthesis Technologies and Services: Distribution by Application Area
- Figure 4.6 DNA Synthesis Technologies and Service Providers: Distribution by Year of Establishment
- Figure 4.7 DNA Synthesis Technologies and Service Providers: Distribution by Company Size
- Figure 4.8 DNA Synthesis Technologies and Service Providers: Distribution by Location of Headquarters
- Figure 4.9 DNA Synthesis Technologies and Service Providers: Distribution by Application Area and Region
- Figure 5.1 Ajinomoto Bio-Pharma Services: Annual Revenues Since FY 2018 (JPY Billion)
- Figure 5.2 Eurofins Genomics: Annual Revenues Since FY 2018 (JPY Billion)
- Figure 5.3 GenScript: Annual Revenues, Since FY 2018 (USD Billion)
- Figure 6.1 Oligonucleotide Manufacturers Focused on Research and Diagnostic Applications: Distribution by Year of Establishment
- Figure 6.2 Oligonucleotide Manufacturers Focused on Research and Diagnostic Applications: Distribution by Company Size
- Figure 6.3 Oligonucleotide Manufacturers Focused on Research and Diagnostic Applications: Distribution by Scale of Operation
- Figure 6.4 Oligonucleotide Manufacturers Focused on Research and Diagnostic Applications: Distribution by Geographical Location
- Figure 6.5 Oligonucleotide Manufacturers Focused on Research and Diagnostic Applications: Distribution by Location of Manufacturing Facilities (Country-wise)
- Figure 6.6 Oligonucleotide Manufacturers Focused on Research and Diagnostic Applications: Distribution by Regulatory Accreditations / Certifications
- Figure 6.7 Oligonucleotide Manufacturers Focused on Research and Diagnostic Applications: Distribution by Type of Oligonucleotide Manufactured
- Figure 6.8 Oligonucleotide Manufacturers Focused on Research and Diagnostic Applications: Distribution by Type of Offering
- Figure 6.9 Oligonucleotide Manufacturers Focused on Research and Diagnostic Applications: Distribution by Company Size and Type of Offering
- Figure 6.10 Oligonucleotide Manufacturers Focused on Research and Diagnostic Applications: Distribution by Type of Oligonucleotide Manufactured and Type of Offering (Custom Synthesis)
- Figure 6.11 Oligonucleotide Manufacturers Focused on Research and Diagnostic Applications: Distribution by Type of Manufacturing Service(s) Offered
- Figure 7.1 Oligonucleotide Manufacturers Focused on Therapeutic Applications: Distribution by Year of Establishment
- Figure 7.2 Oligonucleotide Manufacturers Focused on Therapeutic Applications: Distribution by Company Size
- Figure 7.3 Oligonucleotide Manufacturers Focused on Therapeutic Applications: Distribution by Scale of Operation
- Figure 7.5 Oligonucleotide Manufacturers Focused on Therapeutic Applications: Distribution by Geographical Location
- Figure 7.6 Oligonucleotide Manufacturers Focused on Therapeutic Applications: Distribution by Location of Manufacturing Facilities (Country-wise)
- Figure 7.7 Oligonucleotide Manufacturers Focused on Therapeutic Applications: Distribution by Regulatory Accreditations / Certifications
- Figure 7.8 Oligonucleotide Manufacturers Focused on Therapeutic Applications: Distribution by Type of Oligonucleotide Manufactured
- Figure 7.9 Oligonucleotide Manufacturers Focused on Therapeutic Applications: Distribution by Type of Offering
- Figure 7.10 Oligonucleotide Manufacturers Focused on Therapeutic Applications: Distribution by Company Size and Type of Offering
- Figure 7.11 Oligonucleotide Manufacturers Focused on Therapeutic Applications: Distribution by Type of Oligonucleotide Manufactured and Type of Offering (Modification)
- Figure 7.13 Oligonucleotide Manufacturers Focused on Therapeutic Applications: Distribution by Type of Manufacturing Service (s) Offered
- Figure 8.1 Partnerships and Collaborations: Cumulative Year-wise Trend, Since 2017
- Figure 8.2 Partnerships and Collaborations: Distribution by Type of Partnership
- Figure 8.3 Partnerships and Collaborations: Distribution by Type of Partner
- Figure 8.4 Partnerships and Collaborations: Distribution by Year and Type of Partner
- Figure 8.5 Partnerships and Collaborations: Distribution by Year and Type of Partnership, Since 2017
- Figure 8.6 Most Active Players: Distribution by Number of Partnerships
- Figure 8.7 Partnerships and Collaborations: Regional Distribution
- Figure 8.8 Partnerships and Collaborations: Intercontinental and Intracontinental Agreements
- Figure 9.1 DNA Synthesis Technologies: Cumulative Distribution by Year of Investment, Since 2017
- Figure 9.2 DNA Synthesis Technologies: Cumulative Amount Invested by Year, Since 2017 (USD Million)
- Figure 9.3 Funding and Investments: Distribution by Type of Funding
- Figure 9.4 Funding and Investments: Distribution of Amount Invested by Type of Funding (USD Million)
- Figure 9.5 Funding and Investments: Distribution by Type of Venture Capital Funding
- Figure 9.6 Most Active Players: Distribution by Number of Funding Instances
- Figure 9.7 Most Active Players: Distribution by Amount Raised, Since 2017 (USD Million)
- Figure 9.8 Funding and Investments: Distribution of Investors by Number of Instances
- Figure 9.9 Funding and Investments: Regional Distribution by Amount Invested, Since 2017
- Figure 9.10 Summary of Funding and Investments
- Figure 10.1. Grant Analysis: Distribution by Year of Grant Award (Since 2017)
- Figure 10.2. Grant Analysis: Distribution by Grant Amount Awarded (USD Million)
- Figure 10.3. Grant Analysis: Distribution by Administering Institute Center
- Figure 10.4. Grant Analysis: Distribution by Support Period
- Figure 10.5. Grant Analysis: Distribution by Administering Institute Center and Support Period
- Figure 10.6. Grant Analysis: Distribution by Type of Grant Application
- Figure 10.7. Grant Analysis: Distribution by Grant Activity Code
- Figure 10.8. Word Cloud Analysis: Emerging Focus Areas
- Figure 10.9. Grant Analysis: Distribution by Purpose of Grant Award
- Figure 10.10. Popular NIH Departments: Distribution by Number of Grants
- Figure 10.11. Grant Analysis: Distribution by Type of Recipient Organization
- Figure 10.12. Prominent Program Officers: Distribution by Number of Grants
- Figure 11.1. Publication Analysis: Cumulative Year-wise Trend, Since 2017
- Figure 11.2. Publication Analysis: Quarterly Distribution of Publications, Since 2017
- Figure 11.3. Publication Analysis: Distribution by Type of Article
- Figure 11.4. Word Cloud Analysis: Emerging Focus Areas
- Figure 11.5. Analysis by Popular Keywords
- Figure 11.6. Most Popular Authors: Distribution by Number of Publications
- Figure 11.7. Popular Publishers: Distribution by Number of Publications
- Figure 11.8. Popular Journals: Distribution by Number of Publications
- Figure 11.9. Publication Analysis: Distribution by Therapeutic Area
- Figure 11.10. Publication Analysis: Distribution by Geography
- Figure 12.1. Patent Analysis: Distribution by Type of Patent
- Figure 12.2. Patent Analysis: Cumulative Distribution by Publication Year (Since 2017)
- Figure 12.3. Patent Analysis: Year-wise Distribution of Granted Patents, Since 2017
- Figure 12.4. Patent Analysis: Year-wise Distribution of Filed Patents, Since 2017
- Figure 12.5. Patent Analysis: Distribution by Type of Patent and Publication Year
- Figure 12.6. Patent Analysis: Distribution by Issuing Authority
- Figure 12.7. Patent Analysis: Distribution by CPC Symbols
- Figure 12.8. Patent Analysis: Cumulative Year-wise Distribution by Type of Applicant
- Figure 12.9. Word Cloud Analysis: Emerging Focus Areas
- Figure 12.10. Leading Industry Players: Distribution by Number of Patents
- Figure 12.11. Leading Non-Industry Players: Distribution by Number of Patents
- Figure 12.12. Patent Analysis: Distribution by Patent Age
- Figure 12.13. Patent Analysis: Distribution by Relative Valuation
- Figure 13.1. Global DNA Synthesis Services Market: Distribution by Method of DNA Synthesis, Till 2035 (USD Million)
- Figure 13.2. Global DNA Synthesis Services Market: Distribution by Company Size, Till 2035 (USD Million)
- Figure 13.3. Global DNA Synthesis Services Market: Distribution by Application Area, Till 2035 (USD Million)
- Figure 13.4. Global DNA Synthesis Services Market: Distribution by Geography, Till 2035 (USD Million)
- Figure 13.5. DNA Synthesis Services Market in North America, Till 2035 (USD Million)
- Figure 13.6. DNA Synthesis Services Market in North America: Distribution by Method of DNA Synthesis, Till 2035 (USD Million)
- Figure 13.7. DNA Synthesis Services Market in North America: Distribution by Application Area, Till 2035 (USD Million)
- Figure 13.8. DNA Synthesis Services Market in North America: Distribution by Company Size, Till 2035 (USD Million)
- Figure 13.9. DNA Synthesis Services Market in Europe, Till 2035 (USD Million)
- Figure 13.10. DNA Synthesis Services Market in Europe: Distribution by Method of DNA Synthesis, Till 2035 (USD Million)
- Figure 13.11. DNA Synthesis Services Market in Europe: Distribution by Application Area, Till 2035 (USD Million)
- Figure 13.12. DNA Synthesis Services Market in Europe: Distribution by Company Size, Till 2035 (USD Million)
- Figure 13.13. DNA Synthesis Services Market in Asia-Pacific and Rest of the World, Till 2035 (USD Million)
- Figure 13.14. DNA Synthesis Services Market in Asia-Pacific and Rest of the World: Distribution by Method of DNA Synthesis, Till 2035 (USD Million)
- Figure 13.15. DNA Synthesis Services Market in Asia-Pacific and Rest of the World: Distribution by Application Area, Till 2035 (USD Million)
- Figure 13.16. DNA Synthesis Services Market in Asia-Pacific and Rest of the World: Distribution by Company Size, Till 2035 (USD Million)
- Figure 14.1. Concluding Remarks: Overall Market Landscape of DNA Synthesis Technologies and Services
- Figure 14.2. Concluding Remarks: Partnerships and Collaborations
- Figure 14.3. Concluding Remarks: Funding and Investments
- Figure 14.4. Concluding Remarks: Grant Analysis
- Figure 14.5. Concluding Remarks: Publication Analysis
- Figure 14.6. Concluding Remarks: Patent Analysis
 DNA條碼服務市場分析及預測(至2035年):按類型、產品類型、服務、技術、組件、應用、最終用戶、流程、解決方案和階段分類高通量DNA合成市場分析及預測(至2035年):依類型、產品、服務、技術、組件、應用、形式、最終用戶及製程分類
 基因合成市場-全球產業規模、佔有率、趨勢、機會、預測(按方法、服務、應用、最終用途、地區和競爭格局分類,2021-2031年)客製化基因合成服務市場-全球產業規模、佔有率、趨勢、機會、預測:按類型、應用、地區和競爭格局分類,2021-2031年
 7-ACA酶法合成市場:按酵素類型、產品類型、技術、製程類型和最終用戶分類-全球預測,2026-2032年基因合成服務市場按服務類型、平台技術、產品週期、應用和最終用戶分類-2026-2032年全球預測客製化基因合成服務市場:按應用、最終用戶、技術、基因長度和服務速度分類——2026-2032年全球預測按頭孢菌素類型、治療用途、產品形式、製程類型、酵素類型、最終用戶和分銷管道分類的酵素法頭孢菌素合成市場—2026-2032年全球預測酵素回收市場按技術、終端用途產業、酵素類型和應用分類-全球預測(2026-2032 年)酵素法活性藥物成分合成市場按技術、製程類型、API類型、治療用途和最終用戶分類-全球預測(2026-2032年)