


 |
市場調查報告書
商品編碼
1737049
按開發藥劑中AI市場:藥物研發階段,各治療領域,各主要地區AI in Drug Discovery Market Distribution by Drug Discovery Steps, Therapeutic Area and Key Geographies |
||||||
預計到 2035 年,全球藥物研發人工智慧市場規模將從目前的 18 億美元增長至 134 億美元,預測期內複合年增長率為 16.5%。
市場區隔與機會分析依下列參數細分:
藥物研發步驟
- 標靶識別/驗證
- 目標化合物創建/先導化合物識別
- 先導化合物優化
治療領域
- 腫瘤疾病
- 中樞神經疾病
- 感染疾病
- 呼吸疾病
- 心血管障礙
- 內分泌疾病
- 消化器官障礙
- 肌肉骨骼系統障礙
- 免疫學的障礙
- 皮膚科學性障礙
- 其他
主要地區
- 北美
- 歐洲
- 亞太地區
- 南美
- 中東·北非
- 其他地區
藥物研發中的人工智慧市場:成長與趨勢
藥物研發是一個複雜的過程,需要投入大量的時間和資源。根據多方統計,整個藥物研發過程(從最初的概念驗證到商業化上市)平均需要10-15年,而從概念到商業化的藥物研發需要40-100億美元的資本投入。包括標靶發現和先導分子鑑定在內的早期階段,對於藥物在臨床前和臨床試驗中的成功至關重要。儘管技術不斷進步,人們對生物系統的理解也不斷加深,但藥物研發過程仍被認為效率低。為了優化正在進行和未來的藥物研發項目,利害關係人正在探索先進的技術解決方案(例如藥物研發中的人工智慧),以便在藥物研發的各個階段做出更明智的決策。
大數據分析、深度學習和機器學習等基於人工智慧的工具有助於即時無縫且精準地收集數據。這種能力有助於減少臨床失敗,並確保研發早期階段的安全性。值得注意的是,過去兩年,該領域的投資金額已超過50%,反映出人們對以人工智慧為基礎的藥物研發工具的快速關注。事實上,輝瑞、賽諾菲和基因泰克等多家產業巨頭已在其內部藥物研發活動中使用各種人工智慧平台。鑑於人們對人工智慧在藥物研發領域的持續關注和日益廣泛的應用,預計該市場在預測期內將保持穩定成長。
藥物研發中的人工智慧市場:關鍵洞察
本報告深入探討了藥物研發中人工智慧市場的現狀,並識別了行業內的潛在成長機會。報告的主要發現包括:
- 目前,全球約有 210 家公司聲稱正在藥物研發和開發過程的各個階段使用基於人工智慧的技術。
- 大多數利害關係人具備與人工智慧相關的專業知識,能夠識別和優化針對不同治療領域的候選藥物。
- 預見到巨大的利潤潛力,許多公司正在大力投資,透過多項融資案例來推進產業參與者的計畫。
- 越來越多的合作夥伴專注於利用基於人工智慧的技術進行藥物研發,證明了利害關係人對該市場的興趣日益濃厚。
- 有些新進入者已經成功建立了強大的競爭地位。未來,我們預計會出現多起收購,而這些公司的相對估值可能是關鍵的決定因素。
- 近期,已有超過 260 項與基於人工智慧的藥物研發相關的專利申請/授權,這表明該領域的創新步伐正在加快。
- 在藥物研發的各個階段採用基於人工智慧的工具和營運方法,預計將影響研發支出,從而在全球範圍內顯著節省成本。
- 預計未來幾年該市場的複合年增長率將達到 16.5%,機會將廣泛分佈於各個藥物發現階段、治療領域和地區。
市場區隔:關鍵細分領域
根據藥物發現步驟,市場細分為標靶識別/驗證、藥物生成/先導化合物識別和先導化合物優化。目前,先導化合物優化細分領域在全球藥物發現人工智慧市場中佔據最大佔有率。此外,與其他細分領域相比,先導化合物優化細分領域的成長速度可能更快。
依治療領域劃分,市場細分為腫瘤學、中樞神經系統疾病、傳染病、呼吸系統疾病、心血管疾病、內分泌疾病、腸胃疾病、肌肉骨骼疾病、免疫疾病、皮膚疾病等。目前,腫瘤學領域在全球藥物研發人工智慧市場中佔比最高。腫瘤學領域的成長歸因於人工智慧在腫瘤學領域被廣泛應用,用於識別標靶治療藥物和生物標記。此外,值得注意的是,傳染病藥物研發人工智慧市場可望以相對較高的複合年增長率成長。
依主要地區劃分,市場細分為北美、歐洲、亞太地區、拉丁美洲、中東和北非以及世界其他地區。目前,北美在藥物研發人工智慧市場中佔據主導地位,佔據最大的收入佔有率。此外,預計未來亞太地區市場將以更高的複合年增長率成長。
開發藥劑中AI市場上參與企業案例
- Aiforia Technologies
- Atomwise
- BioSyntagma
- Chemalive
- Collaborations Pharmaceuticals
- Cyclica
- DeepMatter
- Recursion
- InveniAI
- MAbSilico
- Optibrium
- Recursion Pharmaceuticals
- Sensyne Health
- Valo Health
本報告提供全球開發藥劑中AI市場相關調查,提供市場概要,以及藥物研發階段,各治療領域,各主要地區的趨勢,及加入此市場的主要企業簡介等資訊。
目錄
第1章 序文
第2章 摘要整理
第3章 簡介
- 章概要
- 人工智能
- AI的子集
- 資料科學
- 醫療保健的AI的應用
- 開發藥劑中AI
- 藥物研發流程的AI有效利用的優點
- AI引進伴隨的課題
- 結論
第4章 競爭情形
- 章概要
- 活用了AI的藥物研發:市場形勢
第5章 企業簡介:北美的AI為基礎的藥物研發供應商
- 章概要
- Atomwise
- BioSyntagma
- Collaborations Pharmaceuticals
- Cyclica
- InveniAI
- Recursion Pharmaceuticals
- Valo Health
第6章 企業簡介:歐洲的AI為基礎的藥物研發服務供應商
- 章概要
- iforia Technologies
- Chemalive
- DeepMatter
- Exscientia
- MAbSilico
- Optibrium
- Sensyne Health
第7章 企業簡介:亞太地區的AI為基礎的藥物研發服務供應商
- 章概要
- 3BIGS
- Gero
- Insilico Medicine
- KeenEye
第8章 夥伴關係和合作
- 章概要
- 夥伴關係模式
- 活用了AI的藥物研發:夥伴關係和合作
第9章 資金籌措與投資分析
- 章概要
- 資金籌措的種類
- 活用了AI的藥物研發:資金籌措投資
第10章 專利分析
第11章 波特的五力分析
第12章 企業評估分析
第13章 科技龍頭AI醫療保健的措施
- 章概要
- Amazon Web Services
- Microsoft
- Intel
- Alibaba Cloud
- Siemens
- IBM
第14章 降低成本分析
第15章 市場預測
第16章 結論
第17章 執行洞察
第18章 附錄I:表格形式資料
第19章 附錄II:企業及組織的一覽
AI IN DRUG DISCOVERY MARKET: OVERVIEW
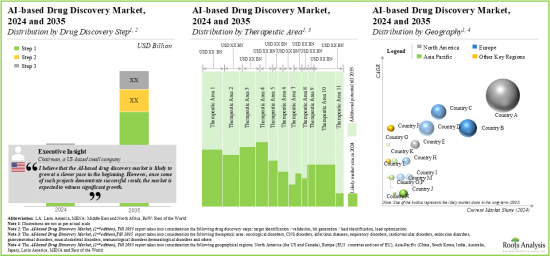
As per Roots Analysis, the global AI in drug discovery market is estimated to grow from USD 1.8 billion in the current year to USD 13.4 billion by 2035, at a CAGR of 16.5% during the forecast period, till 2035.
The market sizing and opportunity analysis has been segmented across the following parameters:
Drug Discovery Steps
- Target identification / validation
- Hit generation / lead identification
- Lead optimization
Therapeutic Area
- Oncological disorders
- CNS disorders
- Infectious diseases
- Respiratory disorders
- Cardiovascular disorders
- Endocrine disorders
- Gastrointestinal disorders
- Musculoskeletal disorders
- Immunological disorders
- Dermatological disorders
- Others
Key Geographical Regions
- North America
- Europe
- Asia-Pacific
- Latin America
- Middle East and North Africa
- Rest of the World
AI IN DRUG DISCOVERY MARKET: GROWTH AND TRENDS
Drug discovery is a complex process that involves significant utilization of time and resources. As per several sources, on average, the entire drug development process (from initial proof-of-concept to commercial launch) takes around 10-15 years and capital investments worth USD 4-10 billion to develop a drug from concept to commercial launch. The early stages, including target discovery and lead molecule identification, play an important role in the success of the drug in both preclinical and clinical studies. Despite the advances in technology and improved understanding of biological systems, the drug discovery process is still considered to be inefficient. In order to optimize the ongoing and future drug development projects, stakeholders are exploring advanced technology solutions (such as artificial intelligence in drug discovery) in order to facilitate better decision-making during the various stages of drug discovery and development.
Artificial intelligence-based tools, such as big data analytics, deep learning, and machine learning help to collect data in real-time with seamless accuracy. This capability aids in reducing clinical failures and ensuring safety during the early stages of development. Notably, over 50% of investments have been made in this domain over the last two years, reflecting a rapid inclination towards AI-based tools for drug discovery and development. In fact, several industry players, namely Pfizer, Sanofi and Genentech, are already using different AI-enabled platforms for internal drug discovery efforts. Considering the ongoing interest and rising adoption of AI in drug discovery, it is anticipated that the market will expand at a steady rate during the forecast period.
AI IN DRUG DISCOVERY MARKET: KEY INSIGHTS
The report delves into the current state of the AI in drug discovery market and identifies potential growth opportunities within the industry. Some key findings from the report include:
- Presently, around 210 players across the globe claim to use AI-based technologies across various steps of the drug discovery and development process.
- Majority of the stakeholders have the required AI-related expertise for lead identification and optimization of drug candidates targeting a range of therapeutic areas.
- Foreseeing the lucrative potential, a large number of players have made significant investments to advance the initiatives of industry stakeholders across multiple funding instances.
- A rise in partnerships focused on research and development of drugs using AI-based technologies validate the growing interest of stakeholders in this market.
- Some players have managed to establish strong competitive positions; in future, we expect multiple acquisitions to take place wherein the relative valuation of a firm is likely to be a key determinant.
- Over 260 patents related to AI-based drug discovery have recently been filed / granted, indicating the growing pace of innovation in this domain.
- The adoption of AI-enabled tools and operational approaches, across different stages of drug discovery and development, is likely to have an impact on R&D expenditure, enabling significant cost savings worldwide.
- The market is expected to grow at a CAGR of 16.5% in the coming years; the opportunity is anticipated to be well distributed across various drug discovery steps, therapeutic areas and regions.
AI IN DRUG DISCOVERY MARKET: KEY SEGMENTS
Lead Optimization Segment Occupies the Largest Share of AI in drug discovery market
Based on the drug discovery steps, the market is segmented into target identification / validation, hit generation / lead identification and lead optimization. At present, the lead optimization segment holds the maximum share of global AI in drug discovery market. Further, the lead optimization segment is likely to grow at a faster pace compared to the other segments.
By Therapeutic Area, Infectious Diseases is the Fastest Growing Segment of the Global AI in Drug Discovery Market During the Forecast Period
Based on the therapeutic area, the market is segmented into oncological disorders, CNS disorders, infectious diseases, respiratory disorders, cardiovascular disorders, endocrine disorders, gastrointestinal disorders, musculoskeletal disorders, immunological disorders, dermatological disorders, and others. Currently, the oncological disorders segment captures the highest proportion of the global AI in drug discovery market. The growth of the oncological disorders segment stems from the widespread adoption of artificial intelligence in oncology to identify targeted therapeutics and biomarkers. Further, it is worth highlighting that the AI in drug discovery market for the infectious diseases segment is likely to grow at a relatively higher CAGR.
North America Accounts for the Largest Share of the Market
Based on key geographical regions, the market is segmented into North America, Europe, and Asia-Pacific, Latin America, Middle East and North Africa and Rest of the World. Currently, North America dominates the AI in drug discovery market and accounts for the largest revenue share. Additionally, the market in Asia-Pacific is likely to grow at a higher CAGR in the future.
Example Players in the AI in Drug Discovery Market
- Aiforia Technologies
- Atomwise
- BioSyntagma
- Chemalive
- Collaborations Pharmaceuticals
- Cyclica
- DeepMatter
- Recursion
- InveniAI
- MAbSilico
- Optibrium
- Recursion Pharmaceuticals
- Sensyne Health
- Valo Health
AI IN DRUG DISCOVERY MARKET: RESEARCH COVERAGE
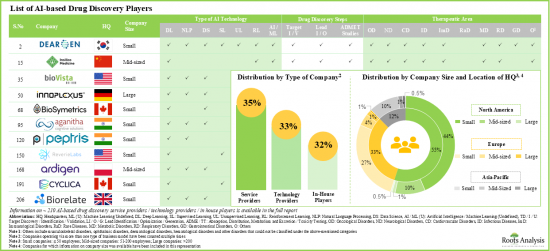
- Market Sizing and Opportunity Analysis: The report features an in-depth analysis of the global AI in drug discovery market, focusing on key market segments, including [A] drug discovery steps, [B] therapeutic area, and [C] key geographical regions.
- Market Landscape: A comprehensive evaluation of AI drug discovery companies, based on several relevant parameters, such as [A] year of establishment, [B] company size, [C] location of headquarters, [D] type of company, [E] type of AI technology, [F] type of drug molecule and [G] target therapeutic area.
- Company Profiles: In-depth profiles of key players engaged in the domain of AI in drug discovery, focusing on [A] overview of the company, [B] technology portfolio, and [C] recent developments and an informed future outlook.
- Partnerships and Collaborations: An insightful analysis of the deals inked by stakeholders in the AI in drug discovery market, based on several parameters, such as [A] year of partnership, [B] type of partnership, [C] target therapeutic area, [D] focus area, [E] type of partner company, [F] most active players (in terms of the number of partnerships signed) and [G] geographical distribution of partnership activity.
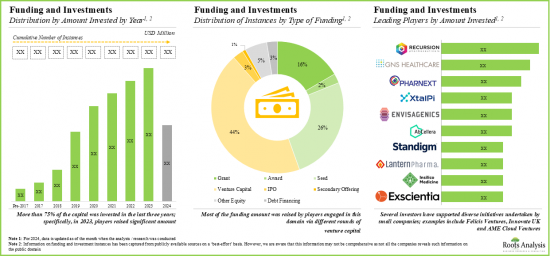
- Funding and Investments: An in-depth analysis of the fundings raised by AI in drug discovery companies, based on relevant parameters, such as [A] year of funding, [B] amount invested by year, [C] type of funding, [D] amount invested by company size, [E] type of investor, [F] amount invested by type of investor, [G] most active players, [H] most active investors and [I] geographical analysis.
- Patent Analysis: An in-depth analysis of patents filed / granted till date in the AI in drug discovery domain, based on various relevant parameters, such as [A] type of patent, [B] patent application year, [C] patent publication year, [D] geography, [E] CPC symbols, [F] emerging focus area, [G] type of applicant, [H] leading players, [I] patent age, [J] patent benchmarking, and [K] patent valuation analysis.
- PORTER'S Five Forces Analysis: A detailed analysis of the five competitive forces prevalent in AI in the drug discovery market, including [A] threats for new entrants, [B] bargaining power of drug developers, [C] bargaining power of AI-based drug discovery companies, [D] threats of substitute technologies, and [E] rivalry among existing competitors.
- Company Valuation Analysis: An in-depth analysis of the companies engaged in the AI in drug discovery market, based on [A] our proprietary, multi-variable dependent valuation model to estimate the current valuation / net worth of industry players.
- Cost Saving Analysis: An in-depth analysis of the likely cost-saving potential associated with the use of AI in the drug discovery sector, based on various parameters, such as [A] pharmaceutical R&D expenditure, [B] drug discovery expenditure / budget, and [C] adoption of AI across various drug discovery steps.
- Market Impact Analysis: A thorough analysis of various factors, such as drivers, restraints, opportunities, and existing challenges that are likely to impact market growth.
KEY QUESTIONS ANSWERED IN THIS REPORT
- How many companies are currently engaged in this market?
- Which are the leading companies in this market?
- What factors are likely to influence the evolution of this market?
- What is the current and future market size?
- What is the CAGR of this market?
- How is the current and future market opportunity likely to be distributed across key market segments?
REASONS TO BUY THIS REPORT
- The report provides a comprehensive market analysis, offering detailed revenue projections of the overall market and its specific sub-segments. This information is valuable to both established market leaders and emerging entrants.
- Stakeholders can leverage the report to gain a deeper understanding of the competitive dynamics within the market. By analyzing the competitive landscape, businesses can make informed decisions to optimize their market positioning and develop effective go-to-market strategies.
- The report offers stakeholders a comprehensive overview of the market, including key drivers, barriers, opportunities, and challenges. This information empowers stakeholders to stay abreast of market trends and make data-driven decisions to capitalize on growth prospects.
ADDITIONAL BENEFITS
- Complimentary PPT Insights Packs
- Complimentary Excel Data Packs for all Analytical Modules in the Report
- 15% Free Content Customization
- Detailed Report Walkthrough Session with Research Team
- Free Updated report if the report is 6-12 months old or older
TABLE OF CONTENTS
1. PREFACE
- 1.1. Scope of the Report
- 1.2. Research Methodology
- 1.3. Key Questions Answered
- 1.4. Chapter Outlines
2. EXECUTIVE SUMMARY
3. INTRODUCTION
- 3.1. Chapter Overview
- 3.2. Artificial Intelligence
- 3.3. Subsets of AI
- 3.3.1. Machine Learning
- 3.3.1.1. Supervised Learning
- 3.3.1.2. Unsupervised Learning
- 3.3.1.3. Reinforced / Reinforcement Learning
- 3.3.1.4. Deep Learning
- 3.3.1.5. Natural Language Processing (NLP)
- 3.3.1. Machine Learning
- 3.4. Data Science
- 3.5. Applications of AI in Healthcare
- 3.5.1. Drug Discovery
- 3.5.2. Disease Prediction, Diagnosis and Treatment
- 3.5.3. Manufacturing and Supply Chain Operations
- 3.5.4. Marketing
- 3.5.5. Clinical Trials
- 3.6. AI in Drug Discovery
- 3.6.1. Identification of Pathway and Target
- 3.6.2. Identification of Hit or Lead
- 3.6.3. Lead Optimization
- 3.6.4. Synthesis of Drug-Like Compounds
- 3.7. Advantages of Using AI in the Drug Discovery Process
- 3.8. Challenges Associated with the Adoption of AI
- 3.9. Concluding Remarks
4. COMPETITIVE LANDSCAPE
- 4.1. Chapter Overview
- 4.2. AI-based Drug Discovery: Overall Market Landscape
- 4.2.1. Analysis by Year of Establishment
- 4.2.2. Analysis by Company Size
- 4.2.3. Analysis by Location of Headquarters
- 4.2.4. Analysis by Type of Company
- 4.2.5. Analysis by Type of Technology
- 4.2.6. Analysis by Drug Discovery Steps
- 4.2.7. Analysis by Type of Drug Molecule
- 4.2.8. Analysis by Drug Development Initiatives
- 4.2.9. Analysis by Technology Licensing Option
- 4.2.10. Analysis by Target Therapeutic Area
- 4.2.11. Key Players: Analysis by Number of Platforms / Tools Available
5. COMPANY PROFILES: AI-BASED DRUG DISCOVERY PROVIDERS IN NORTH AMERICA
- 5.1. Chapter Overview
- 5.2. Atomwise
- 5.2.1. Company Overview
- 5.2.2. AI-based Drug Discovery Technology Portfolio
- 5.2.3. Recent Developments and Future Outlook
- 5.3. BioSyntagma
- 5.3.1. Company Overview
- 5.3.2. AI-based Drug Discovery Technology Portfolio
- 5.3.3. Recent Developments and Future Outlook
- 5.4. Collaborations Pharmaceuticals
- 5.4.1. Company Overview
- 5.4.2. AI-based Drug Discovery Technology Portfolio
- 5.4.3. Recent Developments and Future Outlook
- 5.5. Cyclica
- 5.5.1. Company Overview
- 5.5.2. AI-based Drug Discovery Technology Portfolio
- 5.5.3. Recent Developments and Future Outlook
- 5.6. InveniAI
- 5.6.1. Company Overview
- 5.6.2. AI-based Drug Discovery Technology Portfolio
- 5.6.3. Recent Developments and Future Outlook
- 5.7. Recursion Pharmaceuticals
- 5.7.1. Company Overview
- 5.7.2. AI-based Drug Discovery Technology Portfolio
- 5.7.3. Recent Developments and Future Outlook
- 5.8. Valo Health
- 5.8.1. Company Overview
- 5.8.2. AI-based Drug Discovery Technology Portfolio
- 5.8.3. Recent Developments and Future Outlook
6. COMPANY PROFILES: AI-BASED DRUG DISOCVERY SERVICE PROVIDERS IN EUROPE
- 6.1. Chapter Overview
- 6.2. iforia Technologies
- 6.2.1. Company Overview
- 6.2.2. AI-based Drug Discovery Technology Portfolio
- 6.2.3. Recent Developments and Future Outlook
- 6.3. Chemalive
- 6.3.1. Company Overview
- 6.3.2. AI-based Drug Discovery Technology Portfolio
- 6.3.3. Recent Developments and Future Outlook
- 6.4. DeepMatter
- 6.4.1. Company Overview
- 6.4.2. AI-based Drug Discovery Technology Portfolio
- 6.4.3. Recent Developments and Future Outlook
- 6.5. Exscientia
- 6.5.1. Company Overview
- 6.5.2. AI-based Drug Discovery Technology Portfolio
- 6.5.3. Recent Developments and Future Outlook
- 6.6. MAbSilico
- 6.6.1. Company Overview
- 6.6.2. AI-based Drug Discovery Technology Portfolio
- 6.6.3. Recent Developments and Future Outlook
- 6.7. Optibrium
- 6.7.1. Company Overview
- 6.7.2. AI-based Drug Discovery Technology Portfolio
- 6.7.3. Recent Developments and Future Outlook
- 6.8. Sensyne Health
- 6.8.1. Company Overview
- 6.8.2. AI-based Drug Discovery Technology Portfolio
- 6.8.3. Recent Developments and Future Outlook
7. COMPANY PROFILES: AI-BASED DRUG DISOCVERY SERVICE PROVIDERS IN ASIA PACIFIC
- 7.1. Chapter Overview
- 7.2. 3BIGS
- 7.2.1. Company Overview
- 7.2.2. AI-based Drug Discovery Technology Portfolio
- 7.2.3. Recent Developments and Future Outlook
- 7.3. Gero
- 7.3.1. Company Overview
- 7.3.2. AI-based Drug Discovery Technology Portfolio
- 7.3.3. Recent Developments and Future Outlook
- 7.4. Insilico Medicine
- 7.4.1. Company Overview
- 7.4.2. AI-based Drug Discovery Technology Portfolio
- 7.4.3. Recent Developments and Future Outlook
- 7.5. KeenEye
- 7.5.1. Company Overview
- 7.5.2. AI-based Drug Discovery Technology Portfolio
- 7.5.3. Recent Developments and Future Outlook
8. PARTNERSHIPS AND COLLABORATIONS
- 8.1. Chapter Overview
- 8.2. Partnership Models
- 8.3. AI-based Drug Discovery: Partnerships and Collaborations
- 8.3.1. Analysis by Year of Partnership
- 8.3.2. Analysis by Type of Partnership
- 8.3.3. Analysis by Year and Type of Partnership
- 8.3.4. Analysis by Target Therapeutic Area
- 8.3.5. Analysis by Focus Area
- 8.3.6. Analysis by Year of Partnership and Focus Area
- 8.3.7. Analysis by Type of Partner Company
- 8.3.8. Analysis by Type of Partnership and Type of Partner Company
- 8.3.9. Most Active Players: Analysis by Number of Partnerships
- 8.3.10. Analysis by Region
- 8.3.10.1. Intercontinental and Intracontinental Deals
- 8.3.10.2. International and Local Deals
9. FUNDING AND INVESTMENT ANALYSIS
- 9.1. Chapter Overview
- 9.2. Types of Funding
- 9.3. AI-based Drug Discovery: Funding and Investments
- 9.3.1. Analysis of Number of Funding Instances by Year
- 9.3.2. Analysis of Amount Invested by Year
- 9.3.3. Analysis by Type of Funding
- 9.3.4. Analysis of Amount Invested and Type of Funding
- 9.3.5. Analysis of Amount Invested by Company Size
- 9.3.6. Analysis by Type of Investor
- 9.3.7. Analysis of Amount Invested by Type of Investor
- 9.3.8. Most Active Players: Analysis by Number of Funding Instances
- 9.3.9. Most Active Players: Analysis by Amount Invested
- 9.3.10. Most Active Investors: Analysis by Number of Funding Instances
- 9.3.11. Analysis of Amount Invested by Geography
- 9.3.11.1. Analysis by Region
- 9.3.11.2. Analysis by Country
10. PATENT ANALYSIS
- 10.1. Chapter Overview
- 10.2. Scope and Methodology
- 10.3. AI-based Drug Discovery: Patent Analysis
- 10.3.1. Analysis by Application Year
- 10.3.2. Analysis by Geography
- 10.3.3. Analysis by CPC Symbols
- 10.3.4. Analysis by Emerging Focus Areas
- 10.3.5. Analysis by Type of Applicant
- 10.3.6. Leading Players: Analysis by Number of Patents
- 10.4. AI-based Drug Discovery: Patent Benchmarking
- 10.4.1. Analysis by Patent Characteristics
- 10.5. AI-based Drug Discovery: Patent Valuation
- 10.6. Leading Patents: Analysis by Number of Citations
11. PORTER'S FIVE FORCES ANALYSIS
- 11.1. Chapter Overview
- 11.2. Methodology and Assumptions
- 11.3. Key Parameters
- 11.3.1. Threats of New Entrants
- 11.3.2. Bargaining Power of Drug Developers
- 11.3.3. Bargaining Power of Companies Using AI for Drug Discovery
- 11.3.4. Threats of Substitute Technologies
- 11.3.5. Rivalry Among Existing Competitors
- 11.4. Concluding Remarks
12. COMPANY VALUATION ANALYSIS
- 12.1. Chapter Overview
- 12.2. Company Valuation Analysis: Key Parameters
- 12.3. Methodology
- 12.4. Company Valuation Analysis: Roots Analysis Proprietary Scores
13. AI-BASED HEALTHCARE INITIATIVES OF TECHNOLOGY GIANTS
- 13.1. Chapter Overview
- 13.1.1. Amazon Web Services
- 13.1.2. Microsoft
- 13.1.3. Intel
- 13.1.4. Alibaba Cloud
- 13.1.5. Siemens
- 13.1.6. Google
- 13.1.7. IBM
14. COST SAVING ANALYSIS
- 14.1. Chapter Overview
- 14.2. Key Assumptions and Methodology
- 14.3. Overall Cost Saving Potential Associated with Use of AI-based Solutions in Drug Discovery, till 2035
- 14.3.1. Likely Cost Savings: Analysis by Drug Discovery Steps, till 2035
- 14.3.1.1. Likely Cost Savings During Target Identification / Validation, till 2035
- 14.3.1.2. Likely Cost Savings During Hit Generation / Lead Identification, till 2035
- 14.3.1.3. Likely Cost Savings During Lead Optimization, till 2035
- 14.3.2. Likely Cost Savings: Analysis by Target Therapeutic Area, till 2035
- 14.3.2.1. Likely Cost Savings for Drugs Targeting Oncological Disorders, till 2035
- 14.3.2.2. Likely Cost Savings for Drugs Targeting Neurological Disorders, till 2035
- 14.3.2.3. Likely Cost Savings for Drugs Targeting Infectious Diseases, till 2035
- 14.3.2.4. Likely Cost Savings for Drugs Targeting Respiratory Disorders, till 2035
- 14.3.2.5. Likely Cost Savings for Drugs Targeting Cardiovascular Disorders, till 2035
- 14.3.2.6. Likely Cost Savings for Drugs Targeting Endocrine Disorders, till 2035
- 14.3.2.7. Likely Cost Savings for Drugs Targeting Gastrointestinal Disorders, till 2035
- 14.3.2.8. Likely Cost Savings for Drugs Targeting Musculoskeletal Disorders, till 2035
- 14.3.2.9. Likely Cost Savings for Drugs Targeting Immunological Disorders, till 2035
- 14.3.2.10. Likely Cost Savings for Drugs Targeting Dermatological Disorders, till 2035
- 14.3.2.11. Likely Cost Savings for Drugs Targeting Other Disorders, till 2035
- 14.3.3. Likely Cost Savings: Analysis by Geography, till 2035
- 14.3.3.1. Likely Cost Savings in North America, till 2035
- 14.3.3.2. Likely Cost Savings in Europe, till 2035
- 14.3.3.3. Likely Cost Savings in Asia Pacific, till 2035
- 14.3.3.4. Likely Cost Savings in MENA, till 2035
- 14.3.3.5. Likely Cost Savings in Latin America, till 2035
- 14.3.3.6. Likely Cost Savings in Rest of the World, till 2035
- 14.3.1. Likely Cost Savings: Analysis by Drug Discovery Steps, till 2035
15. MARKET FORECAST
- 15.1. Chapter Overview
- 15.2. Key Assumptions and Methodology
- 15.3. Global AI-based Drug Discovery Market, till 2035
- 15.3.1. AI-based Drug Discovery Market: Distribution by Drug Discovery Steps, till 2035
- 15.3.1.1. AI-based Drug Discovery Market for Target Identification / Validation, till 2035
- 15.3.1.2. AI-based Drug Discovery Market for Hit Generation / Lead Identification, till 2035
- 15.3.1.3. AI-based Drug Discovery Market for Lead Optimization, till 2035
- 15.3.2. AI-based Drug Discovery Market: Distribution by Target Therapeutic Area, till 2035
- 15.3.2.1. AI-based Drug Discovery Market for Oncological Disorders, till 2035
- 15.3.2.2. AI-based Drug Discovery Market for Neurological Disorders, till 2035
- 15.3.2.3. AI-based Drug Discovery Market for Infectious Diseases, till 2035
- 15.3.2.4. AI-based Drug Discovery Market for Respiratory Disorders, till 2035
- 15.3.2.5. AI-based Drug Discovery Market for Cardiovascular Disorders, till 2035
- 15.3.2.6. AI-based Drug Discovery Market for Endocrine Disorders, till 2035
- 15.3.2.7. AI-based Drug Discovery Market for Gastrointestinal Disorders, till 2035
- 15.3.2.8. AI-based Drug Discovery Market for Musculoskeletal Disorders, till 2035
- 15.3.2.9. AI-based Drug Discovery Market for Immunological Disorders, till 2035
- 15.3.2.10. AI-based Drug Discovery Market for Dermatological Disorders, till 2035
- 15.3.2.11. AI-based Drug Discovery Market for Other Disorders, till 2035
- 15.3.3. AI-based Drug Discovery Market: Distribution by Geography, till 2035
- 15.3.3.1. AI-based Drug Discovery Market in North America, till 2035
- 15.3.3.1.1. AI-based Drug Discovery Market in the US, till 2035
- 15.3.3.1.2. AI-based Drug Discovery Market in Canada, till 2035
- 15.3.3.2. AI-based Drug Discovery Market in Europe, till 2035
- 15.3.3.2.1. AI-based Drug Discovery Market in the UK, till 2035
- 15.3.3.2.2. AI-based Drug Discovery Market in France, till 2035
- 15.3.3.2.3. AI-based Drug Discovery Market in Germany, till 2035
- 15.3.3.2.4. AI-based Drug Discovery Market in Spain, till 2035
- 15.3.3.2.5. AI-based Drug Discovery Market in Italy, till 2035
- 15.3.3.2.6. AI-based Drug Discovery Market in Rest of Europe, till 2035
- 15.3.3.3. AI-based Drug Discovery Market in Asia Pacific, 2020-2035
- 15.3.3.3.1. AI-based Drug Discovery Market in China, till 2035
- 15.3.3.3.2. AI-based Drug Discovery Market in India, till 2035
- 15.3.3.3.3. AI-based Drug Discovery Market in Japan, till 2035
- 15.3.3.3.4. AI-based Drug Discovery Market in Australia, till 2035
- 15.3.3.3.5. AI-based Drug Discovery Market in South Korea, till 2035
- 15.3.3.4. AI-based Drug Discovery Market in MENA, till 2035
- 15.3.3.4.1. AI-based Drug Discovery Market in Saudi Arabia, till 2035
- 15.3.3.4.2. AI-based Drug Discovery Market in UAE, till 2035
- 15.3.3.4.3. AI-based Drug Discovery Market in Iran, till 2035
- 15.3.3.5. AI-based Drug Discovery Market in Latin America, till 2035
- 15.3.3.5.1. AI-based Drug Discovery Market in Argentina, till 2035
- 15.3.3.6. AI-based Drug Discovery Market in Rest of the World, till 2035
- 15.3.3.1. AI-based Drug Discovery Market in North America, till 2035
- 15.3.1. AI-based Drug Discovery Market: Distribution by Drug Discovery Steps, till 2035
16. CONCLUSION
17. EXECUTIVE INSIGHTS
- 17.1. Chapter Overview
- 17.2. Aigenpulse
- 17.2.1. Company Snapshot
- 17.2.2. Interview Transcript: Steve Yemm (Chief Commercial Officer) and Satnam Surae (Chief Product Officer)
- 17.3. Cloud Pharmaceuticals
- 17.3.1. Company Snapshot
- 17.3.2. Interview Transcript: Ed Addison (Co-founder, Chairman and Chief Executive Officer)
- 17.4. DEARGEN
- 17.4.1. Company Snapshot
- 17.4.2. Interview Transcript: Bo Ram Beck (Head Researcher)
- 17.5. Intelligent Omics
- 17.5.1. Company Snapshot
- 17.5.2. Interview Transcript: Simon Haworth (Chief Executive Officer)
- 17.6. Pepticom
- 17.6.1. Company Snapshot
- 17.6.2. Interview Transcript: Immanuel Lerner (Chief Executive Officer, Co-Founder)
- 17.7. Sage-N Research
- 17.7.1. Company Snapshot
- 17.7.2. Interview Transcript: David Chiang (Chairman)
18. APPENDIX I: TABULATED DATA
19. APPENDIX II: LIST OF COMPANIES AND ORGANIZATIONS
List of Tables
- Table 4.1 AI-based Drug Discovery Services / Technology Providers: Information on Year of Establishment, Company Size, Location of Headquarters, Number and Name of Platforms / Tools Available
- Table 4.2 AI-based Drug Discovery Services / Technology Providers: Information on Type of AI Technology and Drug Discovery Steps
- Table 4.3 AI-based Drug Discovery Services / Technology Providers: Information on Type of Drug Molecule and Target Therapeutic Area
- Table 5.1 Leading AI-based Drug Discovery Services / Technology Providers in North America
- Table 5.2 Atomwise: Company Snapshot
- Table 5.3 Atomwise: AI-based Drug Discovery Technologies
- Table 5.4 Atomwise: Recent Developments and Future Outlook
- Table 5.5 BioSyntagma: Company Snapshot
- Table 5.6 BioSyntagma: AI-based Drug Discovery Technologies
- Table 5.7 BioSyntagma: Recent Developments and Future Outlook
- Table 5.8 Collaborations Pharmaceuticals: Company Snapshot
- Table 5.9 Collaborations Pharmaceuticals: AI-based Drug Discovery Technologies
- Table 5.10 Collaborations Pharmaceuticals: Recent Developments and Future Outlook
- Table 5.11 Cyclica: Company Snapshot
- Table 5.12 Cyclica: AI-based Drug Discovery Technologies
- Table 5.13 Cyclica: Recent Developments and Future Outlook
- Table 5.14 InveniAI: Company Snapshot
- Table 5.15 InveniAI: AI-based Drug Discovery Technologies
- Table 5.16 InveniAI: Recent Developments and Future Outlook
- Table 5.17 Recursion Pharmaceuticals: Company Snapshot
- Table 5.18 Recursion Pharmaceuticals: AI-based Drug Discovery Technologies
- Table 5.19 Recursion Pharmaceuticals: Recent Developments and Future Outlook
- Table 5.20 Valo Health: Company Snapshot
- Table 5.21 Valo Health: AI-based Drug Discovery Technologies
- Table 5.22 Valo Health: Recent Developments and Future Outlook
- Table 6.1 Leading AI-based Drug Discovery Service / Technology Providers in Europe
- Table 6.2 Aiforia Technologies: Company Snapshot
- Table 6.3 Aiforia Technologies: AI-based Drug Discovery Technologies
- Table 6.4 Aiforia Technologies: Recent Developments and Future Outlook
- Table 6.5 Chemalive: Company Snapshot
- Table 6.6 Chemalive: AI-based Drug Discovery Technologies
- Table 6.7 Chemalive: Recent Developments and Future Outlook
- Table 6.8 DeepMatter: Company Snapshot
- Table 6.9 DeepMatter: AI-based Drug Discovery Technologies
- Table 6.10 DeepMatter: Recent Developments and Future Outlook
- Table 6.11 Exscientia: Company Snapshot
- Table 6.12 Exscientia: AI-based Drug Discovery Technologies
- Table 6.13 Exscientia: Recent Developments and Future Outlook
- Table 6.14 MAbSilico: Company Snapshot
- Table 6.15 MAbSilico: AI-based Drug Discovery Technologies
- Table 6.16 MAbSilico: Recent Developments and Future Outlook
- Table 6.17 Optibrium: Company Snapshot
- Table 6.18 Optibrium: AI-based Drug Discovery Technologies
- Table 6.19 Optibrium: Recent Developments and Future Outlook
- Table 6.20 Sensyne Health: Company Snapshot
- Table 6.21 Sensyne Health: AI-based Drug Discovery Technologies
- Table 6.22 Sensyne Health: Recent Developments and Future Outlook
- Table 7.1 Leading AI-based Drug Discovery Service / Technology Providers in Asia Pacific
- Table 7.2 3BIGS: Company Snapshot
- Table 7.3 3BIGS: AI-based Drug Discovery Technologies
- Table 7.4 3BIGS: Recent Developments and Future Outlook
- Table 7.5 Gero: Company Snapshot
- Table 7.6 Gero: AI-based Drug Discovery Technologies
- Table 7.7 Gero: Recent Developments and Future Outlook
- Table 7.8 Insilico Medicine: Company Snapshot
- Table 7.9 Insilico Medicine: AI-based Drug Discovery Technologies
- Table 7.10 Insilico Medicine: Recent Developments and Future Outlook
- Table 7.11 KeenEye: Company Snapshot
- Table 7.12 KeenEye: AI-based Drug Discovery Technologies
- Table 7.13 KeenEye: Recent Developments and Future Outlook
- Table 8.1 AI-based Drug Discovery: List of Partnerships and Collaborations, Since 2009
- Table 9.1 AI-based Drug Discovery: List of Funding and Investments, Since 2006
- Table 10.1 Patent Analysis: Prominent CPC Symbols
- Table 10.2 Patent Analysis: Most Popular CPC Symbols
- Table 10.3 Patent Analysis: List of Top CPC Symbols
- Table 10.4 Patent Analysis: Summary of Benchmarking Analysis
- Table 10.5 Patent Analysis: Categorization based on Weighted Valuation Scores
- Table 10.6 Patent Portfolio: List of Leading Patents (in terms of Highest Relative Valuation)
- Table 10.7 Patent Portfolio: List of Leading Patents (in terms of Number of Citations)
- Table 12.1. Company Valuation Analysis: Scoring Sheet
- Table 12.2. Company Valuation Analysis: Estimated Valuation
- Table 17.1 Aigenpulse: Company Snapshot
- Table 17.2 Cloud Pharmaceuticals: Company Snapshot
- Table 17.3 DEARGEN: Company Snapshot
- Table 17.4 Intelligent Omics: Company Snapshot
- Table 17.5 Pepticom: Company Snapshot
- Table 17.6 Sage-N Research: Company Snapshot
- Table 18.1 AI-based Drug Discovery: Distribution by Year of Establishment
- Table 18.2 AI-based Drug Discovery: Distribution by Company Size
- Table 18.3 AI-based Drug Discovery: Distribution by Location of Headquarters (Region-Wise)
- Table 18.4 AI-based Drug Discovery: Distribution by Location of Headquarters (Country-Wise)
- Table 18.5 AI-based Drug Discovery: Distribution by Company Size and Location of Headquarters
- Table 18.6 AI-based Drug Discovery: Distribution by Type of Company
- Table 18.7 AI-based Drug Discovery: Distribution by Type of AI Technology
- Table 18.8 AI-based Drug Discovery: Distribution by Drug Discovery Steps
- Table 18.9 AI-based Drug Discovery: Distribution by Type of Drug Molecule
- Table 18.10. AI-based Drug Discovery: Distribution by Drug Development Initiatives
- Table 18.11 AI-based Drug Discovery: Distribution by Technology Licensing Option
- Table 18.12 AI-based Drug Discovery: Distribution by Target Therapeutic Area
- Table 18.13 Most Active Players: Distribution by Number of Platforms / Tools Offered
- Table 18.14 Partnerships and Collaborations: Cumulative Year-wise Trend
- Table 18.15 Partnerships and Collaborations: Distribution by Type of Partnership
- Table 18.16 Partnerships and Collaborations: Distribution by Year and Type of Partnership
- Table 18.17 Partnerships and Collaborations: Distribution by Target Therapeutic Area
- Table 18.18 Partnerships and Collaborations: Distribution by Focus Area
- Table 18.19 Partnerships and Collaborations: Distribution by Year of Partnership and Focus Area
- Table 18.20 Partnerships and Collaborations: Distribution by Type of Partner Company
- Table 18.21 Partnerships and Collaborations: Distribution by Type of Partner Company and Type of Agreement
- Table 18.22 Most Active Players: Distribution by Number of Partnerships
- Table 18.23 Partnerships and Collaborations: Distribution of Intercontinental and Intracontinental Deals
- Table 18.24 Partnerships and Collaborations: Distribution of International and Local Deals
- Table 18.25 Funding and Investment Analysis: Cumulative Year-wise Distribution of Funding Instances, Since Pre-2015
- Table 18.26 Funding and Investment Analysis: Cumulative Year-wise Distribution of Amount Invested Since Pre-2015, (USD Million),
- Table 18.27 Funding and Investment Analysis: Distribution of Instances by Type of Funding
- Table 18.28 Funding and Investment Analysis: Distribution of Amount Invested by Type of Funding (USD Million)
- Table 18.29 Funding and Investment Analysis: Distribution of Amount Invested by Year and Type of Funding (USD Million)
- Table 18.30 Funding and Investment Analysis: Distribution of Amount Invested by Company Size (USD Million)
- Table 18.31 Funding and Investment Analysis: Distribution of Funding Instances by Type of Investor
- Table 18.32 Funding and Investment Analysis: Distribution of Amount Invested by Type of Investor (USD Million)
- Table 18.33 Most Active Players: Distribution by Number of Funding Instances
- Table 18.34 Most Active Players: Distribution by Amount Raised
- Table 18.35 Most Active Investors: Distribution by Number of Funding Instances
- Table 18.36 Funding and Investment: Distribution of Amount Invested by Region (USD Million)
- Table 18.37 Funding and Investment: Distribution of Amount Invested by Geography (Country-wise) (USD Million)
- Table 18.38 Patent Analysis: Distribution by Type of Patent
- Table 18.39 Patent Analysis: Distribution by Application Year
- Table 18.40 Patent Analysis: Distribution by Location of Patent Jurisdiction (Region-wise)
- Table 18.41 Patent Analysis: Distribution by Location of Patent Jurisdiction (Country-wise)
- Table 18.42 Patent Analysis: Cumulative Year-wise Distribution by Type of Applicant
- Table 18.43 Leading Industry Players: Distribution by Number of Patents
- Table 18.44 Leading Non-Industry Players: Distribution by Number of Patents
- Table 18.45 Leading Patent Assignees: Distribution by Number of Patents
- Table 18.46 Patent Analysis: Distribution by Age
- Table 18.47 Patent Analysis: Patent Valuation
- Table 18.48 Overall Cost Saving Potential Associated with Use of AI-based Solutions in Drug Discovery, Till 2035 (USD Billion)
- Table 18.49 Likely Cost Savings: Distribution by Drug Discovery Steps, Till 2035 (USD Billion)
- Table 18.50 Likely Cost Savings During Target Identification / Validation, Till 2035 (USD Billion)
- Table 18.51 Likely Cost Savings During Hit Generation / Lead Identification, Till 2035 (USD Billion)
- Table 18.52 Likely Cost Savings During Lead Optimization, Till 2035 (USD Billion)
- Table 18.53 Likely Cost Savings: Distribution by Target Therapeutic Area, Till 2035 (USD Billion)
- Table 18.54 Likely Cost Savings for Drugs Targeting Oncological Disorders, Till 2035 (USD Billion)
- Table 18.55 Likely Cost Savings for Drugs Targeting Neurological Disorders, Till 2035 (USD Billion)
- Table 18.56 Likely Cost Savings for Drugs Targeting Infectious Diseases, Till 2035 (USD Billion)
- Table 18.57 Likely Cost Savings for Drugs Targeting Respiratory Disorders, Till 2035 (USD Billion)
- Table 18.58 Likely Cost Savings for Drugs Targeting Cardiovascular Disorders, Till 2035 (USD Billion)
- Table 18.59 Likely Cost Savings for Drugs Targeting Endocrine Disorders, Till 2035 (USD Billion)
- Table 18.60 Likely Cost Savings for Drugs Targeting Gastrointestinal Disorders, Till 2035 (USD Billion)
- Table 18.61 Likely Cost Savings for Drugs Targeting Musculoskeletal Disorders, Till 2035 (USD Billion)
- Table 18.62 Likely Cost Savings for Drugs Targeting Immunological Disorders, Till 2035 (USD Billion)
- Table 18.63 Likely Cost Savings for Drugs Targeting Dermatological Disorders, Till 2035 (USD Billion)
- Table 18.64 Likely Cost Savings for Drugs Targeting Other Disorders, Till 2035 (USD Billion)
- Table 18.65 Likely Cost Savings: Distribution by Geography (USD Billion)
- Table 18.66 Likely Cost Savings in North America, Till 2035 (USD Billion)
- Table 18.67 Likely Cost Savings in Europe, Till 2035 (USD Billion)
- Table 18.68 Likely Cost Savings in Asia Pacific, Till 2035 (USD Billion)
- Table 18.69 Likely Cost Savings in MENA, Till 2035 (USD Billion)
- Table 18.70 Likely Cost Savings in Latin America, Till 2035 (USD Billion)
- Table 18.71 Likely Cost Savings in Rest of the World, Till 2035 (USD Billion)
- Table 18.72 Global AI-based Drug Discovery Market, Conservative, Base and Optimistic Scenarios, Till 2035 (USD Billion)
- Table 18.73 AI-based Drug Discovery Market: Distribution by Drug Discovery Steps (USD Billion)
- Table 18.74 AI-based Drug Discovery Market for Target Identification / Validation, Conservative, Base and Optimistic Scenarios, Till 2035 (USD Billion)
- Table 18.75 AI-based Drug Discovery Market for Hit Generation / Lead Identification, Conservative, Base and Optimistic Scenarios, Till 2035 (USD Billion)
- Table 18.76 AI-based Drug Discovery Market for Lead Optimization, Conservative, Base and Optimistic Scenarios, Till 2035 (USD Billion)
- Table 18.77 AI-based Drug Discovery Market: Distribution by Target Therapeutic Area (USD Billion)
- Table 18.78 AI-based Drug Discovery Market for Oncological Disorders, Conservative, Base and Optimistic Scenarios, Till 2035 (USD Billion)
- Table 18.79 AI-based Drug Discovery Market for Neurological Disorders Conservative, Base and Optimistic Scenarios, Till 2035 (USD Billion)
- Table 18.80 AI-based Drug Discovery Market for Infectious Diseases, Conservative, Base and Optimistic Scenarios, Till 2035 (USD Billion)
- Table 18.81 AI-based Drug Discovery Market for Respiratory Disorders, Conservative, Base and Optimistic Scenarios, Till 2035 (USD Billion)
- Table 18.82 AI-based Drug Discovery Market for Cardiovascular Disorders, Conservative, Base and Optimistic Scenarios, Till 2035 (USD Billion)
- Table 18.83 AI-based Drug Discovery Market for Endocrine Disorders, Conservative, Base and Optimistic Scenarios, Till 2035 (USD Billion)
- Table 18.84 AI-based Drug Discovery Market for Gastrointestinal Disorders, Conservative, Base and Optimistic Scenarios, Till 2035 (USD Billion)
- Table 18.85 AI-based Drug Discovery Market for Musculoskeletal Disorders, Conservative, Base and Optimistic Scenarios, Till 2035 (USD Billion)
- Table 18.86 AI-based Drug Discovery Market for Immunological Disorders, Conservative, Base and Optimistic Scenarios, Till 2035 (USD Billion)
- Table 18.87 AI-based Drug Discovery Market for Dermatological Disorders, Conservative, Base and Optimistic Scenarios, Till 2035 (USD Billion)
- Table 18.88 AI-based Drug Discovery Market for Other Disorders, Conservative, Base and Optimistic Scenarios, Till 2035 (USD Billion)
- Table 18.89 AI-based Drug Discovery Market: Distribution by Geography, Till 2035 (USD Billion)
- Table 18.90 AI-based Drug Discovery Market in North America, Conservative, Base and Optimistic Scenarios, Till 2035 (USD Billion)
- Table 18.91 AI-based Drug Discovery Market in the US, Conservative, Base and Optimistic Scenarios, Till 2035 (USD Billion)
- Table 18.92 AI-based Drug Discovery Market in Canada, Conservative, Base and Optimistic Scenarios, Till 2035 (USD Billion)
- Table 18.93 AI-based Drug Discovery Market in Europe, Conservative, Base and Optimistic Scenarios, Till 2035 (USD Billion)
- Table 18.94 AI-based Drug Discovery Market in UK, Conservative, Base and Optimistic Scenarios, Till 2035 (USD Billion)
- Table 18.95 AI-based Drug Discovery Market in France, Conservative, Base and Optimistic Scenarios, Till 2035 (USD Billion)
- Table 18.96 AI-based Drug Discovery Market in Germany, Conservative, Base and Optimistic Scenarios, Till 2035 (USD Billion)
- Table 18.97 AI-based Drug Discovery Market in Spain, Conservative, Base and Optimistic Scenarios, Till 2035 (USD Billion)
- Table 18.98 AI-based Drug Discovery Market in Italy, Conservative, Base and Optimistic Scenarios, Till 2035 (USD Billion)
- Table 18.99 AI-based Drug Discovery Market in Rest of Europe, Conservative, Base and Optimistic Scenarios, Till 2035 (USD Billion)
- Table 18.100 AI-based Drug Discovery Market in Asia Pacific, Conservative, Base and Optimistic Scenarios, Till 2035 (USD Billion)
- Table 18.101 AI-based Drug Discovery Market in China, Conservative, Base and Optimistic Scenarios, Till 2035 (USD Billion)
- Table 18.102 AI-based Drug Discovery Market in India, Conservative, Base and Optimistic Scenarios, Till 2035 (USD Billion)
- Table 18.103 AI-based Drug Discovery Market in Japan, Conservative, Base and Optimistic Scenarios, Till 2035 (USD Billion)
- Table 18.104 AI-based Drug Discovery Market in Australia, Conservative, Base and Optimistic Scenarios, Till 2035 (USD Billion)
- Table 18.105 AI-based Drug Discovery Market in South Korea, Conservative, Base and Optimistic Scenarios, Till 2035 (USD Billion)
- Table 18.106 AI-based Drug Discovery Market in MENA, Conservative, Base and Optimistic Scenarios, Till 2035 (USD Billion)
- Table 18.107 AI-based Drug Discovery Market in Saudi Arabia, Conservative, Base and Optimistic Scenarios, Till 2035 (USD Billion)
- Table 18.108 AI-based Drug Discovery Market in UAE, Conservative, Base and Optimistic Scenarios, Till 2035 (USD Billion)
- Table 18.109 AI-based Drug Discovery Market in Iran, Conservative, Base and Optimistic Scenarios, Till 2035 (USD Billion)
- Table 18.110 AI-based Drug Discovery Market in Latin America, Conservative, Base and Optimistic Scenarios, Till 2035 (USD Billion)
- Table 18.111 AI-based Drug Discovery Market in Argentina, Conservative, Base and Optimistic Scenarios, Till 2035 (USD Billion)
- Table 18.112 AI-based Drug Discovery Market in Rest of the World, Conservative, Base and Optimistic Scenarios, Till 2035 (USD Billion)
List of Figures
- Figure 2.1 Executive Summary: Overall Market Landscape
- Figure 2.2 Executive Summary: Partnerships and Collaborations
- Figure 2.3 Executive Summary: Funding and Investment Analysis
- Figure 2.4 Executive Summary: Patent Analysis
- Figure 2.5 Executive Summary: Cost Saving Analysis
- Figure 2.6 Executive Summary: Market Forecast
- Figure 3.1 Evolution of AI
- Figure 3.2. Key Segments of AI
- Figure 3.3. Interconnection between Data Science, Artificial Intelligence and Big Data
- Figure 3.4. Applications of AI
- Figure 4.1. AI-based Drug Discovery: Distribution by Year of Establishment
- Figure 4.2. AI-based Drug Discovery: Distribution by Company Size
- Figure 4.3. AI-based Drug Discovery: Distribution by Location of Headquarters (Region-Wise)
- Figure 4.4. AI-based Drug Discovery: Distribution by Location of Headquarters (Country-Wise)
- Figure 4.5. AI-based Drug Discovery: Distribution by Company Size and Location of Headquarters
- Figure 4.6. AI-based Drug Discovery: Distribution by Type of Company
- Figure 4.7. AI-based Drug Discovery: Distribution by Type of AI Technology
- Figure 4.8. AI-based Drug Discovery: Distribution by Drug Discovery Steps
- Figure 4.9. AI-based Drug Discovery: Distribution by Type of Molecule
- Figure 4.10. AI-based Drug Discovery: Distribution by Drug Development Initiatives
- Figure 4.11. AI-based Drug Discovery: Distribution by Technology Licensing Option
- Figure 4.12. AI-based Drug Discovery: Distribution by Target Therapeutic Area
- Figure 4.13. Key Players: Distribution by Number of Platforms / Tools Available
- Figure 8.1 Partnerships and Collaborations: Cumulative Year-Wise Trend
- Figure 8.2 Partnerships and Collaborations: Distribution by Type of Partnership
- Figure 8.3 Partnerships and Collaborations: Distribution by Year and Type of Partnership
- Figure 8.4 Partnerships and Collaborations: Distribution by Target Therapeutic Area
- Figure 8.5 Partnerships and Collaborations: Distribution by Focus Area
- Figure 8.6 Partnerships and Collaborations: Distribution by Year of Partnership and Focus Area
- Figure 8.7 Partnerships and Collaborations: Distribution by Type of Partner Company
- Figure 8.8 Partnerships and Collaborations: Distribution by Type of Partner Company and Type of Partnerships
- Figure 8.9 Most Active Players: Distribution by Number of Partnerships
- Figure 8.10 Partnerships and Collaborations: Distribution of Intercontinental and Intracontinental Deals
- Figure 8.11 Partnerships and Collaborations: Distribution of International and Local Deals
- Figure 9.1 Funding and Investment Analysis: Cumulative Year-wise Trend Distribution of Funding Instances, Since 2006
- Figure 9.2 Funding and Investment Analysis: Cumulative Distribution of Amount Invested (USD Million), Since 2006
- Figure 9.3 Funding and Investment Analysis: Distribution of Instances by Type of Funding
- Figure 9.4 Funding and Investment Analysis: Distribution of Amount Invested by Type of Funding (USD Million)
- Figure 9.5 Funding and Investment Analysis: Distribution of Amount Invested by Company Size (USD Million)
- Figure 9.6 Funding and Investment Analysis: Distribution of Number of Funding Instances by Type of Investor
- Figure 9.7 Funding and Investment Analysis: Distribution of Amount Invested by Type of Investor (USD Million)
- Figure 9.8 Most Active Players: Distribution by Number of Funding Instances
- Figure 9.9 Most Active Players: Distribution by Amount Invested
- Figure 9.10 Most Active Investors: Distribution by Number of Funding Instances
- Figure 9.11 Funding and Investment: Distribution of Amount Invested by Region (USD Million)
- Figure 9.12 Funding and Investment: Distribution of Amount Invested by Country (USD Million)
- Figure 10.1 Patent Analysis: Distribution by Type of Patent
- Figure 10.2 Patent Analysis: Distribution by Application Year
- Figure 10.3 Patent Analysis: Distribution by Location of Patent Jurisdiction (Region-wise)
- Figure 10.4 Patent Analysis: Distribution by Location of Patent Jurisdiction (Country-wise)
- Figure 10.5 Patent Analysis: Distribution by CPC Symbols
- Figure 10.6 Patent Analysis: Emerging Focus Area
- Figure 10.7 Patent Analysis: Cumulative Year-wise Distribution by Type of Applicant
- Figure 10.8 Leading Industry Players: Distribution by Number of Patents
- Figure 10.9 Leading Non-Industry Players: Distribution by Number of Patents
- Figure 10.10 Leading Patent Assignees: Distribution by Number of Patents
- Figure 10.11 Patent Benchmarking: Distribution of Leading Industry Players by Patent Characteristics (CPC Symbols)
- Figure 10.12 Patent Analysis: Distribution by Age
- Figure 10.13 Patent Analysis: Patent Valuation
- Figure 11.1 Porters Five Forces: Key Parameters
- Figure 11.2 Porters Five Forces: Harvey Ball Analysis
- Figure 14.1 Overall Cost Saving Potential Associated with Use of AI-based Solutions in Drug Discovery, Till 2035 (USD Billion)
- Figure 14.2 Likely Cost Savings: Distribution by Drug Discovery Steps (USD Billion)
- Figure 14.3 Likely Cost Savings During Target Identification / Validation, Till 2035 (USD Billion)
- Figure 14.4 Likely Cost Savings During Hit Generation / Lead Identification, Till 2035 (USD Billion)
- Figure 14.5 Likely Cost Savings During Lead Optimization, Till 2035 (USD Billion)
- Figure 14.6 Likely Cost Savings: Distribution by Target Therapeutic Area (USD Billion)
- Figure 14.7 Likely Cost Savings for Drugs Targeting Oncological Disorders, Till 2035 (USD Billion)
- Figure 14.8 Likely Cost Savings for Drugs Targeting Neurological Disorders, Till 2035 (USD Billion)
- Figure 14.9 Likely Cost Savings for Drugs Targeting Infectious Diseases, Till 2035 (USD Billion)
- Figure 14.10 Likely Cost Savings for Drugs Targeting Respiratory Disorders, Till 2035 (USD Billion)
- Figure 14.11 Likely Cost Savings for Drugs Targeting Cardiovascular Disorders, Till 2035 (USD Billion)
- Figure 14.12 Likely Cost Savings for Drugs Targeting Endocrine Disorders, Till 2035 (USD Billion)
- Figure 14.13 Likely Cost Savings for Drugs Targeting Gastrointestinal Disorders, Till 2035 (USD Billion)
- Figure 14.14 Likely Cost Savings for Drugs Targeting Musculoskeletal Disorders, Till 2035 (USD Billion)
- Figure 14.15 Likely Cost Savings for Drugs Targeting Immunological Disorders, Till 2035 (USD Billion)
- Figure 14.16 Likely Cost Savings for Drugs Targeting Dermatological Disorders, Till 2035 (USD Billion)
- Figure 14.17 Likely Cost Savings for Drugs Targeting Other Disorders, Till 2035 (USD Billion)
- Figure 14.18 Likely Cost Savings: Distribution by Geography (USD Billion)
- Figure 14.19 Likely Cost Savings in North America, Till 2035 (USD Billion)
- Figure 14.20 Likely Cost Savings in Europe, Till 2035 (USD Billion)
- Figure 14.21 Likely Cost Savings in Asia Pacific, Till 2035 (USD Billion)
- Figure 14.22 Likely Cost Savings in MENA, Till 2035 (USD Billion)
- Figure 14.23 Likely Cost Savings in Latin America, Till 2035 (USD Billion)
- Figure 14.24 Likely Cost Savings in Rest of the World, Till 2035 (USD Billion)
- Figure 15.1 Global AI-based Drug Discovery Market, Till 2035 (USD Billion)
- Figure 15.2 AI-based Drug Discovery Market: Distribution by Drug Discovery Steps (USD Billion)
- Figure 15.3 AI-based Drug Discovery Market for Target Identification / Validation, Till 2035 (USD Billion)
- Figure 15.4 AI-based Drug Discovery Market for Hit Generation / Lead Identification, Till 2035 (USD Billion)
- Figure 15.5 AI-based Drug Discovery Market for Lead Optimization, Till 2035 (USD Billion)
- Figure 15.6 AI-based Drug Discovery Market: Distribution by Target Therapeutic Area (USD Billion)
- Figure 15.7 AI-based Drug Discovery Market for Oncological Disorders, Till 2035 (USD Billion)
- Figure 15.8 AI-based Drug Discovery Market for Neurological Disorders Till 2035 (USD Billion)
- Figure 15.9 AI-based Drug Discovery Market for Infectious Diseases, Till 2035 (USD Billion)
- Figure 15.10 AI-based Drug Discovery Market for Respiratory Disorders, Till 2035 (USD Billion)
- Figure 15.11 AI-based Drug Discovery Market for Cardiovascular Disorders, Till 2035 (USD Billion)
- Figure 15.12 AI-based Drug Discovery Market for Endocrine Disorders, Till 2035 (USD Billion)
- Figure 15.13 AI-based Drug Discovery Market for Gastrointestinal Disorders, Till 2035 (USD Billion)
- Figure 15.14 AI-based Drug Discovery Market for Musculoskeletal Disorders, Till 2035 (USD Billion)
- Figure 15.15 AI-based Drug Discovery Market for Immunological Disorders, Till 2035 (USD Billion)
- Figure 15.16 AI-based Drug Discovery Market for Dermatological Disorders, Till 2035 (USD Billion)
- Figure 15.17 AI-based Drug Discovery Market for Other Disorders, Till 2035 (USD Billion)
- Figure 15.18 AI-based Drug Discovery Market: Distribution by Geography, Till 2035 (USD Billion)
- Figure 15.19 AI-based Drug Discovery Market in North America, Till 2035 (USD Billion)
- Figure 15.20 AI-based Drug Discovery Market in the US, Till 2035 (USD Billion)
- Figure 15.21 AI-based Drug Discovery Market in Canada, Till 2035 (USD Billion)
- Figure 15.22 AI-based Drug Discovery Market in Europe, Till 2035 (USD Billion)
- Figure 15.23 AI-based Drug Discovery Market in UK, Till 2035 (USD Billion)
- Figure 15.24 AI-based Drug Discovery Market in France, Till 2035 (USD Billion)
- Figure 15.25 AI-based Drug Discovery Market in Germany, Till 2035 (USD Billion)
- Figure 15.26 AI-based Drug Discovery Market in Spain, Till 2035 (USD Billion)
- Figure 15.27 AI-based Drug Discovery Market in Italy, Till 2035 (USD Billion)
- Figure 15.28 AI-based Drug Discovery Market in Rest of Europe (USD Billion)
- Figure 15.29 AI-based Drug Discovery Market in Asia Pacific, Till 2035 (USD Billion)
- Figure 15.30 AI-based Drug Discovery Market in China, Till 2035 (USD Billion)
- Figure 15.31 AI-based Drug Discovery Market in India, Till 2035 (USD Billion)
- Figure 15.32 AI-based Drug Discovery Market in Japan, Till 2035 (USD Billion)
- Figure 15.33 AI-based Drug Discovery Market in Australia, Till 2035 (USD Billion)
- Figure 15.34 AI-based Drug Discovery Market in South Korea, Till 2035 (USD Billion)
- Figure 15.35 AI-based Drug Discovery Market in MENA, Till 2035 (USD Billion)
- Figure 15.36 AI-based Drug Discovery Market in Saudi Arabia, Till 2035 (USD Billion)
- Figure 15.37 AI-based Drug Discovery Market in UAE, Till 2035 (USD Billion)
- Figure 15.38 AI-based Drug Discovery Market in Iran, Till 2035 (USD Billion)
- Figure 15.39 AI-based Drug Discovery Market in Latin America, Till 2035 (USD Billion)
- Figure 15.40 AI-based Drug Discovery Market in Argentina, Till 2035 (USD Billion)
- Figure 15.41 AI-based Drug Discovery Market in Rest of the World, Till 2035 (USD Billion)
- Figure 16.1 Concluding Remarks: Current Market Landscape
- Figure 16.2 Concluding Remarks: Partnerships and Collaborations
- Figure 16.3 Concluding Remarks: Funding and Investments
- Figure 16.4 Concluding Remarks: Patent Analysis
- Figure 16.5 Concluding Remarks: Company Valuation Analysis
- Figure 16.6 Concluding Remarks: Cost Saving Analysis
- Figure 16.7 Concluding Remarks: Market Forecast
 人工智慧在藥物研發中的應用:全球市場佔有率和排名、總收入和需求預測(2025-2031年)
 人工智慧在藥物發現領域的市場機會、成長促進因素、產業趨勢分析及預測(2025-2034年)
 2032 年人工智慧藥物研發平台市場預測:按組件、治療領域、藥物類型、部署模式、最終用戶和地區進行的全球分析
 人工智慧在藥物研發市場的應用、技術、治療領域、最終用戶和部署模式—2025-2032年全球預測2032 年人工智慧老年保護劑市場預測:按治療領域、技術、應用、最終用戶和地區分類的全球分析2032 年藥物研發市場 AI 預測:按類型、藥物類型、產品、技術、應用、最終用戶和地區進行全球分析人工智慧藥物研發市場分析及2034年預測:類型、產品、服務、技術、組件、應用、部署、最終用戶、階段藥物研發市場中的人工智慧(按治療領域、應用和地區)
 藥物發現中的人工智慧市場規模、佔有率、成長分析(按組成部分、按技術、按應用、按地區)- 產業預測,2024-2031 年
 藥物發現中人工智慧的全球市場:按流程、按使用案例、按治療領域、按參與企業類型、按工具、按部署、按最終用戶、按地區 - 預測到 2029 年