


 |
市場調查報告書
商品編碼
2107334
抗肥胖藥物市場:按分子類型、藥物類型、活性成分、作用機制、促效劑類型、作用途徑、給藥途徑、分銷管道、地區和主要參與者分類:趨勢及至2035年的預測Anti-Obesity Drugs Market by Type of Molecule, Type of Drug, Active Compound, Mechanism of Action, Type of Agonist, Action Pathway, Route of Administration, Distribution Channel, Geographical Regions, and Key Players - Trends and Forecast Till 2035 |
||||||

抗肥胖藥物市場概覽
全球抗肥胖藥物市場規模預計將從今年的 451 億美元成長到 2035 年的 1,065 億美元,預測期內複合年成長率約為 10.0%。
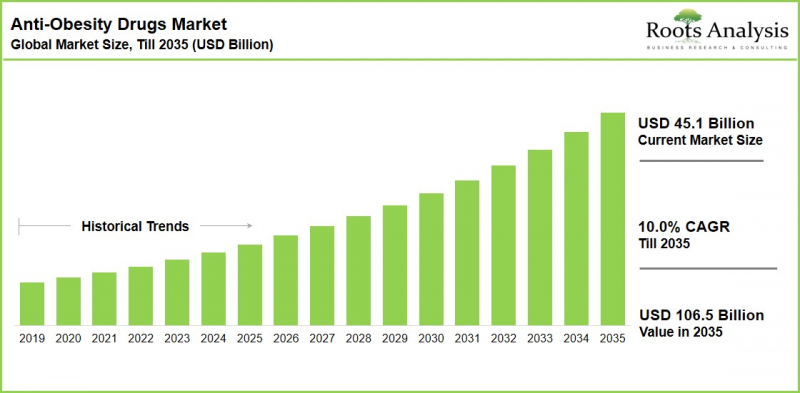
抗肥胖藥物市場:成長與趨勢
肥胖已成為全球最嚴重的慢性代謝性疾病之一,對全球公共衛生帶來沉重負擔。根據非傳染性疾病風險因子合作組織(NCD Risk Factor Collaboration)彙編的全球數據,目前全球有超過10億人患有肥胖症,其中包括約8.8億成年人和1.59億兒童及青少年。日益嚴重的肥胖負擔導致對有效藥物療法的持續需求。肥胖與糖尿病、心血管疾病以及多種癌症之間的密切聯繫進一步加劇了這種需求。
該市場的商業性轉捩點是GLP-1受體促效劑的興起。基於這種作用機制的療法,例如Semaglutide和替澤帕肽,已顯示出與傳統手術干預相當甚至更優的減重效果。
臨床證據日益強化了抗肥胖療法在體重管理之外的價值提案。例如,SELECT心血管結局試驗表明,對於有心血管疾病史的超重或肥胖成年人,Semaglutide可降低20%的主要心血管不利事件風險。這些發現正在拓展此類療法作為心血管代謝治療手段的臨床應用,從而惠及更廣泛的患者群體,並改善醫療保險報銷前景。
此外,從注射劑型轉變為口服劑型的轉變進一步激發了市場相關人員對創新的興趣。雖然注射型GLP-1療法已確立了臨床療效基準,但仍面臨低溫運輸物流、注射針頭抵觸以及分銷成本等諸多挑戰。口服抗肥胖療法的研發可望改善病患的用藥便利性。例如,OPKO Health和Entera Bio正在聯合開發OPK-88006,這是一種每日口服的GLP-1/升糖素雙重促效劑。此類創新有望促進減重療法的使用,尤其是在低溫運輸儲存和醫療基礎設施有限的地區。
成長驅動力:加速市場擴張的因素
- 全球肥胖盛行率不斷上升:已開發國家和發展中國家的成人和兒童肥胖病例持續增加。因此,各國政府和醫療保險機構面臨越來越大的壓力,需要支持有效的藥物療法,並為新藥上市創造有利的監管和報銷環境。
- 除了減重之外,GLP-1 和多受體促效劑療法也展現出心血管、腎臟和代謝方面的益處。因此,醫療專業人員和保險公司越來越認知到,這些療法不僅是減重藥物,更是疾病修正治療,這推動了其適應症的擴大和療程的延長。
- 臨床研發管線拓展:抗肥胖藥物研發管線正在拓展,不再侷限於目前市售的單一促效劑療法。包括CagriSema、letatorutide和servodutide在內的多種雙重激動劑和三重促效劑候選藥物正進入後期臨床試驗階段。此外,口服候選藥物如orfolglipron和ECC5004,一旦獲得監管部門批准,可望擴大治療覆蓋範圍並加速藥物推廣應用。
- 策略整合與地理擴張:大型製藥企業和數位醫療公司正在收購擁有獨特優勢的公司,以鞏固其在該領域的地位。 Voy 收購印度線上體重管理平台 EarlyFit 就是一個例證,說明企業如何利用併購快速進入尚未開發的龐大肥胖市場。
市場挑戰:阻礙進展的主要障礙
儘管市場需求強勁,仍面臨許多挑戰。其中一個潛在挑戰是研發新型減肥藥的高成本。此外,為證明藥物能持續減重且對心血管代謝安全,需要進行多年、多階段的臨床試驗,阻礙了一些研發公司進入市場。嚴格的監管審查也進一步增加了市場准入的時間和成本。
生產能力也是一個主要的阻礙因素。目前主導市場的兩家公司諾和諾德和禮來自於2022年以來一直面臨供不應求,因為對GLP-1療法的需求超過了它們現有的產能。公眾認知是另一個影響因素,因為即使臨床證據有利,對副作用和長期安全性的擔憂也會延遲患者的接受度。上市後監測和醫師教育對於應對這項挑戰至關重要。
抗肥胖藥物市場:關鍵洞察
本報告分析了目前抗肥胖藥物市場的現狀,並指出了最有可能影響其未來發展方向的趨勢。主要發現包括:
- 新參與企業的加入加劇了市場競爭:禮來和諾和諾德繼續主導全球供應和銷售。然而,羅氏近期宣布投資20億美元,擴大在美國的減肥藥產能。此外,梯瓦製藥推出首個Liraglutide學名藥表明,老牌巨頭與新參與企業之間的競爭格局正在擴大。
- 口服療法具有巨大的成長潛力:例如,每日一次的口服減肥藥OPK-88006正處於臨床開發階段。如果獲得批准,這些藥物有望改善患者的治療可近性,尤其是在醫療基礎設施薄弱且對治療費用高度敏感的地區。
- 生物製藥在開發平臺中仍然佔據主導地位:大多數後期減肥藥候選藥物仍然是 GLP-1 生物製藥,這解釋了為什麼即使小分子藥物和口服替代藥物日益成熟,這類分子仍有望繼續擴大其市場佔有率。
- 併購活動增加:企業擴大將收購作為拓展分銷能力的策略手段,而不是自行建構新的經銷網路。例如,Voy 透過收購 EarlyFit 進入印度市場,從而實現了快速市場准入並建立了穩固的本地基礎。
抗肥胖藥物市場的細分領域
市場規模和機會分析是根據以下參數進行細分的:
依分子類型
- 生物製藥
- 低分子化合物
依藥物類型
- 處方藥
- 非處方藥
按活性成分
- 蒂爾澤帕蒂德
- Semaglutide
- 萊塔火炬
- 舒沃度胜肽
- 卡格列林肽和Semaglutide
- 橄欖核
- Liraglutide
- 其他
透過作用機制
- GLP-1促效劑
- GLP-1促效劑/GIP促效劑
- GLP-1促效劑/GCGR促效劑
- GLP-1促效劑/Amylin 類似物
- GLP-1/GCGR/GIP促效劑
- 其他
促效劑類型
- 單促效劑
- 雙重促效劑
- 促效劑
依作用途徑
- 中央作用
- 周邊作用型
- 中樞和周邊效應
透過行政途徑
- 口服
- 腸外
透過分銷管道
- 醫院藥房
- 零售藥局及網路藥局
按地區
- 北美洲
- 美國
- 加拿大
- 歐洲
- 德國
- 英國
- 法國
- 義大利
- 西班牙
- 其他歐洲國家
- 亞太地區
- 日本
- 中國
- 澳洲
- 印度
- 韓國
- 亞太其他地區
- 拉丁美洲
- 巴西
- 阿根廷
- 其他拉丁美洲
抗肥胖藥物市場:關鍵市場區隔洞察
生物製藥正在推動抗肥胖藥物市場的發展。
根據Roots Analysis的市場評估,生物製藥領域目前佔據最大的市場佔有率。這一主導地位反映了生物製藥能夠作用於腸-腦激素通路,特別是GLP-1、GIP和升糖素受體,從而帶來除減重之外的廣泛代謝益處,包括降低心血管風險和改善血糖控制。大多數處於後期階段的減肥藥候選藥物也基於生物製劑平台,隨著更新、更有效的分子進入市場,該領域有望進一步擴大其領先優勢。
處方藥佔市場主導地位。
我們的分析表明,處方藥療法佔據市場主導地位。這一高佔有率源自於臨床驗證的療效和嚴謹的臨床試驗數據對醫師和患者帶來的信心。同時,非處方(OTC)體重管理產品雖然目前市佔率較小,但隨著消費者越來越尋求便捷的自我管理方案來進行初步的體重管理,預計其成長速度將更快。
在所有活性成分中,替拉唑肽是首選。
根據Roots Analysis的一份市場報告,替澤帕肽在活性成分市場中佔據超過45%的佔有率。如此高的市佔率歸功於其GIP/GLP-1雙重作用機制,該機制可同時調節食慾、胰島素分泌和能量消耗。同時,隨著新一代候選藥物的出現,治療選擇日益多樣化,「其他活性成分」細分市場預計將實現最高的複合年成長率。
GLP-1促效劑仍是主流藥物。
根據Roots Analysis的市場報告,GLP-1促效劑因其在改善血糖控制和增強飽足感方面的確切療效,仍然是主要的作用機制。然而,GLP-1/GCGR雙重促效劑預計將在預測期內實現最高的複合年成長率。推動這一成長的主要因素是越來越多的臨床數據表明,同時靶向多個代謝路徑可以改善體重減輕和更廣泛的代謝結果。
北美繼續引領市場。
目前,北美在全球市場佔有率中佔據最大佔有率。這一高佔有率得益於北美較高的肥胖率、成熟的醫療保健基礎設施以及相對有利的保險報銷體系。同時,預計到2035年,亞太地區將實現最高的複合年成長率。這一前所未有的成長主要由中國、印度、日本和韓國不斷上升的肥胖率、快速的都市化以及全部區域的擴大和醫療保健支出的增加所驅動。
抗肥胖藥物市場主要公司的例子
- Eli Lilly
- Novo Nordisk
- Pfizer
- AstraZeneca
- Roche
- Boehringer Ingelheim
- Zealand Pharma
- Viking Therapeutics
- Regeneron
專家訪談與業界考察
本研究包含以下產業相關人員的詳細訪談記錄:
- 美國一家中型公司的共同創辦人兼首席醫療顧問
- 美國主要公司執行長
- 美國一家小型企業的執行長
- 美國某大型公司健康與生活醫學系首席醫學編輯。
- 美國小規模研究所內分泌學家兼主任
- 美國某大型醫療機構內科及小兒科副教授。
- 美國某知名研究機構糖尿病、內分泌及代謝科醫學教授。
- 加拿大小規模醫療機構的研究員
- 丹麥一家大型公司的前執行長
- IDEA(一家大型丹麥公司)前副總裁
抗肥胖藥物市場:研究範圍
- 市場規模和機會分析:本報告按分子類型、藥物類型、活性成分、作用機制、促效劑類型、作用途徑、給藥途徑、配銷通路和地區,對全球抗肥胖藥物市場進行了詳細分析。
- 競爭格局:我們根據成立年份、公司規模、總部所在地和產品線廣度等參數,對開發和銷售抗肥胖藥物的公司進行詳細評估。
- 公司簡介:主要公司的詳細介紹,包括成立年份、總部所在地、公司規模、經營團隊、產品系列以及近期策略性舉措。
- 大型製藥企業的措施:本章全面分析了抗肥胖藥物市場領導者正在採取的策略性措施。每項措施都基於多個參數進行評估,包括舉措數量、實施年限、舉措類型、合作結構、業務拓展形式,以及按大型製藥企業數量和地區進行的分析。
- 市場影響分析:這包括評估最有可能影響短期和長期市場成長的促進因素、限制因素、機會和挑戰。
目錄
第1章 背景
第2章:調查方法
第3章 經濟及其他項目特定考量因素
第4章 宏觀經濟指標
第5章執行摘要
第6章:引言
第7章 市場情勢:抗肥胖藥物
第8章 公司簡介:總部位於北美的抗肥胖藥物研發公司
- 章節概要
- 公司詳細簡介
- Eli Lilly
- Pfizer
- Regeneron
- 公司簡介概述
- CinFina Pharma
- Kallyope
- Viking Therapeutics
第9章 公司簡介:總部位於歐洲的抗肥胖藥物研發公司
- 章節概要
- 公司詳細簡介
- AstraZeneca
- Novo Nordisk
- Roche
- 公司簡介概述
- Adocia
- Boehringer Ingelheim
- Zealand Pharma
第10章 公司簡介:總部位於亞太地區及世界其他地區的抗肥胖藥物研發公司
- 章節概要
- 公司詳細簡介
- Hanmi Pharmaceuticals
- Jiangsu Hengrui Pharmaceuticals
- 公司簡介概述
- Gmax Biopharma
- PegBio
- QL Biopharm
- Sciwind Biosciences
第11章:主要製藥公司的舉措
第12章 市場影響分析:促進因素、阻礙因素、機會與挑戰
第13章:全球抗肥胖藥物市場
第14章:抗肥胖藥物市場(依分子類型分類)
第15章:抗肥胖藥物市場(依藥物類型分類)
第16章:抗肥胖藥物市場(依活性成分分類)
第17章:抗肥胖藥物市場(依作用機轉分類)
第18章:抗肥胖藥物市場(依促效劑類型分類)
第19章:抗肥胖藥物市場(依作用機制分類)
第20章:抗肥胖藥物市場(依給藥途徑分類)
第21章:抗肥胖藥物市場(依通路分類)
第22章:抗肥胖藥物市場(按主要地區分類)
第 23 章:抗肥胖藥物市場,已上市藥物和正在進行 III 期臨床試驗的藥物的銷售預測。
第24章:抗肥胖藥物市場(按主要公司分類)
第25章:高階主管洞見
第26章附錄1:表格形式數據
第27章 附錄2:公司與組織列表
ANTI-OBESITY DRUGS MARKET: OVERVIEW
As per Roots Analysis, the global anti-obesity drugs market is estimated to grow from USD 45.1 billion in the current year to USD 106.5 billion by 2035, reflecting a compound annual growth rate (CAGR) of approximately 10.0% during the forecast period.
Anti-Obesity Drugs Market: Growth and Trends
Obesity has emerged as one of the most significant chronic metabolic diseases worldwide, poses a significant global public health burden. As per the global data compiled by the NCD Risk Factor Collaboration, more than a billion people worldwide are currently living with obesity, comprising close to 880 million adults and roughly 159 million children and adolescents. The growing burden of obesity is creating sustained demand for effective pharmacological interventions. This demand is further driven by the strong association of obesity with diabetes, cardiovascular diseases, and several types of cancer.
The commercial inflection point for this market has been the rise of GLP-1 receptor agonists. Therapies built around this mechanism, including semaglutide and tirzepatide, have demonstrated weight-loss outcomes that rival or exceed those historically associated with surgical intervention.
Clinical evidence continues to strengthen the value proposition of anti-obesity therapies beyond weight management. For example, the SELECT cardiovascular outcomes trial demonstrated that semaglutide reduced the risk of major adverse cardiovascular events by 20% in overweight or obese adults with established cardiovascular disease. These findings have expanded the clinical role of these therapies as cardiometabolic treatments, supporting broader patient eligibility and improving reimbursement prospects.
Furthermore, the increasing shift from injectable to oral formats has further caught the attention of market players for innovations. While injectable GLP-1 therapies established the clinical benchmark, they carry meaningful friction in the form of cold-chain logistics, needle aversion, and distribution cost. The development of oral anti-obesity therapies is expected to improve patient access and convenience. For instance, OPKO Health and Entera Bio are jointly developing OPK-88006, an oral, once-daily dual GLP-1/glucagon agonist. Such innovations could expand the use of weight-loss therapies, particularly in regions with limited cold-chain storage and healthcare infrastructure.
Growth Drivers: Factors Accelerating Market Expansion
- Rising Global Obesity Prevalence: Adult and pediatric obesity cases continue to rise across both developed and emerging economies. As a result, governments and healthcare payers are under growing pressure to support effective pharmacological interventions, creating a favorable regulatory and reimbursement environment for new drug launches.
- Clinical Benefits Extending Beyond Weight Loss: GLP-1 and multi-agonist therapies have demonstrated cardiovascular, renal, and metabolic benefits in addition to weight reduction. As a result, healthcare providers and payers increasingly recognize these therapies as disease-modifying treatments rather than weight-loss drugs alone, supporting broader indications and longer treatment durations.
- Increasing Clinical Pipeline: The anti-obesity drug pipeline is expanding beyond currently marketed single-agonist therapies. Several dual- and tri-agonist candidates, including CagriSema, retatrutide, and survodutide, are progressing through late-stage clinical trials. In addition, oral candidates such as orforglipron and ECC5004 have the potential to expand treatment access and increase adoption following regulatory approval.
- Strategic Consolidation and Geographic Expansion: Larger pharmaceutical and digital-health players are acquiring niche capabilities to secure their position in this category. Voy's acquisition of India-based online weight-management platform EarlyFit is an example of how companies are using M&A to enter large, underpenetrated obesity markets quickly.
Market Challenges: Critical Barriers Hindering Progress
Despite the strength of underlying demand, the market faces several challenges. One of the potential challenges is high cost of novel obesity drugs development. In addition, the multi-year, multi-phase trial requirements needed to demonstrate durable weight loss and cardiometabolic safety discourage some developers from entering the category. Stringent regulatory review adds further time and cost to market entry.
Manufacturing capacity has also become a significant constraint. Novo Nordisk and Eli Lilly, the two companies that currently dominate the market, have faced persistent supply shortages since 2022 as demand for GLP-1-based therapies has outpaced installed production capacity. Public perception is a further variable as side effects and long-term safety questions can slow patient uptake even where clinical evidence is favorable. To address this challenge, post-marketing surveillance and physician education are of utmost importance.
Anti-Obesity Drugs Market: Key Insights
The report examines the current state of the anti-obesity drugs market and identifies the developments most likely to shape its trajectory. Selected findings include:
- Increasing Market Competition with Emerging Entrants: Eli Lilly and Novo Nordisk continue to dominate the global supply and revenue. However, Roche has recently announced a USD 2 billion investment to expand US manufacturing capacity for obesity drugs. Moreover, Teva's launch of the first generic liraglutide signals that the competitive base is starting to widen across well-established and new entrants.
- Oral Therapies Represent a Significant Growth Opportunity: Oral, once-daily obesity therapies, such as OPK-88006, are advancing through clinical development. Once approved, they could improve treatment access, especially in cost-sensitive regions with limited healthcare infrastructure.
- Biologics Continue to Dominate the Development Pipeline: The large majority of late-stage obesity candidates remain GLP-1-based biologics, reinforcing why this molecule class is expected to keep gaining share even as small-molecule and oral alternatives mature.
- Increasing Mergers and Acquisitions: Companies are increasingly using acquisitions as a strategic means of expanding their distribution capabilities rather than creating new distribution networks independently. For instance, Voy entered the Indian market by acquiring EarlyFit, enabling faster market access and an established local presence.
Anti-Obesity Drugs Market Segments
The market sizing and opportunity analysis has been segmented across the following parameters:
By Type of Molecule
- Biologics
- Small Molecules
By Type of Drug
- Prescription Drugs
- OTC Drugs
By Active Compound Used
- Tirzepatide
- Semaglutide
- Retatrutide
- Survodutide
- Cagrilintide and Semaglutide
- Orforglipron
- Liraglutide
- Other Active Compounds
By Mechanism of Action
- GLP-1 Agonist
- GLP-1 Agonist / GIP Agonist
- GLP-1 Agonist / GCGR Agonist
- GLP-1 Agonist / Amylin Analogue
- GLP-1 / GCGR / GIP Agonist
- Other Mechanisms of Action
By Type of Agonist
- Single-Agonist
- Dual-Agonist
- Tri-Agonist
By Action Pathway
- Centrally Acting
- Peripherally Acting
- Centrally Acting and Peripherally Acting
By Route of Administration
- Oral
- Parenteral
By Distribution Channel
- Hospital Pharmacy
- Retail and Online Pharmacy
By Geographical Regions
- North America
- US
- Canada
- Europe
- Germany
- UK
- France
- Italy
- Spain
- Rest of Europe
- Asia-Pacific
- Japan
- China
- Australia
- India
- South Korea
- Rest of Asia-Pacific
- Latin America
- Brazil
- Argentina
- Rest of Latin America
Anti-Obesity Drugs Market: Key Segmentation Insights
Biologics Lead the Anti-Obesity Drugs Market
Based on Roots Analysis market assessment, the biologics segment currently holds the highest share of the market. This leadership reflects the ability of biologic agents to act on gut-brain hormone pathways, namely GLP-1, GIP, and glucagon receptors, delivering metabolic benefits that extend well past weight reduction, including cardiovascular risk mitigation and improved glycemic control. With the majority of late-stage obesity pipeline candidates also built on biologic platforms, this segment is well positioned to extend its lead as newer, more effective molecules reach the market.
Prescription Therapies Dominate the Market Landscape
On the basis of our analysis, prescription therapies hold the larger share of the market. This highest share is due to clinically validated efficacy and the confidence that rigorous trial data affords physicians and patients. On the other hand, OTC weight-management products, while smaller today, are expected to grow at a faster pace as consumers increasingly seek accessible, self-directed options for early-stage weight management.
Tirzepatide Leads Among Active Compound
Based on the Roots Analysis market report, Tirzepatide holds more than 45% of market share among active compounds. This highest share is due to its dual GIP/GLP-1 mechanism, which simultaneously regulates appetite, insulin secretion, and energy expenditure. Meanwhile, other active compounds segment is expected to register the highest CAGR as next-generation candidates diversify the treatment landscape.
GLP-1 Agonists Remain Dominant
Based on the Roots Analysis market report, GLP-1 agonists remain the dominant mechanism given their established ability to improve glycemic control while enhancing satiety. However, dual GLP-1/GCGR agonists are likely to register the highest CAGR during the forecast period. This growth is largely because clinical data increasingly show that targeting multiple metabolic pathways simultaneously can improve both weight loss and broader metabolic outcomes.
North America Maintains Market Leadership
North America currently commands the highest global market revenue share. This highest share is supported by high obesity prevalence, mature healthcare infrastructure, and comparatively favourable reimbursement pathways. Asia-Pacific, meanwhile, is projected to register the highest regional CAGR through 2035. This unprecedented growth is driven by rising obesity rates in China, India, Japan, and South Korea, rapid urbanization, and expanding healthcare access and expenditure across the region.
Example Players in Anti-Obesity Drugs Market
- Eli Lilly
- Novo Nordisk
- Pfizer
- AstraZeneca
- Roche
- Boehringer Ingelheim
- Zealand Pharma
- Viking Therapeutics
- Regeneron
Expert Interview and Industry Insights
The research features detailed transcripts of interviews held with the following industry stakeholders:
- Co-founder and Chief Medical Advisor, Mid-sized Company, US
- Chief Executive Officer, Very Large Company, US
- Chief Executive Officer, Small Company, US
- Chief Physician Editor, Health and Lifestyle Medicine, Large Company, US
- Endocrinologist and Owner, Small Institute, US
- Associate Professor of Medicine and Pediatrics, Very Large Institute, US
- Professor of Medicine, Division of Diabetes, Endocrinology and Metabolism, Very Large Institute, US
- Research Scientist, Small Institute, Canada
- Former Chief Executive Officer, Very Large Company, Denmark
- Former Vice President of IDEA, Very Large Company, Denmark
ANTI-OBESITY DRUGS MARKET: RESEARCH COVERAGE
- Market Sizing and Opportunity Analysis: An in-depth analysis of the global anti-obesity drugs market across type of molecule, type of drug, active compound, mechanism of action, type of agonist, action pathway, route of administration, distribution channel, and geography.
- Competitive Landscape: A detailed assessment of companies developing and marketing anti-obesity drugs, benchmarked on parameters such as year of establishment, company size, headquarters location, and pipeline breadth.
- Company Profiles: In-depth profiles of leading players, covering year of establishment, headquarters, company size, management team, product portfolio, and recent strategic initiatives.
- Big Pharma Initiatives: A comprehensive analysis of strategic initiatives undertaken by leading pharmaceutical companies in the anti-obesity drugs market. The chapter evaluates initiatives across multiple parameters, including number of initiatives, year of initiatives, year and types of initiatives, type of partnership, type of expansion, and big pharma players analysis by number and regions.
- Market Impact Analysis: An evaluation of the drivers, restraints, opportunities, and challenges most likely to shape near- and long-term market growth.
Key Questions Answered in this Report
- What is the current and projected size of the anti-obesity drugs market through 2035?
- What is the CAGR of the anti-obesity drugs market, and which segments are outgrowing the overall category?
- Which type of molecule, drug, active compound, and mechanism of action lead the market today?
- Which region currently dominates the market, and which region is growing the fastest?
- What are the primary growth drivers and restraints facing anti-obesity drug developers?
- Which companies are the leading developers and marketers of anti-obesity drugs?
- How is the shift from injectable to oral therapies expected to reshape competitive dynamics?
- What recent partnerships, approvals, and acquisitions are shaping the competitive landscape?
Reasons to Buy this Report
- Provides a comprehensive, segment-by-segment market analysis with detailed revenue projections, useful to established market leaders and new entrants alike.
- Offers a clear view of the drivers, restraints, opportunities, and challenges shaping the market, enabling data-driven strategic decisions.
- Helps businesses identify and evaluate emerging opportunities across molecule classes, routes of administration, and geographies.
- Supports demand forecasting by clarifying patient needs, prescribing patterns, and channel preferences across regions.
- Equips new entrants with the market intelligence needed to design credible go-to-market and pricing strategies.
- Strengthens stakeholder communication and partnership discussions with a single, well-referenced source of market data.
Additional Benefits
- Complementary PPT Insights Pack
- Complementary Excel Data Packs for all Analytical Modules in the Report
- 15% Free Content Customization
- Detailed Report Walkthrough Session with Research Team
- Free Updated report if the report is 6-12 months old or older
TABLE OF CONTENTS
1. BACKGROUND
- 1.1. Context
- 1.2. Project Objectives
2. RESEARCH METHODOLOGY
- 2.1. Chapter Overview
- 2.2. Research Assumptions
- 2.2.1. Market Landscape and Market Trends
- 2.2.2. Market Forecast and Opportunity Analysis
- 2.2.3. Comparative Analysis
- 2.3. Database Building
- 2.3.1. Data Collection
- 2.3.2. Data Validation
- 2.3.3. Data Analysis
- 2.4. Project Methodology
- 2.4.1. Secondary Research
- 2.4.1.1. Annual Reports
- 2.4.1.2. Academic Research Papers
- 2.4.1.3. Company Websites
- 2.4.1.4. Investor Presentations
- 2.4.1.5. Regulatory Filings
- 2.4.1.6. White Papers
- 2.4.1.7. Industry Publications
- 2.4.1.8. Conferences and Seminars
- 2.4.1.9. Government Portals
- 2.4.1.10. Media and Press Releases
- 2.4.1.11. Newsletters
- 2.4.1.12. Industry Databases
- 2.4.1.13. Roots Proprietary Databases
- 2.4.1.14. Paid Databases and Sources
- 2.4.1.15. Social Media Portals
- 2.4.1.16. Other Secondary Sources
- 2.4.2. Primary Research
- 2.4.2.1. Types of Primary Research
- 2.4.2.1.1. Qualitative Research
- 2.4.2.1.2. Quantitative Research
- 2.4.2.1.3. Hybrid Approach
- 2.4.2.2. Advantages of Primary Research
- 2.4.2.3. Techniques for Primary Research
- 2.4.2.3.1. Interviews
- 2.4.2.3.2. Surveys
- 2.4.2.3.3. Focus Groups
- 2.4.2.3.4. Observational Research
- 2.4.2.3.5. Social Media Interactions
- 2.4.2.4. Key Opinion Leaders Considered in Primary Research
- 2.4.2.4.1. Company Executives (CXOs)
- 2.4.2.4.2. Board of Directors
- 2.4.2.4.3. Company Presidents and Vice Presidents
- 2.4.2.4.4. Research and Development Heads
- 2.4.2.4.5. Technical Experts
- 2.4.2.4.6. Subject Matter Experts
- 2.4.2.4.7. Scientists
- 2.4.2.4.8. Doctors and Other Healthcare Providers
- 2.4.2.5. Ethics and Integrity
- 2.4.2.5.1. Research Ethics
- 2.4.2.5.2. Data Integrity
- 2.4.2.1. Types of Primary Research
- 2.4.3. Analytical Tools and Databases
- 2.4.1. Secondary Research
- 2.5. Robust Quality Control
3. ECONOMIC AND OTHER PROJECT-SPECIFIC CONSIDERATIONS
- 3.1. Chapter Overview
- 3.2. Forecast Methodology
- 3.2.1. Top-down Approach
- 3.2.2. Bottom-up Approach
- 3.2.3. Hybrid Approach
- 3.3. Market Assessment Framework
- 3.3.1. Total Addressable Market (TAM)
- 3.3.2. Serviceable Addressable Market (SAM)
- 3.3.3. Serviceable Obtainable Market (SOM)
- 3.3.4. Currently Acquired Market (CAM)
- 3.4. Forecasting Tools and Techniques
- 3.4.1. Qualitative Forecasting
- 3.4.2. Correlation
- 3.4.3. Regression
- 3.4.4. Extrapolation
- 3.4.5. Convergence
- 3.4.6. Sensitivity Analysis
- 3.4.7. Scenario Planning
- 3.4.8. Data Visualization
- 3.4.9. Time Series Analysis
- 3.4.10. Forecast Error Analysis
- 3.5. Key Considerations
- 3.5.1. Demographics
- 3.5.2. Government Regulations
- 3.5.3. Reimbursement Scenarios
- 3.5.4. Market Access
- 3.5.5. Supply Chain
- 3.5.6. Industry Consolidation
- 3.5.7. Pandemic / Unforeseen Disruptions Impact
- 3.6. Limitations
4. MACRO-ECONOMIC INDICATORS
- 4.1. Chapter Overview
- 4.2. Market Dynamics
- 4.2.1. Time Period
- 4.2.1.1. Historical Trends
- 4.2.1.2. Current and Forecasted Estimates
- 4.2.2. Currency Coverage
- 4.2.2.1. Major Currencies Affecting the Market
- 4.2.2.2. Factors Affecting Currency Fluctuations
- 4.2.2.3. Impact of Currency Fluctuations on the Industry
- 4.2.3. Foreign Currency Exchange Rate
- 4.2.3.1. Impact of Foreign Exchange Rate Volatility on the Market
- 4.2.3.2. Strategies for Mitigating Foreign Exchange Risk
- 4.2.4. Recession
- 4.2.4.1. Assessment of Current Economic Conditions and Potential Impact on the Market
- 4.2.4.2. Historical Analysis of Past Recessions and Lessons Learnt
- 4.2.5. Inflation
- 4.2.5.1. Measurement and Analysis of Inflationary Pressures in the Economy
- 4.2.5.2. Potential Impact of Inflation on the Market Evolution
- 4.2.6. Interest Rates
- 4.2.6.1. Interest Rates and Their Impact on the Market
- 4.2.6.2. Strategies for Managing Interest Rate Risk
- 4.2.7. Commodity Flow Analysis
- 4.2.7.1. Type of Commodity
- 4.2.7.2. Origins and Destinations
- 4.2.7.3. Values and Weights
- 4.2.7.4. Modes of Transportation
- 4.2.8. Global Trade Dynamics
- 4.2.8.1. Import Scenario
- 4.2.8.2. Export Scenario
- 4.2.8.3. Trade Policies
- 4.2.8.4. Strategies for Mitigating the Risks Associated with Trade Barriers
- 4.2.8.5. Impact of Trade Barriers on the Market
- 4.2.9. War Impact Analysis
- 4.2.9.1. Russian-Ukraine War
- 4.2.9.2. Israel-Hamas War
- 4.2.10. COVID Impact / Related Factors
- 4.2.10.1. Global Economic Impact
- 4.2.10.2. Industry-specific Impact
- 4.2.10.3. Government Response and Stimulus Measures
- 4.2.10.4. Future Outlook and Adaptation Strategies
- 4.2.11. Other Indicators
- 4.2.11.1. Fiscal Policy
- 4.2.11.2. Consumer Spending
- 4.2.11.3. Gross Domestic Product (GDP)
- 4.2.11.4. Employment
- 4.2.11.5. Taxes
- 4.2.11.6. Stock Market Performance
- 4.2.11.7. Cross-Border Dynamics
- 4.2.1. Time Period
- 4.3. Conclusion
5. EXECUTIVE SUMMARY
6. INTRODUCTION
- 6.1. Overview of Anti-Obesity Drugs
- 6.2. Health Risks Linked with Long-term Obesity
- 6.3. Currently Approved Anti-Obesity Drug Classes
- 6.4. Challenges Associated with Anti-Obesity Drugs
- 6.5. Future Perspectives
7. MARKET LANDSCAPE: ANTI-OBESITY DRUGS
- 7.1. Market Landscape: Anti-Obesity Drugs
- 7.1.1. Analysis by Status of Development
- 7.1.2. Analysis by Type of Molecule
- 7.1.3. Analysis by Mechanism of Action
- 7.1.4. Analysis by Type of Agonist
- 7.1.5. Analysis by Route of Administration
- 7.1.6. Analysis by Dosage Frequency
- 7.1.7. Analysis by Type of Therapy
- 7.2. Developer Landscape: Anti-Obesity Drugs
- 7.2.1. Analysis by Year of Establishment
- 7.2.2. Analysis by Company Size
- 7.2.3. Analysis by Location of Headquarters
- 7.2.4. Analysis by Headquarters (Country) and Status of Development
- 7.2.5. Most Active Developers: Analysis by Number of Drug Candidates
8. COMPANY PROFILES: ANTI-OBESITY DRUG DEVELOPERS BASED IN NORTH AMERICA
- 8.1. Chapter Overview
- 8.2. Detailed Company Profiles
- 8.2.1. Eli Lilly
- 8.2.1.1. Company Details
- 8.2.1.2. Pipeline Portfolio
- 8.2.1.3. Financial Details
- 8.2.1.4. Recent Developments and Future Outlook
- 8.2.2. Pfizer
- 8.2.3. Regeneron
- 8.2.1. Eli Lilly
- 8.3. Brief Company Profiles
- 8.3.1. CinFina Pharma
- 8.3.1.1. Company Details
- 8.3.1.2. Pipeline Portfolio
- 8.3.2. Kallyope
- 8.3.3. Viking Therapeutics
- 8.3.1. CinFina Pharma
9. COMPANY PROFILES: ANTI-OBESITY DRUG DEVELOPERS BASED IN EUROPE
- 9.1. Chapter Overview
- 9.2. Detailed Company Profiles
- 9.2.1. AstraZeneca
- 9.2.1.1. Company Details
- 9.2.1.2. Pipeline Portfolio
- 9.2.1.3. Financial Details
- 9.2.1.4. Recent Developments and Future Outlook
- 9.2.2. Novo Nordisk
- 9.2.3. Roche
- 9.2.1. AstraZeneca
- 9.3. Brief Company Profiles
- 9.3.1. Adocia
- 9.3.1.1. Company Details
- 9.3.1.2. Pipeline Portfolio
- 9.3.2. Boehringer Ingelheim
- 9.3.3. Zealand Pharma
- 9.3.1. Adocia
10. COMPANY PROFILES: ANTI-OBESITY DRUG DEVELOPERS BASED IN ASIA-PACIFIC AND REST OF THE WORLD
- 10.1. Chapter Overview
- 10.2. Detailed Company Profiles
- 10.2.1. Hanmi Pharmaceuticals
- 10.2.1.1. Company Details
- 10.2.1.2. Pipeline Portfolio
- 10.2.1.3. Financial Details
- 10.2.1.4. Recent Developments and Future Outlook
- 10.2.2. Jiangsu Hengrui Pharmaceuticals
- 10.2.1. Hanmi Pharmaceuticals
- 10.3. Brief Company Profiles
- 10.3.1. Gmax Biopharma
- 10.3.1.1. Company Details
- 10.3.1.2. Pipeline Portfolio
- 10.3.2. PegBio
- 10.3.3. QL Biopharm
- 10.3.4. Sciwind Biosciences
- 10.3.1. Gmax Biopharma
11. BIG PHARMA INITIATIVES
- 11.1. Methodology
- 11.2. Big Pharma Players: Anti-obesity focused Initiatives
- 11.2.1. Analysis of Big Pharma Players by Number of Initiatives
- 11.2.2. Analysis by Year of Initiative
- 11.2.3. Analysis by Big Pharma Player by Year of Initiative and Number of Initiatives
- 11.2.4. Analysis by Type of Initiative
- 11.2.5. Analysis by Year and Type of Initiative
- 11.2.6. Analysis by Big Pharma Player and Type of Initiative
- 11.2.7. Analysis by Big Pharma Player and Number of Partnerships
- 11.2.8. Analysis by Type of Partnership
- 11.2.9. Analysis by Type of Expansion
- 11.2.10. Analysis by Big Pharma Player by Region and Number of Initiatives
- 11.2.11. Benchmarking of Big Pharma Players
12. MARKET IMPACT ANALYSIS: DRIVERS, RESTRAINTS, OPPORTUNITIES AND CHALLENGES
- 12.1. Chapter Overview
- 12.2. Market Drivers
- 12.3. Market Restraints
- 12.4. Market Opportunities
- 12.5. Market Challenges
13. GLOBAL ANTI-OBESITY DRUGS MARKET
- 13.1. Forecast Methodology and Key Assumptions
- 13.2. Global Anti-Obesity Drugs Market, Historical Trends (Since 2019) and Forecasted Estimates (Till 2035) (USD Billion)
- 13.2.1. Scenario Analysis
- 13.2.1.1. Conservative Scenario
- 13.2.1.2. Optimistic Scenario
- 13.2.1. Scenario Analysis
- 13.3. Key Market Segmentations
14. ANTI-OBESITY DRUGS MARKET, BY TYPE OF MOLECULE
- 14.1. Anti-Obesity Drugs Market: Distribution by Type of Molecule
- 14.1.1. Anti-Obesity Drugs Market for Biologics, Historical Trends (since 2019) and Forecasted Estimates (till 2035)
- 14.1.2. Anti-Obesity Drugs Market for Small Molecules, Historical Trends (since 2019) and Forecasted Estimates (till 2035)
15. ANTI-OBESITY DRUGS MARKET, BY TYPE OF DRUG
- 15.1. Anti-Obesity Drugs Market: Distribution by Type of Drug
- 15.1.1. Anti-Obesity Drugs Market for Prescription Drugs, Historical Trends (since 2019) and Forecasted Estimates (till 2035)
- 15.1.2. Anti-Obesity Drugs Market for OTC Drugs, Historical Trends (since 2019) and Forecasted Estimates (till 2035)
16. ANTI-OBESITY DRUGS MARKET, BY ACTIVE COMPOUND USED
- 16.1. Anti-Obesity Drugs Market: Distribution by Active Compound Used
- 16.1.1. Anti-Obesity Drugs Market for Tirzepatide, Historical Trends (since 2019) and Forecasted Estimates (till 2035)
- 16.1.2. Anti-Obesity Drugs Market for Semaglutide, Historical Trends (since 2019) and Forecasted Estimates (till 2035)
- 16.1.3. Anti-Obesity Drugs Market for Retatrutide, Historical Trends (since 2019) and Forecasted Estimates (till 2035)
- 16.1.4. Anti-Obesity Drugs Market for Survodutide, Historical Trends (since 2019) and Forecasted Estimates (till 2035)
- 16.1.5. Anti-Obesity Drugs Market for Cagrilintide and Semaglutide, Historical Trends (since 2019) and Forecasted Estimates (till 2035)
- 16.1.6. Anti-Obesity Drugs Market for Orforglipron, Historical Trends (since 2019) and Forecasted Estimates (till 2035)
- 16.1.7. Anti-Obesity Drugs Market for Liraglutide, Historical Trends (since 2019) and Forecasted Estimates (till 2035)
- 16.1.8. Anti-Obesity Drugs Market for other active compounds used, Historical Trends (since 2019) and Forecasted Estimates (till 2035)
17. ANTI-OBESITY DRUGS MARKET, BY MECHANISM OF ACTION
- 17.1. Anti-Obesity Drugs Market: Distribution by Mechanism of Action
- 17.1.1. Anti-Obesity Drugs Market for GLP-1 Agonist / GIP Agonist, Historical Trends (since 2019) and Forecasted Estimates (till 2035)
- 17.1.2. Anti-Obesity Drugs Market for GLP-1 Agonist, Historical Trends (since 2019) and Forecasted Estimates (till 2035)
- 17.1.3. Anti-Obesity Drugs Market for GLP-1 Agonist / GCGR Agonist, Historical Trends (since 2019) and Forecasted Estimates (till 2035)
- 17.1.4. Anti-Obesity Drugs Market for GLP-1 / GCGR / GIP Agonist, Historical Trends (since 2019) and Forecasted Estimates (till 2035)
- 17.1.5. Anti-Obesity Drugs Market for GLP-1 Agonist / Amylin Analogue, Historical Trends (since 2019) and Forecasted Estimates (till 2035)
- 17.1.6. Anti-Obesity Drugs Market for Other Mechanisms of Action, Historical Trends (since 2019) and Forecasted Estimates (till 2035)
18. ANTI-OBESITY DRUGS MARKET, BY TYPE OF AGONIST
- 18.1. Anti-Obesity Drugs Market: Distribution by Type of Agonist
- 18.1.1. Anti-Obesity Drugs Market for Single-Agonist, Historical Trends (since 2019) and Forecasted Estimates (till 2035)
- 18.1.2. Anti-Obesity Drugs Market for Dual-Agonist, Historical Trends (since 2019) and Forecasted Estimates (till 2035)
- 18.1.3. Anti-Obesity Drugs Market for Tri-Agonist, Historical Trends (since 2019) and Forecasted Estimates (till 2035)
19. ANTI-OBESITY DRUGS MARKET, BY ACTION PATHWAY
- 19.1. Anti-Obesity Drugs Market: Distribution by Action Pathway
- 19.1.1. Anti-Obesity Drugs Market for Centrally Acting Drugs, Historical Trends (since 2019) and Forecasted Estimates (till 2035)
- 19.1.2. Anti-Obesity Drugs Market for Peripherally Acting Drugs, Historical Trends (since 2019) and Forecasted Estimates (till 2035)
- 19.1.3. Anti-Obesity Drugs Market for Centrally Acting and Peripherally Acting Drugs, Historical Trends (since 2019) and Forecasted Estimates (till 2035)
20. ANTI-OBESITY DRUGS MARKET, BY ROUTE OF ADMINISTRATION
- 20.1. Anti-Obesity Drugs Market: Distribution by Route of Administration
- 20.1.1. Anti-Obesity Drugs Market for Oral Administration, Historical Trends (since 2019) and Forecasted Estimates (till 2035)
- 20.1.2. Anti-Obesity Drugs Market for Parenteral Administration, Historical Trends (since 2019) and Forecasted Estimates (till 2035)
21. ANTI-OBESITY DRUGS MARKET, BY DISTRIBUTION CHANNEL
- 21.1. Anti-Obesity Drugs Market: Distribution by Distribution Channel
- 21.1.1. Anti-Obesity Drugs Market for Hospital Pharmacy, Historical Trends (since 2019) and Forecasted Estimates (till 2035)
- 21.1.2. Anti-Obesity Drugs Market for Retail and Online Pharmacy, Historical Trends (since 2019) and Forecasted Estimates (till 2035)
22. ANTI-OBESITY DRUGS MARKET, BY KEY GEOGRAPHICAL REGIONS
- 22.1. Anti-Obesity Drugs Market: Distribution by Key Geographical Regions
- 22.1.1. Anti-Obesity Drugs Market in North America, Historical Trends (since 2019) and Forecasted Estimates (till 2035)
- 22.1.2. Anti-Obesity Drugs Market in Europe, Historical Trends (since 2019) and Forecasted Estimates (till 2035)
- 22.1.3. Anti-Obesity Drugs Market in Asia-Pacific, Historical Trends (since 2019) and Forecasted Estimates (till 2035)
- 22.1.4. Anti-Obesity Drugs Market in Latin America, Historical Trends (since 2019) and Forecasted Estimates (till 2035)
23. ANTI-OBESITY DRUGS MARKET, SALES FORECAST OF MARKETED AND PHASE III DRUGS
- 23.1. Marketed Drugs: Sales Forecast
- 23.1.1. Contrave / Mysimba (Naltrexone, Bupropion)
- 23.1.2. Feisumei (Beinaglutide)
- 23.1.3. Imcivree (Setmelanotide)
- 23.1.4. LOMAIRA (Phentermine Hydrochloride)
- 23.1.5. QSYMIA (Phentermine and Topiramate)
- 23.1.6. Saxenda (Liraglutide)
- 23.1.7. Wegovy / Ozempic (Semaglutide)
- 23.1.8. Zepbound / Mounjaro (Tirzepatide)
- 23.2. Phase III Drugs: Sales Forecast
- 23.2.1. BI 456906 (Survodutide)
- 23.2.2. CagriSema (Cagrilintide and Semaglutide)
- 23.2.3. HM11260C (Efpeglenatide)
- 23.2.4. HRS-9531
- 23.2.5. IBI362 (Mazdutide)
- 23.2.6. LM-008
- 23.2.7. LY3437943 (Retatrutide)
- 23.2.8. LY3502970 (Orforglipron)
- 23.2.9. TG103
- 23.2.10. Semaglutide 7.2 mg (Subcutaneous)
- 23.2.11. Semaglutide (Oral)
- 23.2.12. XW003
24. ANTI-OBESITY DRUGS MARKET, BY KEY PLAYERS
25. EXECUTIVE INSIGHTS
26. APPENDIX 1: TABULATED DATA
27. APPENDIX 2: LIST OF COMPANIES AND ORGANIZATIONS
List of Tables
- Table 7.1 List of Anti-Obesity Drugs
- Table 7.2 List of Anti-Obesity Drug Developers
- Table 8.1 Eli Lily: Pipeline Portfolio
- Table 8.2 Eli Lily: Recent Developments and Future Outlook
- Table 8.3 Pfizer: Pipeline Portfolio
- Table 8.4 Pfizer: Recent Developments and Future Outlook
- Table 8.5 Regeneron: Pipeline Portfolio
- Table 8.6 Regeneron: Recent Developments and Future Outlook
- Table 8.7 CinFina Pharma: Pipeline Portfolio
- Table 8.8 Kallyope: Pipeline Portfolio
- Table 8.9 Viking Therapeutics: Pipeline Portfolio
- Table 9.1 AstraZeneca: Pipeline Portfolio
- Table 9.2 AstraZeneca: Recent Developments and Future Outlook
- Table 9.3 Novo Nordisk: Pipeline Portfolio
- Table 9.4 Novo Nordisk: Recent Developments and Future Outlook
- Table 9.5 Roche: Pipeline Portfolio
- Table 9.6 Roche: Recent Developments and Future Outlook
- Table 9.7 Adocia: Pipeline Portfolio
- Table 9.8 Boehringer Ingelheim: Pipeline Portfolio
- Table 9.9 Zealand Pharma: Pipeline Portfolio
- Table 10.1 Hanmi Pharmaceuticals: Pipeline Portfolio
- Table 10.2 Hanmi Pharmaceuticals: Recent Developments and Future Outlook
- Table 10.3 Jiangsu Hengrui Pharmaceuticals: Pipeline Portfolio
- Table 10.4 Jiangsu Hengrui Pharmaceuticals: Recent Developments and Future Outlook
- Table 10.5 Gmax Biopharma: Pipeline Portfolio
- Table 10.6 PegBio: Pipeline Portfolio
- Table 10.7 QL Biopharm: Pipeline Portfolio
- Table 10.8 Sciwind Biosciences: Pipeline Portfolio
- Table 11.1 Big Pharma Players: List of Anti-obesity Focused Initiatives
- Table 13.1 Anti-obesity Market: List of Forecasted Drugs
- Table 26.1 Anti-Obesity Drugs: Distribution by Status of Development
- Table 26.2 Anti-Obesity Drugs: Distribution by Type of Molecule
- Table 26.3 Anti-Obesity Drugs: Distribution by Mechanism of Action
- Table 26.4 Anti-Obesity Drugs: Distribution by Type of Agonist
- Table 26.5 Anti-Obesity Drugs: Distribution by Route of Administration
- Table 26.6 Anti-Obesity Drugs: Distribution by Dosage Frequency
- Table 26.7 Anti-Obesity Drugs: Distribution by Type of Therapy
- Table 26.8 Anti-Obesity Drug Developers: Distribution by Year of Establishment
- Table 26.9 Anti-Obesity Drug Developers: Distribution by Company Size
- Table 26.10 Anti-Obesity Drug Developers: Distribution by Location of Headquarters
- Table 26.11 Anti-Obesity Drug Developers: Distribution by Headquarters (Country) and Status of Development
- Table 26.12 Most Active Developers: Distribution by Number of Drugs
- Table 26.13 Eli Lilly: Annual Revenues (USD Billion)
- Table 26.14 Pfizer: Annual Revenues (USD Billion)
- Table 26.15 Regeneron: Annual Revenues (USD Billion)
- Table 26.16 AstraZeneca: Annual Revenues (USD Billion)
- Table 26.17 Novo Nordisk: Annual Revenues (DKK Billion)
- Table 26.18 Roche: Annual Revenues (CHF Billion)
- Table 26.19 Hanmi Pharmaceuticals: Annual Revenues (KRW Billion)
- Table 26.20 Jiangsu Hengrui Pharmaceuticals: Annual Revenues (CNY Billion)
- Table 26.21 Big Pharma Initiatives: Distribution of Big Pharma Players by Number of Initiatives
- Table 26.22 Big Pharma Initiatives: Distribution by Year of Initiative
- Table 26.23 Big Pharma Initiatives: Distribution by Big Pharma Players by Year and Number of Initiatives
- Table 26.24 Big Pharma Initiatives: Distribution by Type of Initiative
- Table 26.25 Big Pharma Initiatives: Distribution by Year and Type of Initiative
- Table 26.26 Big Pharma Initiatives: Distribution by Big Pharma Players and Type of Initiative
- Table 26.27 Big Pharma Initiatives: Distribution by Type of Partnership
- Table 26.28 Big Pharma Initiatives: Distribution by Type of Expansion
- Table 26.29 Big Pharma Initiatives: Distribution by Big Pharma Players by Region and Number of Initiatives
- Table 26.30 Global Anti-Obesity Drugs Market, Historical Trends (Since 2019) and Forecasted Estimates (Till 2035)
- Table 26.31 Global Anti-obesity Drugs Market, till 2035 (USD Billion): Conservative Scenario
- Table 26.32 Global Anti-obesity Drugs Market, till 2035 (USD Billion): Optimistic Scenario
- Table 26.33 Anti-obesity Drugs Market: Distribution by Type of Molecule
- Table 26.34 Anti-obesity Market for Biologics, till 2035 (USD Billion)
- Table 26.35 Anti-obesity Market for Small Molecules, till 2035 (USD Billion)
- Table 26.36 Anti-obesity Drugs Market: Distribution by Type of Drug
- Table 26.37 Anti-obesity Market for Prescription Drugs, till 2035 (USD Billion)
- Table 26.38 Anti-obesity Market for OTC Drugs, till 2035 (USD Billion)
- Table 26.39 Anti-obesity Drugs Market: Distribution by Active Compound Used
- Table 26.40 Anti-obesity Market for Tirzepatide, till 2035 (USD Billion)
- Table 26.41 Anti-obesity Market for Semaglutide, till 2035 (USD Billion)
- Table 26.42 Anti-obesity Market for Retatrutide, till 2035 (USD Billion)
- Table 26.43 Anti-obesity Market for Survodutide, till 2035 (USD Billion)
- Table 26.44 Anti-obesity Market for Cagrilintide / Semaglutide, till 2035 (USD Billion)
- Table 26.45 Anti-obesity Market for Orforglipron, till 2035 (USD Billion)
- Table 26.46 Anti-obesity Market for Liraglutide, till 2035 (USD Billion)
- Table 26.47 Anti-obesity Market for Other Compounds, till 2035 (USD Billion)
- Table 26.48 Anti-obesity Drugs Market: Distribution by Mechanism of Action
- Table 26.49 Anti-obesity Market for GLP-1 Agonist / GIP Agonist, till 2035 (USD Billion)
- Table 26.50 Anti-obesity Market for GLP-1 Agonist, till 2035 (USD Billion)
- Table 26.51 Anti-obesity Market for GLP-1 / GCGR / GIP Agonist, till 2035 (USD Billion)
- Table 26.52 Anti-obesity Market for GLP-1 Agonist / GCGR Agonist, till 2035 (USD Billion)
- Table 26.53 Anti-obesity Market for GLP-1 Agonist / Amylin Analogue, till 2035 (USD Billion)
- Table 26.54 Anti-obesity Market for Other Mechanisms of Action, till 2035 (USD Billion)
- Table 26.55 Anti-obesity Market: Distribution by Type of Agonist
- Table 26.56 Anti-obesity Market for Single-Agonist, till 2035 (USD Billion)
- Table 26.57 Anti-obesity Market for Dual-Agonist, till 2035 (USD Billion)
- Table 26.58 Anti-obesity Market for Tri-Agonist, till 2035 (USD Billion)
- Table 26.59 Anti-obesity Drugs Market: Distribution by Action Pathway
- Table 26.60 Anti-obesity Market for Centrally Acting Drugs, till 2035 (USD Billion)
- Table 26.61 Anti-obesity Market for Peripherally Acting Drugs, till 2035 (USD Billion)
- Table 26.62 Anti-obesity Market for Centrally and Peripherally Acting, till 2035 (USD Billion)
- Table 26.63 Anti-obesity Drugs Market: Distribution by Route of Administration
- Table 26.64 Anti-obesity Market for Parenteral Administration, till 2035 (USD Billion)
- Table 26.65 Anti-obesity Market for Oral Administration, till 2035 (USD Billion)
- Table 26.66 Anti-obesity Drugs Market: Distribution by Distribution Channel
- Table 26.67 Anti-obesity Market for Hospital Pharmacy, till 2035 (USD Billion)
- Table 26.68 Anti-obesity Market for Retail and Online Pharmacy, till 2035 (USD Billion)
- Table 26.69 Anti-obesity Drugs Market: Distribution by Geography
- Table 26.70 Anti-obesity Market in North America, till 2035 (USD Billion)
- Table 26.71 Anti-obesity Market in North America (country-wise), till 2035 (USD Billion)
- Table 26.72 Anti-obesity Market in Europe, till 2035 (USD Billion)
- Table 26.73 Anti-obesity Market in Europe (country-wise), till 2035 (USD Billion)
- Table 26.74 Anti-obesity Market in Asia-Pacific, till 2035 (USD Billion)
- Table 26.75 Anti-obesity Market in Asia-Pacific (country-wise), till 2035 (USD Billion)
- Table 26.76 Anti-obesity Market in Latin America, till 2035 (USD Billion)
- Table 26.77 Anti-obesity Market in Latin America (country-wise), till 2035 (USD Billion)
- Table 26.78 Contrave / Mysimba (Naltrexone, Bupropion) Sales Forecast, till 2035 (USD Billion)
- Table 26.79 Feisumei (Beinaglutide) Sales Forecast, till 2035 (USD Billion)
- Table 26.80 Imcivree (Setmelanotide) Sales Forecast, till 2035 (USD Billion)
- Table 26.81 LOMAIRA (Phentermine Hydrochloride) Sales Forecast, till 2035 (USD Billion)
- Table 26.82 QSYMIA (Phentermine and Topiramate) Sales Forecast, till 2035 (USD Billion)
- Table 26.83 Saxenda (Liraglutide) Sales Forecast, till 2035 (USD Billion)
- Table 26.84 Wegovy / Ozempic (Semaglutide) Sales Forecast, till 2035 (USD Billion)
- Table 26.85 Zepbound / Mounjaro (Tirzepatide) Sales Forecast, till 2035 (USD Billion)
- Table 26.86 BI 456906 (Survodutide) Sales Forecast, till 2035 (USD Billion)
- Table 26.87 CagriSema (Cagrilintide and Semaglutide) Sales Forecast, till 2035 (USD Billion)
- Table 26.88 HM11260C (Efpeglenatide) Sales Forecast, till 2035 (USD Billion)
- Table 26.89 HRS-9531 Sales Forecast, till 2035 (USD Billion)
- Table 26.90 IBI362 (Mazdutide) Sales Forecast, till 2035 (USD Billion)
- Table 26.91 LM-008 Sales Forecast, till 2035 (USD Billion)
- Table 26.92 LY3437943 (Retatrutide) Sales Forecast, till 2035 (USD Billion)
- Table 26.93 LY3502970 (Orforglipron) Sales Forecast, till 2035 (USD Billion)
- Table 26.94 TG103 Sales Forecast, till 2035 (USD Billion)
- Table 26.95 Semaglutide 7.2 mg (Subcutaneous) Sales Forecast, till 2035 (USD Billion)
- Table 26.96 Semaglutide (Oral) Sales Forecast, till 2035 (USD Billion)
- Table 26.97 XW003 Sales Forecast, till 2035 (USD Billion)
- Table 26.98 Anti-obesity Drugs Market: Distribution by Key Players, 2020 (USD Billion)
- Table 26.99 Anti-obesity Drugs Market: Distribution by Key Players, Current Year (USD Billion)
- Table 26.100 Anti-obesity Drugs Market: Distribution by Key Players, 2035 (USD Billion)
List of Figures
- Figure 2.1 Research Methodology: Project Methodology
- Figure 2.2 Research Methodology: Data Sources for Secondary Research
- Figure 2.3 Research Methodology: Robust Quality Control
- Figure 3.1 Market Dynamics: Forecast Methodology
- Figure 3.2 Market Dynamics: Market Assessment Framework
- Figure 4.1 Lessons Learnt from Past Recessions
- Figure 6.1 Health Risks Linked with Long-term Obesity
- Figure 6.2 Currently Approved Anti-Obesity Drug Classes
- Figure 7.1 Anti-Obesity Drugs: Distribution by Status of Development
- Figure 7.2 Anti-Obesity Drugs: Distribution by Type of Molecule
- Figure 7.3 Anti-Obesity Drugs: Distribution by Mechanism of Action
- Figure 7.4 Anti-Obesity Drugs: Distribution by Type of Agonist
- Figure 7.5 Anti-Obesity Drugs: Distribution by Route of Administration
- Figure 7.6 Anti-Obesity Drugs: Distribution by Dosage Frequency
- Figure 7.7 Anti-Obesity Drugs: Distribution by Type of Therapy
- Figure 7.8 Anti-Obesity Drug Developers: Distribution by Year of Establishment
- Figure 7.9 Anti-Obesity Drug Developers: Distribution by Company Size
- Figure 7.10 Anti-Obesity Drug Developers: Distribution by Location of Headquarters
- Figure 7.11 Anti-Obesity Drug Developers: Distribution by Headquarters (Country) and Status of Development
- Figure 7.12 Most Active Developers: Distribution by Number of Drug Candidates
- Figure 8.1 Eli Lilly: Annual Revenues (USD Billion)
- Figure 8.2 Pfizer: Annual Revenues (USD Billion)
- Figure 8.3 Regeneron: Annual Revenues (USD Billion)
- Figure 9.1 AstraZeneca: Annual Revenues (USD Billion)
- Figure 9.2 Novo Nordisk: Annual Revenues (DKK Billion)
- Figure 9.3 Roche: Annual Revenues (CHF Billion)
- Figure 10.1 Hanmi Pharmaceuticals: Annual Revenues (KRW Billion)
- Figure 10.2 Jiangsu Hengrui Pharmaceuticals: Annual Revenues (CNY Billion)
- Figure 11.1 Big Pharma Initiatives: Distribution of Big Pharma Players by Number of Initiatives
- Figure 11.2 Big Pharma Initiatives: Distribution by Year of Initiative
- Figure 11.3 Big Pharma Initiatives: Distribution by Big Pharma Players by Year and Number of Initiatives
- Figure 11.4 Big Pharma Initiatives: Distribution by Type of Initiative
- Figure 11.5 Big Pharma Initiatives: Distribution by Year and Type of Initiative
- Figure 11.6 Big Pharma Initiatives: Distribution by Big Pharma Players and Type of Initiative
- Figure 11.7 Big Pharma Initiatives: Distribution by Type of Partnership
- Figure 11.8 Big Pharma Initiatives: Distribution by Type of Expansion
- Figure 11.9 Big Pharma Initiatives: Distribution of Big Pharma Players by Region and Number of Initiatives
- Figure 11.10 Benchmarking of Big Pharma Players
- Figure 12.1 Anti-Obesity Drugs: Market Drivers
- Figure 12.2 Anti-Obesity Drugs: Market Restraints
- Figure 12.3 Anti-Obesity Drugs: Market Opportunities
- Figure 12.4 Anti-Obesity Drugs: Market Challenges
- Figure 13.1 Global Anti-Obesity Drugs Market, Historical Trends (Since 2019) and Forecasted Estimates (till 2035)
- Figure 13.2 Global Anti-obesity Drugs Market, till 2035 (USD Billion): Conservative Scenario
- Figure 13.3 Global Anti-obesity Drugs Market, till 2035 (USD Billion): Optimistic Scenario
- Figure 14.1 Anti-obesity Drugs Market: Distribution by Type of Molecule
- Figure 14.2 Anti-obesity Market for Biologics, till 2035 (USD Billion)
- Figure 14.3 Anti-obesity Market for Small Molecules, till 2035 (USD Billion)
- Figure 15.1 Anti-obesity Drugs Market: Distribution by Type of Drug
- Figure 15.2 Anti-obesity Market for Prescription Drugs, till 2035 (USD Billion)
- Figure 15.3 Anti-obesity Market for OTC Drugs, till 2035 (USD Billion)
- Figure 16.1 Anti-obesity Drugs Market: Distribution by Active Compound Used
- Figure 16.2 Anti-obesity Market for Tirzepatide, till 2035 (USD Billion)
- Figure 16.3 Anti-obesity Market for Semaglutide, till 2035 (USD Billion)
- Figure 16.4 Anti-obesity Market for Retatrutide, till 2035 (USD Billion)
- Figure 16.5 Anti-obesity Market for Survodutide, till 2035 (USD Billion)
- Figure 16.6 Anti-obesity Market for Cagrilintide / Semaglutide, till 2035 (USD Billion)
- Figure 16.7 Anti-obesity Market for Orforglipron, till 2035 (USD Billion)
- Figure 16.8 Anti-obesity Market for Liraglutide, till 2035 (USD Billion)
- Figure 16.9 Anti-obesity Market for Other Compounds, till 2035 (USD Billion)
- Figure 17.1 Anti-obesity Drugs Market: Distribution by Mechanism of Action
- Figure 17.2 Anti-obesity Market for GLP-1 Agonist / GIP Agonist, till 2035 (USD Billion)
- Figure 17.3 Anti-obesity Market for GLP-1 Agonist, till 2035 (USD Billion)
- Figure 17.4 Anti-obesity Market for GLP-1 Agonist / GCGR Agonist, till 2035 (USD Billion)
- Figure 17.5 Anti-obesity Market for GLP-1 / GCGR / GIP Agonist, till 2035 (USD Billion)
- Figure 17.6 Anti-obesity Market for GLP-1 Agonist / Amylin Analogue, till 2035 (USD Billion)
- Figure 17.7 Anti-obesity Market for Other Mechanisms of Action, till 2035 (USD Billion)
- Figure 18.1 Anti-obesity Market: Distribution by Type of Agonist
- Figure 18.2 Anti-obesity Market for Single-Agonist, till 2035 (USD Billion)
- Figure 18.3 Anti-obesity Market for Dual-Agonist, till 2035 (USD Billion)
- Figure 18.4 Anti-obesity Market for Tri-Agonist, till 2035 (USD Billion)
- Figure 19.1 Anti-obesity Drugs Market: Distribution by Action Pathway
- Figure 19.2 Anti-obesity Market for Centrally Acting Drugs, till 2035 (USD Billion)
- Figure 19.3 Anti-obesity Market for Peripherally Acting Drugs, till 2035 (USD Billion)
- Figure 19.4 Anti-obesity Market for Centrally and Peripherally Acting Drugs, till 2035 (USD Billion)
- Figure 20.1 Anti-obesity Drugs Market: Distribution by Route of Administration
- Figure 20.2 Anti-obesity Market for Oral Administration, till 2035 (USD Billion)
- Figure 20.3 Anti-obesity Market for Parenteral Administration, till 2035 (USD Billion)
- Figure 21.1 Anti-obesity Drugs Market: Distribution by Distribution Channel
- Figure 21.2 Anti-obesity Market for Hospital Pharmacy, till 2035 (USD Billion)
- Figure 21.3 Anti-obesity Market for Retail and Online Pharmacy, till 2035 (USD Billion)
- Figure 22.1 Anti-obesity Drugs Market: Distribution by Key Geographical Regions
- Figure 22.2 Anti-obesity Market in North America, till 2035 (USD Billion)
- Figure 22.3 Anti-obesity Market in North America (country-wise), till 2035 (USD Billion)
- Figure 22.4 Anti-obesity Market in Europe, till 2035 (USD Billion)
- Figure 22.5 Anti-obesity Market in Europe (country-wise), till 2035 (USD Billion)
- Figure 22.6 Anti-obesity Market in Asia-Pacific, till 2035 (USD Billion)
- Figure 22.7 Anti-obesity Market in Asia-Pacific (country-wise), till 2035 (USD Billion)
- Figure 22.8 Anti-obesity Market in Latin America, till 2035 (USD Billion)
- Figure 22.9 Anti-obesity Market in Latin America (country-wise), till 2035 (USD Billion)
- Figure 23.1 Contrave / Mysimba (Naltrexone, Bupropion) Sales Forecast, till 2035 (USD Billion)
- Figure 23.2 Feisumei (Beinaglutide) Sales Forecast, till 2035 (USD Billion)
- Figure 23.3 Imcivree (Setmelanotide) Sales Forecast, till 2035 (USD Billion)
- Figure 23.4 LOMAIRA (Phentermine Hydrochloride) Sales Forecast, till 2035 (USD Billion)
- Figure 23.5 QSYMIA (Phentermine and Topiramate) Sales Forecast, till 2035 (USD Billion)
- Figure 23.6 Saxenda (Liraglutide) Sales Forecast, till 2035 (USD Billion)
- Figure 23.7 Wegovy / Ozempic (Semaglutide) Sales Forecast, till 2035 (USD Billion)
- Figure 23.8 Zepbound / Mounjaro (Tirzepatide) Sales Forecast, till 2035 (USD Billion)
- Figure 23.9 BI 456906 (Survodutide) Sales Forecast, till 2035 (USD Billion)
- Figure 23.10 CagriSema (Cagrilintide and Semaglutide) Sales Forecast, till 2035 (USD Billion)
- Figure 23.11 HM11260C (Efpeglenatide) Sales Forecast, till 2035 (USD Billion)
- Figure 23.12 HRS-9531 Sales Forecast, till 2035 (USD Billion)
- Figure 23.13 IBI362 (Mazdutide) Sales Forecast, till 2035 (USD Billion)
- Figure 23.14 LM-008 Sales Forecast, till 2035 (USD Billion)
- Figure 23.15 LY3437943 (Retatrutide) Sales Forecast, till 2035 (USD Billion)
- Figure 23.16 LY3502970 (Orforglipron) Sales Forecast, till 2035 (USD Billion)
- Figure 23.17 TG103 Sales Forecast, till 2035 (USD Billion)
- Figure 23.18 Semaglutide 7.2 mg (Subcutaneous) Sales Forecast, till 2035 (USD Billion)
- Figure 23.19 Semaglutide (Oral) Sales Forecast, till 2035 (USD Billion)
- Figure 23.20 XW003 Sales Forecast, till 2035 (USD Billion)
- Figure 24.1 Anti-obesity Drugs Market: Distribution by Key Players, 2020 (USD Billion)
- Figure 24.2 Anti-obesity Drugs Market: Distribution by Key Players, Current Year (USD Billion)
- Figure 24.3 Anti-obesity Drugs Market: Distribution by Key Players, 2035 (USD Billion)

 抗肥胖藥物市場:依產品類型、劑型、給藥途徑及最終用戶分類-2026-2032年全球市場預測
 抗肥胖藥物:市場佔有率分析、行業趨勢和統計數據以及成長預測(2026-2031 年)
 抗肥胖藥物市場:依作用機制、處方藥/非處方藥及地區分類。
 抗肥胖藥物市場分析及至2035年預測:類型、產品、服務、技術、組件、應用、劑型、最終用戶、設備、模式
 抗肥胖藥物市場規模、佔有率、趨勢及預測(依藥物類別、藥物類型、通路及地區分類,2026-2034年)
 抗肥胖藥物市場-全球產業規模、佔有率、趨勢、機會與預測:按作用機制、藥物類型、地區和競爭格局分類,2021-2031年
 抗肥胖藥物市場-2026-2031年預測
 抗肥胖藥的全球市場:治療類型·藥物類型·作用機制·給藥途徑·通路·各地區 (~2035年)
 2021 - 2031 年抗肥胖藥物市場規模及預測、全球及地區佔有率、趨勢及成長機會分析報告,涵蓋:按類型、藥物類別、應用、給藥途徑、配銷通路和地理分類
 抗肥胖藥物市場規模、佔有率、成長分析(按藥物類型、作用、劑量和地區分類)- 產業預測,2025 年至 2032 年