


|
市場調查報告書
商品編碼
1742156
通訊業者市場追蹤(2024 年第四季):年度資本支出持續低迷,低於 3,000 億美元Global Telco Market Tracker, 4Q24: Telco Revenues Edge Higher in 4Q24 as Annual Capex Stays Muted Below $300B |
|||||||
本報告提供了 140 家全球通訊網路營運商(電信營運商)的詳細財務和營運概況,追蹤了它們從 2011 年第一季到 2012 年第四季的業績。報告重點關注最近一個季度和 2024 年全年的業績,涵蓋收入、勞動力、資本支出、營運支出和獲利數據。
視覺
主要調查結果:
- 2024年第四季,營運商市場營收年增1.7%,達到4,547億美元,全年營收持平於1.78兆美元。 2024年的成長主要由Airtel(+9.1%)、STC(沙烏地電信)(+4.9%)和America Movil(+4.0%)引領。同時,沃達豐(-11.1%)和Orange(-6.1%)的收入大幅下滑。
- 2024年全年資本支出較去年同期下降6.2%至2,954億美元,為至少2011年以來的最低水平,甚至低於受新冠疫情影響的2020年(2,968億美元)。資本支出削減幅度最大的是Reliance Jio(-33.2%)、KDDI(-19.9%)和America Movil(-19.0%),而BSNL和Telstra則增加了資本支出。
- 預計2024年人力成本將年減2.6%至2,583億美元,業者員工總數將降至441萬人。人工成本佔不包括折舊和攤提(D&A)的營運費用的21.9%。
- 儘管面臨成本壓力,但預計2024年的獲利能力將較上一年略有改善,息稅前利潤(EBIT)為15.3%,息稅折舊攤銷前利潤(EBITDA)為33.7%,顯示營運效率保持穩定。
- 按地區劃分,美洲地區在2024年仍將是最大的貢獻地區,其收入(佔全球總收入的37.7%)和資本支出(佔36.1%)均佔比最大。同時,歐洲的資本支出與收入比率(資本密集度)最高,為18.6%。
對象經營者:
|
|
對象地區:
|
|
目錄
第1章 報告亮點
第2章 摘要
第3章 市場概述
第4章 分析
第5章 主要統計:~2024年第四季
第6章 勞動統計
第7章 業者排行榜
第8章 企業的詳細調查
第9章 企業基準
第10章 各國明細
第11章 企業·各國明細
第12章 各地區的明細
第13章 原始數據
第14章 用戶數·流量
第15章 匯率
第16章 調查手法·調查範圍
第17章 關於本報告
This report delivers a detailed financial and operational snapshot of 140 telecommunications network operators (telcos) worldwide, tracking performance from 1Q11 through 4Q24. It captures revenue, labor, capex, opex, and profitability data with a focus on the most recent quarter and full-year 2024 results.
VISUALS
Key findings:
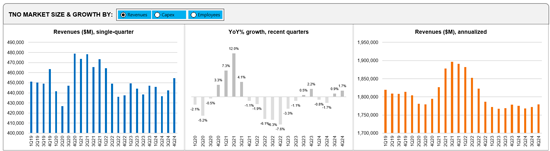
- Revenue rose 1.7% YoY in 4Q24 to $454.7 billion (B), but full-year topline was flat at $1.78 trillion (T). Airtel (9.1%), STC (Saudi Telecom) (4.9%), and America Movil (4.0%) led growth in 2024, while Vodafone (-11.1%) and Orange (-6.1%) declined sharply.
- Capex dropped 6.2% YoY to $295.4B for full-year 2024, the lowest level since at least 2011, dipping below even the COVID-hit 2020 levels ($296.8B). Reliance Jio (-33.2%), KDDI (-19.9%), America Movil (-19.0%) posted the largest cuts in 2024, while BSNL and Telstra ramped up spending.
- Labor costs fell 2.6% YoY to $258.3B in 2024, with telco headcount shrinking to 4.41 million. Labor represented 21.9% of opex (excluding D&A) for the full-year 2024.
- Profitability margins inched higher in 2024 from a year ago, with EBIT at 15.3% and EBITDA at 33.7%, suggesting stable operational efficiency despite cost pressures.
- Regionally, the Americas remained the top contributor in 2024 to both revenue (37.7% global share) and capex (36.1% global share), while Europe recorded the highest capital intensity at 18.6%.
Important note: We have made some significant enhancements to our telco market review report in 1Q24. The changes are designed to provide a more insightful and user-friendly experience:
- 'Market Snapshot' Tab: This tab now features an interactive dashboard view of the telco market, allowing users to interact with and analyze market data more effectively. Additionally, users can export the dashboard to PDF for convenient sharing and reference.
- Two distinct sections have been created from the previous 'Company Deepdive & Benchmarking' section for greater clarity and functionality:
1.'Company Drilldown': Provides a comprehensive analysis of a selected company from the full set of 140 telcos. It covers various metrics including revenue, capex, employee counts, costs, profitability, cash and debt levels, and key ratios.
2.'Company Benchmarking': Focuses on a sample of 79 telcos, representing approximately 82% of the global market. This section allows users to select and compare up to 5 telcos across multiple metrics such as labor costs, opex, EBIT, as well as revenues, capex, and employee counts. The sample includes operators from all regions and of varying sizes.
Both new sections also feature the capability to export graphics to PDF, enhancing the flexibility and utility of the data presented.
Operator coverage:
|
|
Regional coverage:
|
|
Table of Contents
1. Report Highlights
2. Summary
3. Market snapshot
4. Analysis
5. Key stats through 4Q24
6. Labor stats
7. Operator rankings
8. Company drilldown
9. Company benchmarking
10. Country breakouts
11. Country breakouts by company
12. Regional breakouts
13. Raw Data
14. Subs & traffic
15. Exchange rates
16. Methodology & Scope
17. About
List of Figures and Charts
- 1. TNO market size & growth by: Revenues, Capex, Employees - 1Q19-4Q24
- 2. Regional trends by: Revenues, Capex - 1Q19-4Q24
- 3. Opex & Cost trends
- 4. Labor cost trends: 1Q20-4Q24
- 5. Profitability margin trends: 1Q20-4Q24
- 6. Spending (opex, labor costs, capex): annual and quarterly trend
- 7. Key ratios: annual and quarterly trend
- 8. Workforce & productivity trends: 1Q14-4Q24
- 9. Operator rankings by revenue and capex: latest single-quarter and annualized periods
- 10. Top 20 TNOs by capital intensity: latest single-quarter and annualized periods
- 11. Top 20 TNOs by employee base: latest single-quarter
- 12. TNOs: YoY growth in single quarter revenues
- 13. TNOs: Annualized capital intensity, 1Q16-4Q24
- 14. TNOs: Revenue and RPE, annualized 1Q16-4Q24
- 15. TNOs: Capex and capital intensity (annualized), 1Q16-4Q24
- 16. TNOs: Total headcount trends, 1Q16-4Q24
- 17. TNOs: Revenue and RPE trends, 2011-24
- 18. TNOs: Capex and capital intensity, 2011-24 ($ Mn)
- 19. TNOs: Capex and capital intensity, 1Q16-4Q24 ($ Mn)
- 20. TNOs: Revenue and RPE trends, 1Q16-4Q24
- 21. TNOs by total opex, 4Q24
- 22. TNOs by labor costs, 4Q24
- 23. TNOs: Software as % of total capex
- 24. TNOs: Software & spectrum spend
- 25. TNOs: Total M&A, spectrum and capex (excl. spectrum)
- 26. TNOs by total debt: 2011-24
- 27. TNOs by total net debt: 2011-24
- 28. TNOs by long term debt: 2011-24
- 29. TNOs by short term debt: 2011-24
- 30. TNOs by total cash and short term investments ($M): 2011-24
 2025 年至 2033 年資料貨幣化市場規模、佔有率、趨勢及預測(依方法、組織規模、最終用途及地區分類)
 生命科學公司數據收益解決方案的全球市場醫療保健提供者數據收益解決方案的全球市場醫療數據收益市場規模、佔有率和趨勢分析報告:按方法、組織規模、最終用途、地區和細分市場預測,2025 年至 2033 年日本數據貨幣化市場報告(按方法、組織規模、最終用途和地區)2025-2033資料收益市場分析及預測(至 2034 年):類型、產品、服務、技術、組件、應用、最終用戶、部署、解決方案、功能
 資料貨幣化市場規模、佔有率、成長分析(按組件、資料類型、業務功能、部署類型、組織規模、垂直產業和地區)-2025 年至 2032 年產業預測
 資料收益全球市場規模、佔有率、趨勢分析報告:按組織規模、方法、產業、組成部分、地區、展望與預測,2024年至2031年
 2025年生命科學公司資料收益解決方案全球市場報告
 資料收益:市場佔有率分析、產業趨勢與統計、成長預測(2025-2030 年)