


 |
市場調查報告書
商品編碼
2157125
生質能發電:市場佔有率分析、產業趨勢與統計、成長預測(2026-2031 年)Biomass Power - Market Share Analysis, Industry Trends & Statistics, Growth Forecasts (2026 - 2031) |
||||||

※ 本網頁內容可能與最新版本有所差異。詳細情況請與我們聯繫。
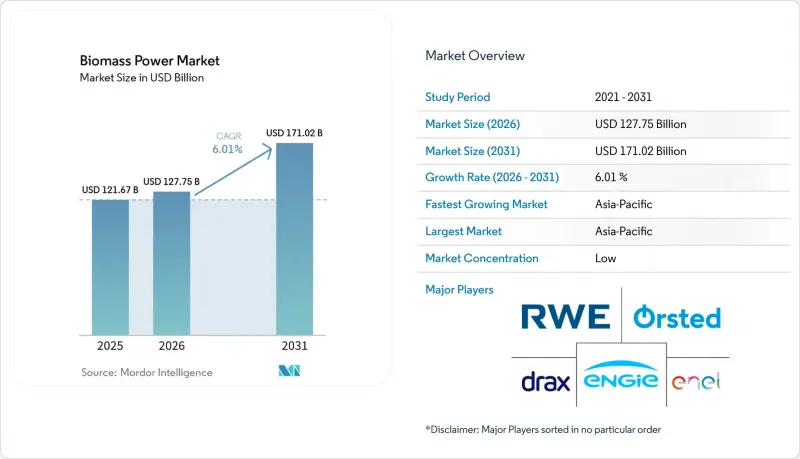
根據 Mordor Intelligence 預測,生質能發電市場規模將從 2025 年的 1,216.7 億美元成長到 2026 年的 1,277.5 億美元,然後在 2031 年達到 1,710.2 億美元,2026 年至 2031 年的複合成長率為 6.01%。
全球生質能發電市場趨勢與洞察
可調節的可再生能源,以實現電網柔軟性
生質能市場的優勢在於能夠靈活調整發電計劃,不受天氣條件的影響。可再生能源協會2025年的研究發現,生質能可在英國提供高達5.5吉瓦的可靠發電容量,相當於該國90%的運作中核能發電容量。研究也顯示,在截至2024年3月的一年中,風力發電量曾30次低於額定容量的11%,且持續時間超過6小時。確保生質能發電容量預計在2028/29年度為英國的容量市場成本降低9億英鎊。奧地利、丹麥、芬蘭、瑞典和德國正在將柔軟性的生質能源納入其國家脫碳路線圖,以取代可調整的燃煤發電容量。這些燃煤發電容量將在獲得充足的儲能設施和其他可靠藍圖容量之前逐步淘汰。
關於廢棄物管理和循環經濟的法規
由於廢棄物法規的訂定,城市固體廢棄物、農業和工業廢水以及牲畜糞便作為能源的價值日益凸顯。歐洲生物燃氣協會的報告顯示,2026年生物甲烷投資承諾金額將達到360億歐元,超過前一年的280億歐元。這些承諾旨在2030年實現90億立方公尺的年產能。有機廢棄物不僅可以作為廢棄物處理方案,還可以作為燃料來源。與使用專用能源作物或未開發生質能的專案相比,這可以降低厭氧消化專案的原料成本。因此,當廢棄物政策、本地收集系統和能源需求相符時,生質能發電市場蘊藏著巨大的機會。
與原料永續性衝突的土地利用
原料和土地利用的競爭性認證仍然是生質能發電市場面臨的重大限制。世界資源研究所 (WRI) 的一項研究表明,能源、航空燃料和工業化學品領域對生質能的需求可能超過永續供應水準。研究也指出,如果專門種植能源作物取代自然生態系統,可能帶來間接的土地利用變化風險。歐盟委員會聯合研究中心發布了一份關於歐盟能源、食品和材料應用領域對生質能競爭需求的報告。報告強調,在能源利用之前,管治考慮高價值的梯級利用至關重要。開發商越來越需要可追溯的價值鍊和權威認證,以確保長期銷售合約和資金籌措。
細分市場分析
到2025年,固體生質能將佔生質能發電市場佔有率的67.5%。這一地位得益於成熟的木質顆粒供應鏈、專用燃燒設施以及從北美和波羅的海國家到歐洲和亞洲的貿易路線。液體生質能仍主要集中在農業和工業領域。 2024年,巴西的甘蔗渣為該國的生質能源發電能力做出了貢獻。固體生質能對於燃料規格可預測的大型發電廠仍然至關重要。其長期地位將取決於永續的林業實踐、認證以及殘餘物的供應。
預計到2031年,沼氣將以9.3%的複合年成長率成長。生質能發電市場受益於那些擁有城市垃圾、牲畜糞便以及農業和工業廢水等本地原料的地區。到2026年中期,歐洲的生物甲烷年產能將達到82億立方公尺。據報道,在360億歐元的投資承諾的支持下,這一總量比上一年增加了10億多立方米。這些原料可以避免與能源作物相關的土地利用問題。這使得基於廢棄物的項目更符合新興的永續性框架。
到2025年,燃燒系統將佔銷售額的62.3%。直燃式鍋爐和迴圈式流體化床系統仍然是公共產業和工業設施中成熟的選擇。燃燒系統能夠大規模利用固態燃料。隨著燃煤發電廠退役計畫的推進,氣化和混燒技術日益受到關注。這些技術使得在由燃煤發電廠改造而成的設施中可以重複利用渦輪機和併網設備。掩埋氣、生質能熱電聯產(CHP)和其他轉化途徑可以滿足區域廢物流和特定的能源需求。
預計到2031年,厭氧消化將以8.1%的複合年成長率成長。在那些因為廢棄物處理義務和甲烷排放法規而預期原料供應穩定的地區,生質能發電市場可以充分利用這項技術。一項發表於2025年的同行評審研究評估了東南亞農業廢棄物的厭氧消化。基於經濟模型,該研究將印尼、馬來西亞和越南確定為優先部署地區。厭氧消化專案除了可以收取廢棄物處理費外,還可以透過售電獲得收入,從而減少對單一收入來源的依賴,並提高專案對基礎設施投資者的吸引力。
區域分析
預計到2025年,亞太地區將佔生質能發電市場佔有率的39.2%,並在2031年之前以7.9%的複合年成長率成長。中國的生質能發電裝置容量為47.4吉瓦。根據提供的調查草案,新增裝置容量從2021年的2.3吉瓦放緩至2025年的200兆瓦。日本將於2025年運作兩座50兆瓦的電廠,並計畫進一步擴建。印度的生質能源裝置容量在2025會計年度達到11.58吉瓦。印度預計在2025會計年度還將擁有2.95億噸的生質能盈餘,為其提供了巨大的潛在資源基礎。
在歐洲,生質能市場正經歷重組,從獨立生質能發電轉向熱電聯產(CHP)、生物甲烷和碳捕獲。法國於2025年12月通過的DDADUE法案將歐盟RED III框架的部分內容納入法國國內法。該法案將從2026年中期起停止對某些僅用於發電的生質能設施的公共支持。波蘭正透過在扎布熱和琴斯托霍瓦改造為熱電聯產設施以及在波蘭涅茨擴大生質物流設施來吸引投資。 2025年的學術評估報告指出,生質能源將佔歐洲能源供應總量的14%,佔可再生能源結構的60%。這種轉型趨勢傾向於那些不僅提供電力,還能提供熱能、廢棄物管理或碳減排的專案。
在北美和南美,林業殘餘物和甘蔗渣等資源支撐著生質能發電市場。根據所提供的研究草案,加拿大利用林業殘餘物發電的裝置容量超過2000兆瓦。截至2024年,巴西的生質能源發電裝置容量為18吉瓦,主要來自甘蔗渣汽電共生。在美國,人們對二氧化碳捕集與儲存(CCS)技術的生質能源越來越感興趣。在西非,位於象牙海岸共和國的46兆瓦「Biovea」計畫二期工程於2026年7月投入商業營運。該設施以棕櫚葉莖和殼為燃料,預計每年發電3.48億度。所提供的研究草案將摩洛哥、南非和埃及列為潛在的開發地點。
其他好處:
- Excel格式的市場預測(ME)表
- 3個月的分析師支持
目錄
第1章:引言
- 研究假設和市場定義
- 調查範圍
第2章:調查方法
第3章執行摘要
第4章 市場狀況
- 市場概覽
- 市場促進因素
- 可調節的可再生能源,以實現電網柔軟性
- 關於廢棄物管理和循環經濟的法規
- 工業汽電共生脫碳
- 可再生能源組合標準和淨零能耗獎勵
- 透過生質混燒改造燃煤發電廠
- 將農業區低價值殘餘物貨幣化
- 市場限制因素
- 與原料永續性衝突的土地利用
- 季節性因素、分散的原料物流
- 太陽能、風能和儲能之間的成本競爭
- 碳權政策及依賴性
- 供應鏈分析
- 波特五力分析
- 科技趨勢
- 監理情勢
- 投資分析
第5章 市場規模與成長預測
- 按原料
- 固體生質能
- 沼氣
- 液態生質能
- 透過技術
- 燃燒
- 氣化
- 厭氧消化
- 混合烘焙
- 熱電聯產(CHP)
- 垃圾掩埋沼氣氣發電
- 其他技術
- 按產能
- 小於1兆瓦
- 1~10 MW
- 10~50 MW
- 50~100 MW
- 100兆瓦或以上
- 透過使用
- 住宅
- 商業的
- 產業
- 大規模發電
- 按地區
- 北美洲
- 美國
- 加拿大
- 墨西哥
- 歐洲
- 德國
- 法國
- 義大利
- 西班牙
- 英國
- 波蘭
- 俄羅斯
- 其他歐洲國家
- 亞太地區
- 中國
- 印度
- 日本
- 韓國
- 澳洲
- 印尼
- 越南
- 泰國
- 其他亞太國家
- 南美洲
- 巴西
- 阿根廷
- 智利
- 其他南美國家
- 中東和非洲
- 沙烏地阿拉伯
- 阿拉伯聯合大公國
- 埃及
- 南非
- 摩洛哥
- 其他中東和非洲國家
- 北美洲
第6章 競爭情勢
- 市場集中度
- 策略趨勢
- 市佔率分析
- 公司簡介
- Drax Group plc
- Orsted A/S
- ENGIE SA
- Enel SpA
- RWE AG
- EDF
- Vattenfall AB
- E.ON SE
- Veolia Environnement SA
- SUEZ
- Ameresco, Inc.
- Babcock & Wilcox Enterprises, Inc.
- Mitsubishi Heavy Industries, Ltd.
- Valmet Oyj
- ANDRITZ AG
- General Electric Company
- Siemens Energy AG
- Hitachi Zosen Corporation
- John Wood Group PLC
- Thermax Limited
- Sumitomo Heavy Industries, Ltd.
第7章 市場機會與未來展望
According to Mordor Intelligence, the biomass power market size is expected to grow from USD 121.67 billion in 2025 to USD 127.75 billion in 2026 and is forecast to reach USD 171.02 billion by 2031 at 6.01% CAGR over 2026-2031.
Global Biomass Power Market Trends and Insights
Dispatchable Renewable Power for Grid Flexibility
The Biomass power market benefits from generation that can be scheduled regardless of weather conditions. A 2025 study for the Renewable Energy Association found that biomass could provide up to 5.5 GW of firm capacity in Great Britain. This was equivalent to 90% of the country's operational nuclear capacity. The study also found that wind output fell below 11% of rated capacity for periods of 6 hours or longer on 30 occasions in the year to March 2024. Keeping biomass capacity available could reduce the United Kingdom Capacity Market costs by GBP 900 million in 2028/29. Austria, Denmark, Finland, Sweden, and Germany have included flexible bioenergy in national decarbonization pathways to replace retiring dispatchable coal capacity before enough storage and other firm capacity is available.
Waste Management and Circular Economy Mandates
Waste rules are making municipal waste, agro-industrial effluent, and livestock manure more valuable as energy feedstocks. The European Biogas Association reported EUR 36 billion in biomethane investment commitments in 2026, compared with EUR 28 billion in the prior year. These commitments target 9 billion cubic meters of annual production capacity by 2030. Organic waste can produce both a disposal solution and a fuel source. This can reduce feedstock costs for anaerobic digestion projects compared with projects using dedicated energy crops or virgin biomass. The Biomass power market, therefore, has an opportunity where waste policy, local collection systems, and energy demand are aligned.
Feedstock Sustainability and Competing Land Uses
Feedstock certification and competition for land remain persistent constraints for the Biomass power market. The World Resources Institute found that biomass demand across energy, aviation fuel, and industrial chemicals could exceed sustainable supply. It also found that dedicated energy crops can create indirect land-use-change risk when they displace natural ecosystems. The European Commission's Joint Research Centre documented competing demands from energy, food, and material uses of biomass in the European Union. Its report emphasized governance that gives priority to higher-value cascading uses before energy use. Developers increasingly need traceable supply chains and recognized certification to secure long-term offtake and financing.
Other drivers and restraints analyzed in the detailed report include:
- Industrial CHP Decarbonization
- Coal Plant Repurposing Through Biomass Co-Firing
- Solar, Wind, and Storage Cost Competition
For complete list of drivers and restraints, kindly check the Table Of Contents.
Segment Analysis
Solid biomass held 67.5% of Biomass power market share in 2025. Its position reflects established wood pellet supply chains, dedicated combustion assets, and trading links from North America and the Baltics to Europe and Asia. Liquid biomass remains concentrated in agro-industrial settings. Brazil's sugarcane bagasse contributed to the country's bioenergy capacity base in 2024. Solid biomass remains important for large plants with predictable fuel specifications. Its long-term position will depend on sustainable forestry practices, certification, and the availability of residues.
Biogas is forecast to grow at a 9.3% CAGR through 2031. The Biomass power market benefits where municipal waste, livestock manure, and agro-industrial effluent can be used as local feedstocks. European biomethane capacity reached 8.2 billion cubic meters per year by mid-2026. The reported total was more than 1 billion cubic meters higher than a year earlier, supported by EUR 36 billion in investment commitments. These feedstocks can avoid the land-use concerns associated with dedicated energy crops. This gives waste-based projects a stronger fit with emerging sustainability frameworks.
Combustion held 62.3% revenue share in 2025. Direct-fired boilers and circulating fluidized bed systems remain established options for utility and industrial facilities. Combustion systems can use solid fuels at large scale. Gasification and co-firing are receiving attention as coal retirement schedules advance. They can reuse turbines and grid interconnections at converted coal locations. Landfill gas, biomass CHP, and other conversion routes serve localized waste streams and specific energy needs.
Anaerobic digestion is forecast to grow at an 8.1% CAGR through 2031. The Biomass power market can use this technology where waste disposal obligations and methane control policies create steady feedstock availability. A 2025 peer-reviewed study assessed agricultural-residue anaerobic digestion in Southeast Asia. It identified Indonesia, Malaysia, and Vietnam as priority locations under its modeled economics. Anaerobic digestion projects can earn waste tipping fees as well as revenue from electricity sales. This reduces reliance on a single revenue source. It can also make the projects more attractive to infrastructure investors.
Complete Report Scope:
- By Feedstock
- Solid Biomass
- Biogas
- Liquid Biomass
- By Technology
- Combustion
- Gasification
- Anaerobic Digestion
- Co-firing
- Combined Heat and Power (CHP)
- Landfill Gas-to-Power
- Other Technologies
- By Capacity
- Below 1 MW
- 1-10 MW
- 10-50 MW
- 50-100 MW
- Above 100 MW
- By Application
- Residential
- Commercial
- Industrial
- Utility-Scale Power Generation
- By Geography
- North America
- United States
- Canada
- Mexico
- Europe
- Germany
- France
- Italy
- Spain
- United Kingdom
- Poland
- Russia
- Rest of Europe
- Asia-Pacific
- China
- India
- Japan
- South Korea
- Australia
- Indonesia
- Vietnam
- Thailand
- Rest of Asia-Pacific
- South America
- Brazil
- Argentina
- Chile
- Rest of South America
- Middle East and Africa
- Saudi Arabia
- United Arab Emirates
- Egypt
- South Africa
- Morocco
- Rest of Middle East and Africa
- North America
Geography Analysis
Asia-Pacific held 39.2% of Biomass power market share in 2025 and is forecast to grow at a 7.9% CAGR through 2031. China's installed biopower capacity was 47.4 GW. New additions slowed to 200 MW in 2025 from 2.3 GW in 2021, according to the supplied research draft. Japan commissioned 2 plants of 50 MW in 2025 and has additional capacity planned. India's installed bioenergy capacity reached 11.58 GW in fiscal 2025. India also had an estimated 295 million metric tons of biomass surplus in fiscal 2025, supporting a large potential resource base.
Europe is restructuring its Biomass power market toward CHP, biomethane, and carbon capture rather than standalone biomass electricity. France's December 2025 DDADUE legislation transposed parts of the European Union RED III framework. The legislation withdraws public support for certain electricity-only biomass installations from mid-2026. Poland is drawing investment through CHP conversions in Zabrze and Czestochowa and through biomass logistics expansion at Polaniec. A 2025 academic review reported that bioenergy represented 14% of Europe's total energy supply and 60% of its renewable energy mix. The shift favors projects that deliver heat, waste management, or carbon benefits alongside power.
North and South America give the Biomass power market resource bases in forest residues and sugarcane bagasse. Canada has more than 2,000 MW of forest-residue biomass power, according to the supplied research draft. Brazil had 18 GW of bioenergy capacity, mainly from sugarcane bagasse cogeneration, in 2024. Interest in bioenergy with carbon capture and storage is growing in the United States. In West Africa, Unit 2 of Cote d'Ivoire's 46 MW Biovea project began commercial operation in July 2026. The facility uses palm petioles and nutshells and is expected to generate 348 million kWh annually. Morocco, South Africa, and Egypt are identified in the supplied research draft as potential next locations for development.
- Drax Group plc
- Orsted A/S
- ENGIE SA
- Enel SpA
- RWE AG
- EDF
- Vattenfall AB
- E.ON SE
- Veolia Environnement S.A.
- SUEZ
- Ameresco, Inc.
- Babcock & Wilcox Enterprises, Inc.
- Mitsubishi Heavy Industries, Ltd.
- Valmet Oyj
- ANDRITZ AG
- General Electric Company
- Siemens Energy AG
- Hitachi Zosen Corporation
- John Wood Group PLC
- Thermax Limited
- Sumitomo Heavy Industries, Ltd.
Additional Benefits:
- The market estimate (ME) sheet in Excel format
- 3 months of analyst support
TABLE OF CONTENTS
1 INTRODUCTION
- 1.1 Study Assumptions and Market Definition
- 1.2 Scope of the Study
2 RESEARCH METHODOLOGY
3 EXECUTIVE SUMMARY
4 MARKET LANDSCAPE
- 4.1 Market Overview
- 4.2 Market Drivers
- 4.2.1 Dispatchable Renewable Power for Grid Flexibility
- 4.2.2 Waste-Management and Circular-Economy Mandates
- 4.2.3 Industrial CHP Decarbonization
- 4.2.4 Renewable Portfolio Standards and Net-Zero Incentives
- 4.2.5 Coal-Plant Repurposing Through Biomass Co-Firing
- 4.2.6 Low-Value Residue Monetization in Agricultural Regions
- 4.3 Market Restraints
- 4.3.1 Feedstock Sustainability and Competing Land Uses
- 4.3.2 Seasonal, Distributed Feedstock Logistics
- 4.3.3 Solar, Wind and Storage Cost Competition
- 4.3.4 Policy and Carbon-Credit Dependence
- 4.4 Supply-Chain Analysis
- 4.5 Porter's Five Forces Analysis
- 4.5.1 Bargaining Power of Suppliers
- 4.5.2 Bargaining Power of Buyers
- 4.5.3 Threat of New Entrants
- 4.5.4 Threat of Substitutes
- 4.5.5 Competitive Rivalry
- 4.6 Technology Outlook
- 4.7 Regulatory Landscape
- 4.8 Investment Analysis
5 MARKET SIZE AND GROWTH FORECASTS
- 5.1 By Feedstock
- 5.1.1 Solid Biomass
- 5.1.2 Biogas
- 5.1.3 Liquid Biomass
- 5.2 By Technology
- 5.2.1 Combustion
- 5.2.2 Gasification
- 5.2.3 Anaerobic Digestion
- 5.2.4 Co-firing
- 5.2.5 Combined Heat and Power (CHP)
- 5.2.6 Landfill Gas-to-Power
- 5.2.7 Other Technologies
- 5.3 By Capacity
- 5.3.1 Below 1 MW
- 5.3.2 1-10 MW
- 5.3.3 10-50 MW
- 5.3.4 50-100 MW
- 5.3.5 Above 100 MW
- 5.4 By Application
- 5.4.1 Residential
- 5.4.2 Commercial
- 5.4.3 Industrial
- 5.4.4 Utility-Scale Power Generation
- 5.5 By Geography
- 5.5.1 North America
- 5.5.1.1 United States
- 5.5.1.2 Canada
- 5.5.1.3 Mexico
- 5.5.2 Europe
- 5.5.2.1 Germany
- 5.5.2.2 France
- 5.5.2.3 Italy
- 5.5.2.4 Spain
- 5.5.2.5 United Kingdom
- 5.5.2.6 Poland
- 5.5.2.7 Russia
- 5.5.2.8 Rest of Europe
- 5.5.3 Asia-Pacific
- 5.5.3.1 China
- 5.5.3.2 India
- 5.5.3.3 Japan
- 5.5.3.4 South Korea
- 5.5.3.5 Australia
- 5.5.3.6 Indonesia
- 5.5.3.7 Vietnam
- 5.5.3.8 Thailand
- 5.5.3.9 Rest of Asia-Pacific
- 5.5.4 South America
- 5.5.4.1 Brazil
- 5.5.4.2 Argentina
- 5.5.4.3 Chile
- 5.5.4.4 Rest of South America
- 5.5.5 Middle East and Africa
- 5.5.5.1 Saudi Arabia
- 5.5.5.2 United Arab Emirates
- 5.5.5.3 Egypt
- 5.5.5.4 South Africa
- 5.5.5.5 Morocco
- 5.5.5.6 Rest of Middle East and Africa
- 5.5.1 North America
6 COMPETITIVE LANDSCAPE
- 6.1 Market Concentration
- 6.2 Strategic Moves
- 6.3 Market Share Analysis
- 6.4 Company Profiles (includes Global Level Overview, Market Level Overview, Core Segments, Financials as available, Strategic Information, Products and Services, Recent Developments)
- 6.4.1 Drax Group plc
- 6.4.2 Orsted A/S
- 6.4.3 ENGIE SA
- 6.4.4 Enel SpA
- 6.4.5 RWE AG
- 6.4.6 EDF
- 6.4.7 Vattenfall AB
- 6.4.8 E.ON SE
- 6.4.9 Veolia Environnement S.A.
- 6.4.10 SUEZ
- 6.4.11 Ameresco, Inc.
- 6.4.12 Babcock & Wilcox Enterprises, Inc.
- 6.4.13 Mitsubishi Heavy Industries, Ltd.
- 6.4.14 Valmet Oyj
- 6.4.15 ANDRITZ AG
- 6.4.16 General Electric Company
- 6.4.17 Siemens Energy AG
- 6.4.18 Hitachi Zosen Corporation
- 6.4.19 John Wood Group PLC
- 6.4.20 Thermax Limited
- 6.4.21 Sumitomo Heavy Industries, Ltd.
7 MARKET OPPORTUNITIES AND FUTURE OUTLOOK
- 7.1 White-Space and Unmet-Need Assessment

 生質能發電市場預測至2034年-全球分析(按原料、電廠裝置容量、發電結構、併網方式、專案類型、所有權、轉換技術、應用、最終用戶和地區分類)
 生質能發電市場規模、佔有率、成長、全球產業分析、區域趨勢及2026年至2034年預測。
 生質能發電市場:2026-2032年全球市場預測(依原料、轉化技術、容量等級、電廠配置、運轉模式及最終用途分類)沼氣發電市場預測至2034年:按原料、技術、應用、最終用戶和地區分類的全球分析生質能源市場預測—全球產品、原料、轉換技術、應用、最終用戶與地區分析—2034年生質能發電市場:按燃料類型、技術、容量和應用分類的全球預測,2026-2032年
 2026年全球生質能發電市場報告全球生質能發電市場規模、佔有率、趨勢和成長分析報告(2026-2034年)2026年全球生質能發電市場報告
 生質能發電市場規模、佔有率及成長分析(依原料、技術、燃料、終端用戶及地區分類)-2026-2033年產業預測