


 |
市場調查報告書
商品編碼
2157040
雲端安全性修復自動化:市場佔有率分析、產業趨勢與統計及成長預測(2026-2031 年)Cloud Security Remediation Automation - Market Share Analysis, Industry Trends & Statistics, Growth Forecasts (2026 - 2031) |
||||||

※ 本網頁內容可能與最新版本有所差異。詳細情況請與我們聯繫。
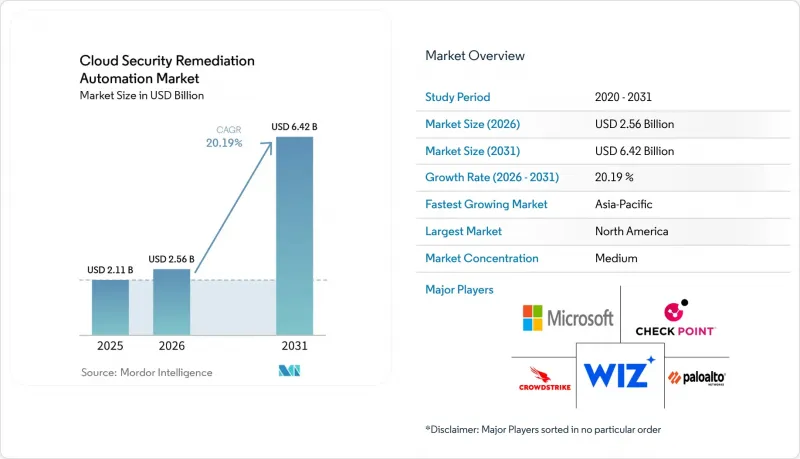
根據 Mordor Intelligence 預測,雲端安全修復自動化市場規模將從 2025 年的 21.1 億美元和 2026 年的 25.6 億美元成長到 2031 年的 64.2 億美元,2026 年至 2031 年的年複合成長率(CAGR)為 20.19%。
全球雲端安全修復自動化市場趨勢與洞察
雲端原生工作負載的擴展和多重雲端。
容器化工作負載和多重雲端架構的激增,使得團隊需要監控和修復的配置數量不斷增加。泰雷茲的一項調查顯示,到 2025 年,平均每家公司將管理 2.1 個公共雲端供應商,同時也要維護本地基礎設施。調查也顯示,55% 的受訪者認為雲端環境比本地基礎設施更難保障安全。企業平均使用 85 個 SaaS 應用程式,這加劇了整個環境中的存取控制和可見性差距。由於互聯的供應商環境需要一致的策略執行,而不是逐一進行人工審查,因此自動化雲端安全修復市場正在蓬勃發展。明確的問責機制仍然至關重要,因為被忽視的問題可能需要回報給管治,才能實施自動化修復。
人工智慧驅動的風險優先排序和補救措施
人工智慧驅動的工作流程使安全團隊能夠優先處理雲端安全發現的問題,並為開發人員準備糾正措施。據 Sysdig 稱,使用其人工智慧驅動的引導式修復功能的客戶,修復時間縮短了 90% 以上。他們的方法結合了運行時上下文和嚴重性評分,為開發人員產生操作指南。 2026 年 8 月,AWS 擴展了「AWS 自動化安全回應」功能,新增了一個用於自訂修復的人工智慧工具包。此版本涵蓋了來自 Amazon Inspector、Amazon GuardDuty 和 Amazon Macie 的發現,並包含針對產生的修復措施的安全性。隨著安全團隊無需增加人員即可解決更多累積問題,雲端安全修復自動化市場將從中受益。
警報疲勞和缺乏雲端安全技能
警報數量龐大且雲端安全專業知識有限,持續阻礙自動化修復技術的普及。 Check Point 的一項調查顯示,到 2025 年,71% 的企業將使用 10 種或更多雲端安全工具。超過一半的受訪者每天面臨近 500 條警報,62% 的受訪者在檢測到安全漏洞後需要超過 24 小時才能採取修復措施。 ARMO 的報告顯示,受訪的保全行動團隊平均每月處理 4,080 個雲端安全警報,但平均每年僅識別出 7 起真正的安全事件。因此,雲端安全修復自動化市場必須展現出抑制低優先級警報並優先處理需要關注的問題的能力。缺乏專職雲端安全負責人的團隊可能需要更長時間才能建立可靠的流程來有效利用這些平台。
細分市場分析
到 2025 年,軟體將佔據雲端安全修復自動化市場 66.43% 的佔有率。這反映出企業在能夠產生特定配置修復指南的平台上投入了大量資金。策略即程式碼引擎可以針對 JSON 或 YAML提案修改建議,而不是提供通用建議。 2026 年 3 月,Wiz 推出了「Green Agent」的公開預覽版,該代理商利用其「安全圖譜」(代碼到雲端的追蹤、身份所有權和修復歷史記錄)來製定特定環境的修復計劃。 NIST 網路安全框架 2.0 認可「回應」功能中的自動化策略檢驗,因此軟體供應商正在競相提高其修復邏輯的準確性和相關性。
預計2026年至2031年間,該服務的市場規模將以23.11%的複合年成長率成長。內部回應能力有限的組織正在將分類、調查和修復工作外包給託管服務供應商。透過託管式CNAPP修復,服務等級通常不僅與識別問題所需的時間掛鉤,還與平均修復時間(MTTR)掛鉤。這種方法將提供者的責任與安全措施的完成情況連結起來。 2026年8月,Sysdig發布了“Secure AI”,其中包含能夠調查、確定優先順序並產生雲端風險修復計畫的代理商。雲端安全修復自動化產業由將自動化工作流程與人工監督相結合的服務提供支援。
2025年,公共雲端將佔據雲端安全修復自動化市場47.52%的佔有率。雲端原生工作負載正集中於超大規模資料中心業者平台,在這些平台上,安全工具可以與雲端服務供應商的控制平面協同工作。 2026年8月,AWS在「AWS自動化安全回應」中新增了AI工具包功能。此次更新擴展了對來自Amazon Inspector、Amazon GuardDuty和Amazon Macie的檢測結果的自動化修復操作。使用多個雲端服務供應商的組織還需要能夠跨不同API標準化策略定義的工具。這項需求支撐著公共雲端環境中廠商中立的功能。
混合雲端預計將在2026年至2031年間以22.38%的複合年成長率成長。金融服務和醫療保健機構正在採用混合架構,其中敏感資料需要保留在本地,而連接的雲端服務則支援分析和通訊。德國聯邦資訊安全局(BSI)於2026年發布了「C5:2026」標準,根據NIS2和「歐洲雲端服務網路安全認證計畫」更新了雲端合規性要求。這些要求支持為在超大規模資料中心業者和主權雲端環境中運作的工作負載持續產生證據。私有雲端部署在政府和國防部門仍然很常見,因為這些部門需要網路隔離。混合架構自動化雲端安全修復的市場規模成長,主要源自於檢驗具有不同連接性和管治的基礎設施的控制措施的需求。
區域分析
到2025年,北美將佔據雲端安全修復自動化市場37.58%的佔有率。該地區雲端原生企業和金融領域雲端活動的集中地眾多。 NIST網路安全框架2.0、HIPAA和SEC網路安全揭露要求正在影響買家對安全控制和報告的預期。北美企業也是基於代理商的修復功能的早期採用者。這些營運要求持續影響全球對修復速度和控制的評估。由於買家能夠將自身的修復需求與當前的監管和營運要求相匹配,該地區的雲端安全修復自動化市場仍然強勁。
在歐洲,由於有許多適用於雲端運營的合規框架,市場需求呈現出獨特的特徵。預計到2025年,德國IT安全市場規模將達到111億歐元(129.1億美元)。同年,安全軟體和雲端平台市場規模預計將達到48億歐元(55.8億美元)。 NIS2審計要求、DORA監管以及BSI C5:2026標準正在推動對持續證據和糾正措施文件的需求。主權雲端要求也在影響採購趨勢,因為相關工具可能需要在國家資料邊界內運作。歐洲雲端安全糾正措施自動化市場的規模將取決於供應商滿足這些管治要求的能力。
預計亞太地區在2026年至2031年間將以25.76%的複合年成長率成長。印度、韓國、澳洲和日本正在擴大雲端採用率,同時也正在應對各自不同的合規要求。在此背景下,能夠跨多個框架和本機作業系統環境強制執行策略的工具正日益受到青睞。 Sysdig的一份報告顯示,到2026年,全球超過70%的安全團隊將使用行為分析來管理雲端工作負載。沙烏地阿拉伯和阿拉伯聯合大公國也正透過國家級數位轉型計畫加大對雲端安全的投入。南美洲和非洲的規模仍然較小,但巴西和南非在金融監管和資料保護要求的推動下,對雲端的需求正在成長。
其他好處:
- Excel格式的市場預測(ME)表
- 3個月的分析師支持
目錄
第1章:引言
- 研究假設和市場定義
- 調查範圍
第2章:調查方法
第3章執行摘要
第4章 市場狀況
- 市場概覽
- 市場促進因素
- 雲端原生工作負載的擴展和多重雲端的複雜性
- 持續合規和審計證據的要求
- CNAPP:程式碼、雲端和運行時的融合
- 人工智慧驅動的風險優先排序和糾正措施
- 網路保險安全評分卡
- 在中型企業中引入無程式碼修復技術
- 市場限制因素
- 警報疲勞和雲端安全人才短缺
- 糾正措施、變更管理和回滾風險的安全性。
- SaaS 和 PaaS 的 API 深度限制
- 對主權雲端和資料儲存位置的限制
- 宏觀經濟因素的影響
- 價值供應鏈分析
- 監理情勢
- GDPR 和 NIS2
- 數位營運韌性法
- HIPAA 安全規則
- PCI DSS 4.0.1
- NIST網路安全框架2.0
- 技術展望
- 根據政策即代碼和基礎設施即代碼採取的糾正措施
- 基於圖表的攻擊路徑優先排序
- 無代理和基於代理的分析範圍
- 生成式人工智慧與確定性修復
- Kubernetes 和無伺服器運算中的安全措施
- 波特五力分析
第5章 市場規模與成長預測
- 按組件
- 軟體
- 服務
- 透過雲端環境
- 公共雲端
- 私有雲端
- 混合雲端
- 多重雲端
- 按組織規模
- 大公司
- 小型企業
- 按行業分類
- 政府和公共行政
- 工業製造
- 零售與電子商務
- 運輸/物流
- 能源公用事業
- 石油和天然氣
- 資訊科技/通訊
- 媒體與娛樂
- 教育和研究機構
- 醫療保健和生命科學
- 銀行、金融服務和保險(BFSI)
- 其他工業部門
- 按地區
- 北美洲
- 美國
- 加拿大
- 墨西哥
- 南美洲
- 巴西
- 阿根廷
- 其他南美國家
- 歐洲
- 德國
- 英國
- 法國
- 義大利
- 西班牙
- 其他歐洲國家
- 亞太地區
- 中國
- 日本
- 印度
- 韓國
- 澳洲
- 其他亞太國家
- 中東
- 沙烏地阿拉伯
- 阿拉伯聯合大公國
- 其他中東國家
- 非洲
- 南非
- 奈及利亞
- 其他非洲國家
- 北美洲
第6章 競爭情勢
- 市場集中度
- 策略趨勢
- 市佔率分析
- 公司簡介
- Palo Alto Networks, Inc.
- Wiz, Inc.
- Microsoft Corporation
- CrowdStrike Holdings, Inc.
- Check Point Software Technologies Ltd.
- Orca Security Ltd.
- Google LLC
- Amazon Web Services, Inc.
- IBM Corporation
- Cisco Systems, Inc.
- Fortinet, Inc.
- Trend Micro Incorporated
- Qualys, Inc.
- Rapid7, Inc.
- Tenable Holdings, Inc.
- SentinelOne, Inc.
- Aqua Security Software Ltd.
- Sysdig, Inc.
- Zscaler, Inc.
- Sophos Limited
- Datadog, Inc.
- VMware, Inc.
- AccuKnox, Inc.
- Upwind Security, Inc.
- Mondoo, Inc.
第7章 市場機會與未來展望
According to Mordor Intelligence, the cloud security remediation automation market size is projected to expand from USD 2.11 billion in 2025 and USD 2.56 billion in 2026 to USD 6.42 billion by 2031, registering a CAGR of 20.19% between 2026 to 2031.
Global Cloud Security Remediation Automation Market Trends and Insights
Cloud-Native Workload Expansion and Multicloud Complexity
Containerized workloads and multicloud architectures are expanding the number of configurations that teams must monitor and correct. Thales found that the average enterprise managed 2.1 public cloud providers while retaining on-premises infrastructure in 2025. The study also found that 55% of respondents considered cloud environments harder to secure than on-premises infrastructure. Enterprises used an average of 85 SaaS applications, which increased access-control and visibility gaps across their environments. Cloud security remediation automation market demand rises when connected provider environments require consistent policy enforcement rather than separate manual reviews. Clear ownership remains important because an unattended finding can still require governance escalation before an automated fix is executed.
AI-Assisted Risk Prioritization and Remediation
AI-assisted workflows are helping security teams prioritize cloud findings and prepare remediation actions for developers. Sysdig reported that customers using its AI-powered guided remediation feature reduced remediation time by more than 90%. Its approach combined runtime context and severity scoring to produce instructions for developer action. AWS expanded Automated Security Response on AWS in August 2026 to include an AI Toolkit for custom remediation. The release covered findings from Amazon Inspector, Amazon GuardDuty, and Amazon Macie, and included safeguards for generated remediation actions. The cloud security remediation automation market benefits when a fixed security team can address more of its backlog without a matching rise in headcount.
Alert Fatigue and Cloud-Security Skills Shortage
Alert volume and limited cloud security expertise continue to slow the use of automated remediation. Check Point found that 71% of organizations used more than 10 cloud security tools in 2025. More than half of respondents faced nearly 500 alerts each day, and 62% took more than 24 hours to remediate breaches after detection. ARMO reported that surveyed security operations teams processed an average of 4,080 cloud security alerts each month while identifying an average of 7 true incidents annually. The cloud security remediation automation market must therefore show that it can suppress low-value findings and prioritize issues that need a response. Teams without dedicated cloud security leadership may take longer to establish reliable processes for using these platforms.
Other drivers and restraints analyzed in the detailed report include:
- Continuous Compliance and Audit-Evidence Requirements
- CNAPP Convergence Across Code, Cloud, and Runtime
- Remediation Safety, Change-Control, and Rollback Risk
For complete list of drivers and restraints, kindly check the Table Of Contents.
Segment Analysis
Software held 66.43% of cloud security remediation automation market share in 2025. This position reflected enterprise spending on platforms that generate configuration-specific remediation guidance. Policy-as-code engines can propose JSON or YAML changes instead of providing generic recommendations. Wiz introduced Green Agent in public preview in March 2026 to use its Security Graph, code-to-cloud tracing, identity ownership, and remediation history for environment-specific plans. NIST Cybersecurity Framework 2.0 recognizes automated policy verification within the Respond function. Software providers are therefore competing on the accuracy and relevance of remediation logic.
Services are projected to grow at a 23.11% CAGR from 2026 to 2031. Organizations with limited internal capability are outsourcing triage, investigation, and fix execution to managed service providers. Managed CNAPP remediation commonly links service levels to mean time to remediate rather than only time to identify an issue. That approach ties provider accountability to the completion of a security action. Sysdig launched Secure AI in August 2026 with agents that investigate, prioritize, and generate fixes for cloud risks. The cloud security remediation automation industry is supported by services that combine automated workflows with human oversight.
Public cloud accounted for 47.52% of cloud security remediation automation market share in 2025. Cloud-native workloads are concentrated on hyperscaler platforms where security tools can connect with provider control planes. AWS added AI Toolkit capabilities to Automated Security Response on AWS in August 2026. The update extended automated remediation to findings from Amazon Inspector, Amazon GuardDuty, and Amazon Macie. Organizations using more than 1 cloud provider also need tools that can normalize policy definitions across different APIs. This requirement supports vendor-neutral capabilities in the public cloud environment.
Hybrid cloud is projected to grow at a 22.38% CAGR from 2026 to 2031. Financial services and healthcare organizations use hybrid designs when sensitive data must remain on-premises while connected cloud services support analytics and communications. Germany's BSI published C5:2026 criteria in 2026, updating cloud compliance requirements in line with NIS2 and the European Cybersecurity Certification Scheme for Cloud Services. These requirements support continuous evidence generation for workloads operating across hyperscaler and sovereign cloud environments. Private cloud adoption remains more common in government and defense environments with network-isolation requirements. The cloud security remediation automation market size for hybrid architectures is supported by the need to verify controls across connected but differently governed infrastructure.
Complete Report Scope:
- By Componnent
- Software
- Services
- By Cloud Environment
- Public Cloud
- Private Cloud
- Hybrid Cloud
- Multi-Cloud
- By Organization Size
- Large Enterprises
- Small and Medium Enterprises
- By Industry Vertical
- Government and Public Administration
- Industrial Manufacturing
- Retail and E-Commerce
- Transportation and Logistics
- Energy and Utilities
- Oil and Gas
- IT and Telecommunication
- Media and Entertainment
- Education and Research Institutions
- Healthcare and Life Sciences
- Banking, Financial Services, and Insurance (BFSI)
- Other Industry Verticals
- By Geography
- North America
- United States
- Canada
- Mexico
- South America
- Brazil
- Argentina
- Rest of South America
- Europe
- Germany
- United Kingdom
- France
- Italy
- Spain
- Rest of Europe
- Asia-Pacific
- China
- Japan
- India
- South Korea
- Australia
- Rest of Asia-Pacific
- Middle East
- Saudi Arabia
- United Arab Emirates
- Rest of Middle East
- Africa
- South Africa
- Nigeria
- Rest of Africa
- North America
Geography Analysis
North America held 37.58% of the cloud security remediation automation market share in 2025. The region has a high concentration of cloud-native enterprises and financial-sector cloud activity. NIST Cybersecurity Framework 2.0, HIPAA, and SEC cybersecurity disclosure requirements shape buyer expectations for security controls and reporting. North American enterprises also adopted agentic remediation capabilities early. Their operating requirements continue to influence global evaluations of remediation speed and control. The cloud security remediation automation market remains well-established in the region because buyers can align remediation needs with active regulatory and operational requirements.
Europe has a distinct demand profile due to the multiple compliance frameworks that apply to cloud operations. Germany's IT security sector reached EUR 11.1 billion (USD 12.91 billion) in 2025. Security software and cloud platforms reached EUR 4.8 billion (USD 5.58 billion) during the year. NIS2 audit requirements, DORA supervision, and BSI C5:2026 criteria are increasing the demand for continuous evidence and remediation records. Sovereign cloud requirements also shape procurement because tools may need to operate within national data boundaries. The cloud security remediation automation market size in Europe is tied to vendors' ability to support these governance requirements.
Asia-Pacific is projected to grow at a 25.76% CAGR from 2026 to 2031. India, South Korea, Australia, and Japan are expanding cloud adoption while managing different national compliance requirements. This setting supports tools that can apply policies across several frameworks and local operating environments. Sysdig reported that more than 70% of security teams globally used behavioral analytics for cloud workloads in 2026. Saudi Arabia and the United Arab Emirates are also increasing cloud security investment through national digital transformation programs. South America and Africa remain smaller regions, but Brazil and South Africa are building demand through financial-sector oversight and data-protection requirements.
- Palo Alto Networks, Inc.
- Wiz, Inc.
- Microsoft Corporation
- CrowdStrike Holdings, Inc.
- Check Point Software Technologies Ltd.
- Orca Security Ltd.
- Google LLC
- Amazon Web Services, Inc.
- IBM Corporation
- Cisco Systems, Inc.
- Fortinet, Inc.
- Trend Micro Incorporated
- Qualys, Inc.
- Rapid7, Inc.
- Tenable Holdings, Inc.
- SentinelOne, Inc.
- Aqua Security Software Ltd.
- Sysdig, Inc.
- Zscaler, Inc.
- Sophos Limited
- Datadog, Inc.
- VMware, Inc.
- AccuKnox, Inc.
- Upwind Security, Inc.
- Mondoo, Inc.
Additional Benefits:
- The market estimate (ME) sheet in Excel format
- 3 months of analyst support
TABLE OF CONTENTS
1 INTRODUCTION
- 1.1 Study Assumptions and Market Definition
- 1.2 Scope of the Study
2 RESEARCH METHODOLOGY
3 EXECUTIVE SUMMARY
4 MARKET LANDSCAPE
- 4.1 Market Overview
- 4.2 Market Drivers
- 4.2.1 Cloud-Native Workload Expansion and Multicloud Complexity
- 4.2.2 Continuous Compliance and Audit-Evidence Requirements
- 4.2.3 CNAPP Convergence Across Code, Cloud, and Runtime
- 4.2.4 AI-Assisted Risk Prioritization and Remediation
- 4.2.5 Cyber-Insurance Security Scorecards
- 4.2.6 Mid-Market Adoption of No-Code Remediation
- 4.3 Market Restraints
- 4.3.1 Alert Fatigue and Cloud-Security Skills Shortage
- 4.3.2 Remediation Safety, Change-Control, and Rollback Risk
- 4.3.3 SaaS and PaaS API-Depth Limitations
- 4.3.4 Sovereign-Cloud and Data-Residency Constraints
- 4.4 Impact of Macroeconomic Factors
- 4.5 Value / Supply-Chain Analysis
- 4.6 Regulatory Landscape
- 4.6.1 GDPR and NIS2
- 4.6.2 Digital Operational Resilience Act
- 4.6.3 HIPAA Security Rule
- 4.6.4 PCI DSS 4.0.1
- 4.6.5 NIST Cybersecurity Framework 2.0
- 4.7 Technological Outlook
- 4.7.1 Policy-as-Code and Infrastructure-as-Code Remediation
- 4.7.2 Graph-Based Attack-Path Prioritization
- 4.7.3 Agentless and Agent-Based Coverage
- 4.7.4 Generative AI and Deterministic Remediation
- 4.7.5 Kubernetes and Serverless Security Controls
- 4.8 Porter's Five Forces Analysis
- 4.8.1 Threat of New Entrants
- 4.8.2 Bargaining Power of Suppliers
- 4.8.3 Bargaining Power of Buyers
- 4.8.4 Threat of Substitutes
- 4.8.5 Competitive Rivalry
5 MARKET SIZE AND GROWTH FORECASTS (VALUE)
- 5.1 By Componnent
- 5.1.1 Software
- 5.1.2 Services
- 5.2 By Cloud Environment
- 5.2.1 Public Cloud
- 5.2.2 Private Cloud
- 5.2.3 Hybrid Cloud
- 5.2.4 Multi-Cloud
- 5.3 By Organization Size
- 5.3.1 Large Enterprises
- 5.3.2 Small and Medium Enterprises
- 5.4 By Industry Vertical
- 5.4.1 Government and Public Administration
- 5.4.2 Industrial Manufacturing
- 5.4.3 Retail and E-Commerce
- 5.4.4 Transportation and Logistics
- 5.4.5 Energy and Utilities
- 5.4.6 Oil and Gas
- 5.4.7 IT and Telecommunication
- 5.4.8 Media and Entertainment
- 5.4.9 Education and Research Institutions
- 5.4.10 Healthcare and Life Sciences
- 5.4.11 Banking, Financial Services, and Insurance (BFSI)
- 5.4.12 Other Industry Verticals
- 5.5 By Geography
- 5.5.1 North America
- 5.5.1.1 United States
- 5.5.1.2 Canada
- 5.5.1.3 Mexico
- 5.5.2 South America
- 5.5.2.1 Brazil
- 5.5.2.2 Argentina
- 5.5.2.3 Rest of South America
- 5.5.3 Europe
- 5.5.3.1 Germany
- 5.5.3.2 United Kingdom
- 5.5.3.3 France
- 5.5.3.4 Italy
- 5.5.3.5 Spain
- 5.5.3.6 Rest of Europe
- 5.5.4 Asia-Pacific
- 5.5.4.1 China
- 5.5.4.2 Japan
- 5.5.4.3 India
- 5.5.4.4 South Korea
- 5.5.4.5 Australia
- 5.5.4.6 Rest of Asia-Pacific
- 5.5.5 Middle East
- 5.5.5.1 Saudi Arabia
- 5.5.5.2 United Arab Emirates
- 5.5.5.3 Rest of Middle East
- 5.5.6 Africa
- 5.5.6.1 South Africa
- 5.5.6.2 Nigeria
- 5.5.6.3 Rest of Africa
- 5.5.1 North America
6 COMPETITIVE LANDSCAPE
- 6.1 Market Concentration
- 6.2 Strategic Moves
- 6.3 Market Share Analysis
- 6.4 Company Profiles (includes Global Level Overview, Market Level Overview, Core Segments, Financials as available, Strategic Information, Market Rank/Share, Products and Services, Recent Developments)
- 6.4.1 Palo Alto Networks, Inc.
- 6.4.2 Wiz, Inc.
- 6.4.3 Microsoft Corporation
- 6.4.4 CrowdStrike Holdings, Inc.
- 6.4.5 Check Point Software Technologies Ltd.
- 6.4.6 Orca Security Ltd.
- 6.4.7 Google LLC
- 6.4.8 Amazon Web Services, Inc.
- 6.4.9 IBM Corporation
- 6.4.10 Cisco Systems, Inc.
- 6.4.11 Fortinet, Inc.
- 6.4.12 Trend Micro Incorporated
- 6.4.13 Qualys, Inc.
- 6.4.14 Rapid7, Inc.
- 6.4.15 Tenable Holdings, Inc.
- 6.4.16 SentinelOne, Inc.
- 6.4.17 Aqua Security Software Ltd.
- 6.4.18 Sysdig, Inc.
- 6.4.19 Zscaler, Inc.
- 6.4.20 Sophos Limited
- 6.4.21 Datadog, Inc.
- 6.4.22 VMware, Inc.
- 6.4.23 AccuKnox, Inc.
- 6.4.24 Upwind Security, Inc.
- 6.4.25 Mondoo, Inc.
7 MARKET OPPORTUNITIES AND FUTURE OUTLOOK
- 7.1 White-Space and Unmet-Need Assessment
- 7.1.1 Cloud Evidence Residency as a Managed Service
- 7.1.2 Identity-Centric Retainers for Multi-Cloud Estates
- 7.1.3 Incident Response for Containers and Serverless Workloads
- 7.1.4 Outcome-Based Pricing Linked to Containment and Recovery
- 7.1.5 Regional-Language and In-Country Response Coverage
- 7.1.6 Cloud Incident Readiness for Small and Medium Enterprises

 2026年全球軟體即服務(SaaS) 安全態勢管理市場報告
 2026-2030年全球雲端安全態勢管理市場
 雲端安全態勢管理市場:按組件、雲端服務、安全措施、企業規模、雲端服務供應商、國家和地區分類-產業分析、市場規模、市場佔有率和預測(2026-2033 年)
 雲端安全態勢管理:市場佔有率分析、產業趨勢與統計、成長預測(2026-2031)
 雲端安全態勢管理市場:依組件、產業、部署模式和組織規模分類-2026年至2032年全球市場預測2026年全球雲端安全態度管理市場報告
 雲端安全態勢管理市場規模、佔有率和成長分析(按部署模式、服務類型、最終用戶產業、技術重點、合規標準和地區分類)-2026-2033年產業預測
 全球雲端安全態勢管理市場規模、佔有率、趨勢和成長分析報告(2026-2034年)雲端安全態勢管理市場規模、佔有率、成長及全球產業分析:依組件、部署模式、企業類型、雲端模型、產業和地區劃分的洞察與預測(2026-2034 年)
 雲端安全態勢管理市場 - 全球產業規模、佔有率、趨勢、機會及預測(按產品類型、雲端服務模式、公司規模、產業垂直領域、地區和競爭格局分類,2021-2031 年)