


 |
市場調查報告書
商品編碼
2155640
歐洲散貨運輸:市場佔有率分析、產業趨勢與統計及成長預測(2026-2031 年)Europe Bulk Cargo Shipping - Market Share Analysis, Industry Trends & Statistics, Growth Forecasts (2026 - 2031) |
||||||

※ 本網頁內容可能與最新版本有所差異。詳細情況請與我們聯繫。
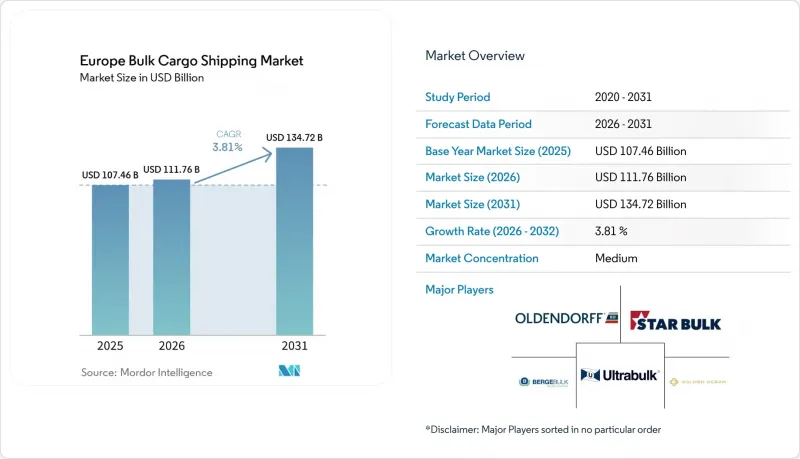
據 Mordor Intelligence 稱,2025 年歐洲散貨運輸市場價值為 1074.6 億美元,預計到 2031 年將達到 1347.2 億美元,而 2026 年為 1117.6 億美元,預測期內(2026-2031 年)的複合年成長率為 3.81%。
歐洲散貨運輸市場的趨勢與洞察
能源轉型導致貨物組成結構重組,特別是生質能、液化天然氣、化學肥料和鋼鐵原料的轉型。
歐洲能源供應的變化改變了主要散貨航線的貨物組成。在鹿特丹,當地買家對天然氣儲備的重組預計將使2025年液化天然氣(LNG)的吞吐量達到1,300萬噸,比2024年增加15.1%。隨著煤炭運輸量的下降,生質能、綠氫能原料和化學肥料正成為日益重要的貨物。歐盟委員會表示,《替代燃料基礎設施條例》將支持運輸網路中替代燃料基礎設施的發展。因此,歐洲散貨運輸市場需要能夠滿足不同貨物規格和不斷變化的貿易航線需求的船舶運力。敞艙式散裝貨船、小型液化天然氣裝運船隻和多用途船舶可以滿足部分此類變化的需求。
透過歐洲散裝運輸走廊實現工業投入品的近岸外包
歐洲製造商越來越注重更短、更可靠的供應鏈路線。這種趨勢將促進歐洲各地工業中心、港口和內陸物流中心之間的貨運。隨著生產基地的搬遷,對鐵礦石、化肥、骨材和化學產品的穩定供應需求增加,歐洲散貨市場也將從中受益。波蘭以及其他中東歐地區將能夠透過波羅的海和北海獲得更多工業投入品。歐洲內部貨運量的成長將提升可靠的沿海航運時刻表及其相關碼頭營運的價值。這將為能夠協調海運、鐵路和內河航運服務的航運公司創造新的商機。
由於歐盟排放、燃料和報告法規,合規成本很高。
歐盟排放交易體系(ETS)已於2024年1月擴展至海運領域。 「FuelEU Maritime」將於2025年1月起適用於停靠歐洲經濟區(EEA)港口的總噸位(GT)及以上船舶。該法規要求2025年溫室氣體排放強度降低2%,並制定到2050年更為嚴格的減排路徑。運營商必須維護符合監管和商業要求的燃油記錄、排放資訊和報告系統。小規模的沿海營運商可能面臨更重的行政負擔,因為他們可用於分攤這些固定成本的資源較少。因此,擁有完善合規體系的船隊在歐洲散貨運輸市場可能更有價值。
細分市場分析
2025年,乾散貨成為歐洲散裝貨物運輸市場的核心,佔62.63%的市佔率。這得歸功於依賴鐵礦石、穀物、化肥、水泥和鋼鐵產品的工業和農業供應鏈。儘管鋼鐵需求有所變化,北歐鋼鐵製造商仍需要鐵礦石和焦結煤。由於製造業和建設業的低迷,2025年歐盟表面消費量將回升3.1%。 2026年上半年,由於天然氣價格飆升影響能源採購,鹿特丹的煤炭吞吐量增加了17.8%。生質能顆粒燃料、離岸風力發電用骨材和永續原料在一定程度上抵消了煤炭吞吐量的下降。由於這些貨物的裝卸要求各不相同,航運公司需要靈活的裝卸和航線規劃。這條供應鏈意味著乾散貨仍然是歐洲港口的重要業務基礎。此外,當工業工廠和倉儲設施的庫存運作接近計畫水準時,托運人依賴可預測的卸貨時間。碼頭營運商必須維護設備和人員,以處理高密度貨物、季節性農產品以及特殊散裝貨物。這些因素共同導致各港口之間的船隊配置不均衡,即使潛在的貨物需求保持穩定。
預計到2031年,液體散貨將以5.23%的複合年成長率成長,成為成長最快的貨品類別,這主要得益於歐洲液化天然氣貿易、成品油和化工製造業的成長。 2025年,鹿特丹的液化天然氣處理量增加了15.1%,達到1,300萬噸。這一成長反映了隨著歐洲能源結構的變化,對天然氣進口能力的需求不斷成長。液體貨物也需要專用儲槽、碼頭、安全系統和貨物單證。 Van Moor 物流於2026年6月在瓦斯蘭港啟用了63個聚合物筒倉,這是其1.85億歐元(2.1762億美元)計畫的第一階段。這項投資顯示了人們對化工產業叢集內倉儲和處理能力的持續信心。食品進口的多元化也促進了食用油和糖蜜的運輸。貨物種類的擴大為碼頭營運商帶來了更多機遇,但也要求對產品品管、倉儲和船舶週轉進行更嚴格的管控。專用基礎設施可以緩解不同貨物(污染程度、溫度和安全要求各異)之間的處理競爭。因此,商業性成功取決於能否有效協調船舶靠泊計畫、倉儲空間可用性和下游客戶需求。
其他好處:
- Excel格式的市場預測(ME)表
- 3個月的分析師支持
目錄
第1章:引言
- 研究假設和市場定義
- 調查範圍
第2章:調查方法
第3章執行摘要
第4章 市場狀況
- 市場概況及散裝貨物運輸的重要性
- 市場促進因素
- 透過歐洲散裝運輸走廊實現工業投入品的近岸外包
- 沿海及支線航線老舊幹散裝貨船亟需更換
- 鼓勵港口脫碳的獎勵正在促進更清潔的散裝貨船的運作。
- 能源轉型導致貨物組成結構重組,特別是生質能、液化天然氣、化學肥料和鋼鐵原料。
- 模式轉換內陸和沿海水道,以減少貨車擁塞和排放氣體。
- 數位化泊位預訂和貨物可視性有助於提高船舶運轉率。
- 市場限制因素
- 由於歐盟排放氣體法規、燃料法規和報告規則,合規成本很高。
- 港口擁擠和勞動力短缺正在削弱航運的可靠性。
- 需求波動源自於鋼鐵、化肥和電力等周期性市場。
- 歐洲部分港口的碼頭吃水深度、倉儲和轉運能力受到限制。
- 產業法規結構
- 價值鍊和分銷管道的結構分析
- 散貨運輸的技術大趨勢和結構性變化
- 波特五力分析
- 票價分析
- 票價趨勢
- 現貨市場分析
- 各國票價比較
- 影響票價的因素
- 成本結構分析
- 運輸成本構成
- 燃料成本趨勢
- 港口費用
- 成本最佳化策略
- 進出口貿易分析
- 港口和碼頭基礎設施分析
- 永續性和ESG分析
- 地緣政治事件對供應鏈變化的影響
第5章 市場規模及成長預測(價值,2026-2031 年)
- 按貨物類型
- 乾散貨
- 鐵礦石
- 煤炭
- 穀物(小麥、玉米、大豆等)
- 肥料
- 水泥和水泥熟料
- 礬土和氧化鋁
- 鋼鐵產品
- 其他少量乾散貨產品
- 液體散貨
- 原油
- 石油精煉產品
- 液化天然氣(LNG)
- 液化石油氣(LPG)
- 化學品
- 食用油和植物油
- 糖蜜
- 其他液體散貨
- 乾散貨
- 沿途
- 國內(沿海)
- 國際的
- 按最終用途行業分類
- 採礦和金屬
- 能源公用事業
- 農業
- 化工/石油化工
- 建築和基礎設施
- 食品加工
- 製造業(一般工業)
- 其他
- 國家
- 英國
- 德國
- 法國
- 西班牙
- 義大利
- 比利時
- 荷蘭
- 北歐國家(丹麥、芬蘭、冰島、挪威、瑞典)
- 其他歐洲國家
第6章 競爭情勢
- 市場集中度
- 關鍵策略趨勢
- 市佔率分析
- 公司簡介
- Oldendorff Carriers
- Ultrabulk A/S
- Star Bulk Carriers
- Golden Ocean Group
- Berge Bulk
- Gearbulk
- Fednav
- Spliethoff Group
- Wagenborg Shipping
- Western Bulk
- SAL Heavy Lift
- Torvald Klaveness
- NORDEN
- Wilson ASA
- Grieg Maritime Group
- Briese Group
- AAL Shipping
- VARAMAR
- MACS Maritime Carrier Shipping
- SMT Shipping
- Diana Shipping
- Cobelfret
第7章 市場機會與未來展望
According to Mordor Intelligence, the European bulk cargo shipping market size was valued at USD 107.46 billion in 2025 and is estimated to grow from USD 111.76 billion in 2026 to reach USD 134.72 billion by 2031, at a CAGR of 3.81% during the forecast period (2026-2031).
Europe Bulk Cargo Shipping Market Trends and Insights
Energy Transition Cargo Rebalancing, Especially Biomass, LNG, Fertilizers, and Steel Inputs
European energy supply changes have altered the cargo mix used by major bulk routes. Rotterdam handled 13 million tons of LNG in 2025, a 15.1% increase from 2024, as regional buyers rebuilt gas stocks. Biomass, green-hydrogen feedstocks, and fertilizers are increasingly relevant cargoes as coal volumes decline. The European Commission states that the Alternative Fuels Infrastructure Regulation supports the deployment of alternative-fuel infrastructure in transport networks. The European bulk cargo shipping market, therefore, needs vessel capacity that can serve different cargo specifications and changing trade lanes. Open-hatch bulkers, smaller LNG carriers, and combination vessels can address parts of this shifting demand.
Nearshoring of Industrial Input Flows through European Bulk Corridors
European manufacturers are placing more attention on shorter and more resilient sourcing routes. This approach supports cargo movements between industrial hubs, ports, and inland distribution points across Europe. The European bulk cargo shipping market benefits when relocated production requires regular deliveries of iron ore, fertilizers, aggregates, and chemicals. Poland and other Central and Eastern European locations can receive more industrial inputs through Baltic and North Sea connections. More intra-European freight can raise the value of reliable short-sea schedules and connected terminal operations. This creates an opening for carriers that can coordinate sea, rail, and inland-waterway services.
High Compliance Cost from EU Emissions, Fuel, and Reporting Rules
The EU Emissions Trading System began covering maritime transport in January 2024. FuelEU Maritime applied from January 2025 to ships above 5,000 GT calling at European Economic Area ports. The regulation required a 2% reduction in greenhouse-gas intensity in 2025, with a more stringent pathway through 2050. Operators need fuel records, emissions information, and reporting systems that satisfy both regulatory and commercial requirements. Smaller short-sea operators can face a heavier administrative burden because they have fewer resources to spread these fixed costs. The European bulk cargo shipping market may consequently place a higher premium on fleets with established compliance processes.
Other drivers and restraints analyzed in the detailed report include:
- Inland-Waterway and Short-Sea Modal Shift to Reduce Truck Congestion and Emissions
- Port Decarbonization Incentives Favoring Cleaner Bulk Vessel Deployment
- Port Congestion and Labor Intermittency Disrupting Voyage Reliability
For complete list of drivers and restraints, kindly check the Table Of Contents.
Segment Analysis
Dry bulk cargo was the core of the Europe bulk cargo shipping market size in 2025, accounting for 62.63% of the market share, with industrial and agricultural supply chains depending on iron ore, grain, fertilizers, cement, and steel products. Northern European steelmakers still require iron ore and coking coal even as steel demand changes. EU apparent steel consumption declined 0.2% in 2025, following weakness in manufacturing and construction. EUROFER projected a 3.1% recovery by the end of 2026, subject to stronger industrial output and less geopolitical pressure. Rotterdam recorded a 17.8% increase in coal throughput during the first half of 2026 as higher gas prices affected energy purchasing. Biomass pellets, offshore-wind aggregates, and sustainable raw materials provide a partial offset to lower coal volumes. Carriers need flexible stowage, cargo-handling methods, and route planning because these cargoes have different loading and discharge needs. These supply chains continue to make dry bulk a broad operational base for European ports. Cargo owners also depend on predictable discharge windows when industrial plants and storage sites run close to scheduled inventory levels. Terminal operators must retain equipment and workforce capability for dense cargoes, seasonal agricultural volumes, and specialized minor bulks. The combination makes fleet deployment less uniform across ports, even when the underlying cargo demand is stable.
Liquid bulk cargo is projected to be the fastest-growing cargo category through 2031, expanding at a 5.23% CAGR, supported by LNG trade, refined petroleum products, and expanding chemical manufacturing across Europe. Rotterdam's LNG throughput rose 15.1% to 13 million tons in 2025. This increase reflects the need for gas import capacity as European energy sourcing changes. Liquid cargo also needs specialized tanks, terminals, safety systems, and cargo documentation. Van Moer Logistics opened 63 polymer silos at Waaslandhaven in June 2026 as the first phase of a EUR 185 million (USD 217.62 million) program. The investment showed continued confidence in chemical-cluster storage and handling capacity. Diversified food imports also sustain traffic in edible oils and molasses. The wider mix gives terminal operators more opportunities, but it requires closer control of product quality, storage, and vessel turnaround. Dedicated infrastructure can reduce handling conflicts between cargoes with different contamination, temperature, and safety requirements. Commercial success, therefore, depends on matching vessel calls with storage availability and downstream customer demand.
Complete Report Scope:
- By Cargo Type
- Dry Bulk Cargo
- Iron Ore
- Coal
- Grain (Wheat, Corn, Soybeans, etc.)
- Fertilizers
- Cement & Clinker
- Bauxite & Alumina
- Steel Products
- Other Minor Dry Bulk Commodities
- Liquid Bulk Cargo
- Crude Oil
- Refined Petroleum Products
- Liquefied Natural Gas (LNG)
- Liquefied Petroleum Gas (LPG)
- Chemicals
- Edible & Vegetable Oils
- Molasses
- Other Liquid Bulk Commodities
- Dry Bulk Cargo
- By Shipping Route
- Domestic (Coastal)
- International
- By End-Use Industry
- Mining & Metals
- Energy & Utilities
- Agriculture
- Chemicals & Petrochemicals
- Construction & Infrastructure
- Food Processing
- Manufacturing (General Industrial)
- Others
- By Country
- United Kingdom
- Germany
- France
- Spain
- Italy
- Belgium
- Netherlands
- NORDICS (Denmark, Finland, Iceland, Norway, and Sweden)
- Rest of Europe
List of Companies Covered in this Report:
- Oldendorff Carriers
- Ultrabulk A/S
- Star Bulk Carriers
- Golden Ocean Group
- Berge Bulk
- Gearbulk
- Fednav
- Spliethoff Group
- Wagenborg Shipping
- Western Bulk
- SAL Heavy Lift
- Torvald Klaveness
- NORDEN
- Wilson ASA
- Grieg Maritime Group
- Briese Group
- AAL Shipping
- VARAMAR
- MACS Maritime Carrier Shipping
- SMT Shipping
- Diana Shipping
- Cobelfret
Additional Benefits:
- The market estimate (ME) sheet in Excel format
- 3 months of analyst support
TABLE OF CONTENTS
1 Introduction
- 1.1 Study Assumptions & Market Definition
- 1.2 Scope of the Study
2 Research Methodology
3 Executive Summary
4 Market Landscape
- 4.1 Market Overview and Importance of Bulk Cargo Shipping
- 4.2 Market Drivers
- 4.2.1 Nearshoring of Industrial Input Flows Through European Bulk Corridors
- 4.2.2 Replacement Demand from Aging Short-Sea and Feeder Dry Bulk Fleets
- 4.2.3 Port Decarbonization Incentives Favoring Cleaner Bulk Vessel Deployment
- 4.2.4 Energy Transition Cargo Rebalancing, Especially Biomass, LNG, Fertilizers, and Steel Inputs
- 4.2.5 Inland-Waterway and Short-Sea Modal Shift to Reduce Truck Congestion and Emissions
- 4.2.6 Digital Berth Scheduling and Cargo Visibility Improving Vessel Utilization
- 4.3 Market Restraints
- 4.3.1 High Compliance Cost from EU Emissions, Fuel, And Reporting Rules
- 4.3.2 Port Congestion and Labor Intermittency Disrupting Voyage Reliability
- 4.3.3 Demand Volatility from Cyclical Steel, Fertilizer, and Power Markets
- 4.3.4 Limited Terminal Draft, Storage, and Transshipment Capacity in Select European Ports
- 4.4 Industry Regulatory Framework
- 4.5 Value Chain and Distribution Channel Architecture Analysis
- 4.6 Technology Megatrends and Structural Shifts Bulk Cargo Shipping
- 4.7 Porter's Five Forces Analysis
- 4.7.1 Threat of New Entrants
- 4.7.2 Bargaining Power of Suppliers
- 4.7.3 Bargaining Power of Buyers
- 4.7.4 Threat of Substitutes
- 4.7.5 Rivalry Among Competitors
- 4.8 Freight Rate Analysis
- 4.8.1 Freight Rate Trends
- 4.8.2 Spot Market Analysis
- 4.8.3 Country-wise Freight Rate Comparison
- 4.8.4 Factors Influencing Freight Rates
- 4.9 Cost Structure Analysis
- 4.9.1 Shipping Cost Components
- 4.9.2 Fuel Cost Trends
- 4.9.3 Port Charges
- 4.9.4 Cost Optimization Strategies
- 4.10 Import-Export Trade Analysis
- 4.11 Port and Terminal Infrastructure Analysis
- 4.12 Sustainability and ESG Analysis
- 4.13 Impact of Geo-Political Events on Supply Chain Shifts
5 Market Size & Growth Forecasts (Value, 2026-2031)
- 5.1 By Cargo Type
- 5.1.1 Dry Bulk Cargo
- 5.1.1.1 Iron Ore
- 5.1.1.2 Coal
- 5.1.1.3 Grain (Wheat, Corn, Soybeans, etc.)
- 5.1.1.4 Fertilizers
- 5.1.1.5 Cement & Clinker
- 5.1.1.6 Bauxite & Alumina
- 5.1.1.7 Steel Products
- 5.1.1.8 Other Minor Dry Bulk Commodities
- 5.1.2 Liquid Bulk Cargo
- 5.1.2.1 Crude Oil
- 5.1.2.2 Refined Petroleum Products
- 5.1.2.3 Liquefied Natural Gas (LNG)
- 5.1.2.4 Liquefied Petroleum Gas (LPG)
- 5.1.2.5 Chemicals
- 5.1.2.6 Edible & Vegetable Oils
- 5.1.2.7 Molasses
- 5.1.2.8 Other Liquid Bulk Commodities
- 5.1.1 Dry Bulk Cargo
- 5.2 By Shipping Route
- 5.2.1 Domestic (Coastal)
- 5.2.2 International
- 5.3 By End-Use Industry
- 5.3.1 Mining & Metals
- 5.3.2 Energy & Utilities
- 5.3.3 Agriculture
- 5.3.4 Chemicals & Petrochemicals
- 5.3.5 Construction & Infrastructure
- 5.3.6 Food Processing
- 5.3.7 Manufacturing (General Industrial)
- 5.3.8 Others
- 5.4 By Country
- 5.4.1 United Kingdom
- 5.4.2 Germany
- 5.4.3 France
- 5.4.4 Spain
- 5.4.5 Italy
- 5.4.6 Belgium
- 5.4.7 Netherlands
- 5.4.8 NORDICS (Denmark, Finland, Iceland, Norway, and Sweden)
- 5.4.9 Rest of Europe
6 Competitive Landscape
- 6.1 Market Concentration
- 6.2 Key Strategic Moves
- 6.3 Market Share Analysis
- 6.4 Company Profiles (includes Global level Overview, Market level overview, Core Segments, Financials as available, Strategic Information, Geographic/Network Coverage, Products & Services, and Recent Developments)
- 6.4.1 Oldendorff Carriers
- 6.4.2 Ultrabulk A/S
- 6.4.3 Star Bulk Carriers
- 6.4.4 Golden Ocean Group
- 6.4.5 Berge Bulk
- 6.4.6 Gearbulk
- 6.4.7 Fednav
- 6.4.8 Spliethoff Group
- 6.4.9 Wagenborg Shipping
- 6.4.10 Western Bulk
- 6.4.11 SAL Heavy Lift
- 6.4.12 Torvald Klaveness
- 6.4.13 NORDEN
- 6.4.14 Wilson ASA
- 6.4.15 Grieg Maritime Group
- 6.4.16 Briese Group
- 6.4.17 AAL Shipping
- 6.4.18 VARAMAR
- 6.4.19 MACS Maritime Carrier Shipping
- 6.4.20 SMT Shipping
- 6.4.21 Diana Shipping
- 6.4.22 Cobelfret
7 Market Opportunities & Future Outlook
- 7.1 White-space & Unmet-Need Assessment


