


 |
市場調查報告書
商品編碼
2154284
美國電動汽車租賃:市場佔有率分析、行業趨勢和統計數據以及成長預測(2026-2031 年)United States Electric Vehicle Leasing - Market Share Analysis, Industry Trends & Statistics, Growth Forecasts (2026 - 2031) |
||||||

※ 本網頁內容可能與最新版本有所差異。詳細情況請與我們聯繫。
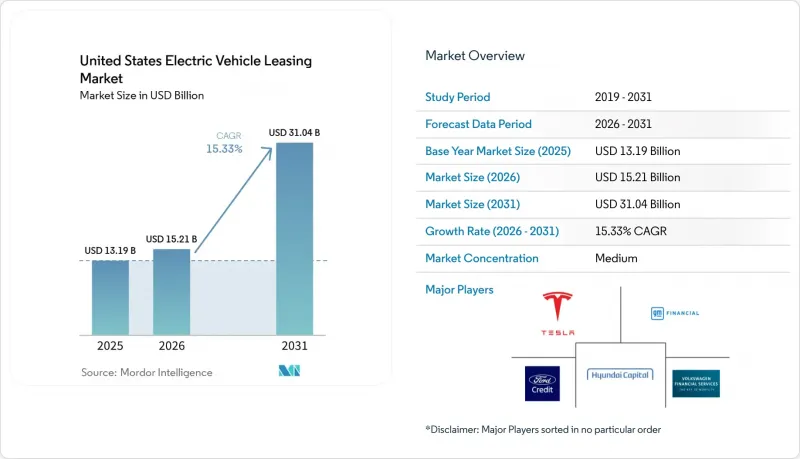
據 Mordor Intelligence 稱,2025 年美國電動車租賃市場價值 131.9 億美元,預計 2026 年將達到 152.1 億美元,到 2031 年將達到 310.4 億美元。
預計從 2026 年到 2031 年,其複合年成長率將達到 15.33%。
美國電動車租賃市場趨勢與分析
適用於租賃的聯邦電動車稅額扣抵
第 45W 條款允許商業租賃公司申請全額 7,500 美元的稅額扣抵,他們可以用這筆錢直接降低租賃付款,從而規避適用於直接購買的收入限制和廠商建議零售價 (MSRP) 上限。隨著消費者稅額扣抵於 2025 年到期,租賃協議數量激增,目前已佔所有電動車 (EV) 交易的很大一部分。這一趨勢凸顯了美國電動車租賃市場由於現有補貼計畫而呈現的結構性優勢。作為一項策略性舉措,今年上半年,專屬式金融部門為經銷商庫存提供了預付款,使得信貸能夠在第四季度兌現。此舉有效地拓寬了客戶的選擇範圍。與貸款相比,更優惠的付款方式不僅有助於應對不斷上漲的利率壓力,而且對個人和企業買家都具有吸引力。除非國會修改法律或市場利率大幅下降,否則預計這一趨勢將持續下去。
降低電池成本將降低總擁有成本(TCO)。
預計電池組價格將在2024年大幅下降,並在2026年進一步下降,最終突破成本平價的關鍵閾值。成本的降低將提高車輛殘值,從而允許更嚴格的租賃條款。這些趨勢正在推動美國電動車租賃市場的發展,並吸引著注重成本控制的車隊管理者。分析表明,車隊的總擁有成本遠低於汽油車,隨著行駛里程的增加,這種差異會進一步擴大,從而加速企業向電動車轉型。隨著折舊免稅額曲線趨於平緩,租賃公司獲得了更大的定價權,而客戶則受益於更短的投資回收期,尤其是在燃油價格波動的情況下。
高利率推高了每月還款額。
2026年3月,聯準會維持聯邦基金利率不變。同期,新車貸款利率居高不下。這些利率反映在租賃資金係數中,導致電動車的月供遠高於低利率情境。這種差異限制了美國電動車租賃市場的潛在需求,尤其是在那些對月供波動較為敏感的家庭中。
細分市場分析
儘管乘用車在2025年仍將佔據84.25%的市場佔有率,但預計到2031年,商用貨車和輕型卡車的年成長率將達到17.13%。亞馬遜部署3萬輛Rivian貨車表明,在利用率高的路線上,電動化可以迅速實現獲利能力。隨著車隊管理者尋求降低維修和燃料成本,美國商用電動車租賃市場預計將以高於乘用車市場的速度成長。同時,乘用車憑藉豐富的車型和45W條款下的稅收優惠政策,正保持著成長動能。
乘用車需求主要集中在特斯拉Model 3和Model Y、HondaPrologue以及現代IONIQ 5。然而,赫茲近期對特斯拉車輛提列的減損準備凸顯了殘值波動之大,尤其是在廠商建議零售價(MSRP)下調和軟體鎖定等因素的影響下。儘管面臨這些不利因素,商用車市場依然保持韌性。廂型車通常使用至報廢,不會再進入零售通路,這增強了人們對租賃經濟效益的信心。
預計到2025年,電池式電動車(BEV)將佔據77.14%的市場佔有率,這得益於美國各地19.2萬個公共充電樁的支持。插電式混合動力汽車正在解決續航里程問題,而燃料電池汽車(FCV)雖然目前市場佔有率較低,但隨著豐田和現代擴大其氫能基礎設施,預計其年複合成長率將達到15.91%。在美國電動車租賃市場,純電動車仍佔據主導地位,但新型動力系統正在特定營運週期內,尤其是在電池重量是顯著負擔的短途和長途運輸領域,逐漸獲得市場佔有率。
加州空氣資源委員會 (CARB) 的「先進清潔車隊法規」規定,自 2036 年車型起,所有中型和重型車輛的採購必須為 100% 零排放車輛,這將導致純電動車 (BEV) 和燃料電池電動車 (FCEV) 的租賃量增加。擁有國內電池生產線的汽車製造商有資格獲得《通貨膨脹控制法案》(IRA)的稅額扣抵,但從歐洲進口的車輛所獲得的補貼存在差異,這種差異反映在租賃滲透率上,符合規定的車型更具優勢。
其他好處:
- Excel格式的市場預測(ME)表
- 3個月的分析師支持
目錄
第1章:引言
- 研究假設和市場定義
- 調查範圍
第2章:調查方法
第3章執行摘要
第4章 市場狀況
- 市場概覽
- 市場促進因素
- 聯邦電動車稅額扣抵也適用於租約
- 降低電池成本可降低總擁有成本(TCO)。
- 該汽車製造商旗下的金融部門正在擴大其租賃產品的供應範圍。
- 用於出售和包裝內容的 IRA 補貼已退還給租戶。
- 擴大基於訂閱的「靈活」合約
- 電池二次利用帶來的效益正在推高其殘值。
- 市場限制因素
- 高利率環境導致每月還款額增加。
- 農村地區充電基礎設施不足
- OEM軟體中的鎖定功能會對殘值造成風險。
- 某州提議徵收里程課稅,這阻礙了高里程車輛組的引入。
- 價值供應鏈分析
- 監理情勢
- 技術展望
- 波特五力模型
第5章 市場規模與成長預測
- 車輛類型
- 搭乘用車
- 商用車輛
- 依推進類型
- 電池式電動車
- 插電式混合動力電動車
- 燃料電池電動車
- 最終用戶
- 個人客戶
- 企業用車
- 政府機構
- 共乘和配送平台
- 時期
- 短期(少於12個月)
- 中期(1-3年)
- 長期(超過3年)
第6章 競爭情勢
- 市場集中度
- 策略趨勢
- 市佔率分析
- 公司簡介
- Tesla Financial Services
- GM Financial
- Ford Motor Credit Company LLC
- Hyundai Capital Services
- Volkswagen Financial Services
- Toyota Financial Services
- Nissan Motor Acceptance Company
- BMW Financial Services
- Mercedes-Benz Financial Services
- Stellantis Financial Services
- Ally Financial Inc.
- Santander Consumer USA
- Enterprise Fleet Management
- LeasePlan(Ayvens Group)
- Rivian Financial Services
- Lucid Financial Services
第7章 市場機會與未來展望
According to Mordor Intelligence, the United States electric vehicle leasing market size was valued at USD 13.19 billion in 2025, is estimated at USD 15.21 billion in 2026, and is projected to reach USD 31.04 billion by 2031, growing at a CAGR of 15.33% over 2026-2031.
United States Electric Vehicle Leasing Market Trends and Insights
Federal Electric Vehicle Tax Credit Applied to Leases
Section 45W lets commercial lessors claim the full USD 7,500 incentive and roll it directly into lower payments, bypassing income and MSRP caps that apply to outright purchases . After consumer credits lapsed in 2025, leases surged to account for a significant portion of all electric vehicle (EV) transactions. This trend underscores the structural favoritism of the United States electric vehicle leasing market due to the existing subsidy framework. In a strategic move, captive finance arms pre-funded dealer inventories earlier in the year, securing credits for monetization throughout the final quarter. This maneuver effectively broadened the window of opportunity for customers. The payment advantage over loans not only counters rate pressures but also appeals to both retail and fleet buyers. This trend is likely to continue unless Congress amends the legislation or market interest rates drop significantly.
Declining Battery Costs Lower TCO
In 2024, pack prices fell significantly and are projected to decline further by 2026, surpassing a key parity threshold. This reduction in costs leads to higher residuals, allowing for tighter lease factors. Such dynamics bolster the United States electric vehicle leasing market, appealing even to budget-conscious fleet managers. Analyses reveal fleets incur a significantly lower total cost compared to gasoline, a difference that magnifies with increased mileage, propelling corporate mandates towards electrification. As depreciation curves flatten, lessors find themselves with enhanced pricing power, while customers benefit from quicker paybacks, especially in the face of fluctuating fuel prices.
High Interest-Rate Environment Inflates Monthly Payments
In March 2026, the Fed maintained the funds rate at its current level. During the same period, new-car loan rates remained elevated. These rates, reflected in lease money factors, significantly increase monthly charges for electric vehicles (EVs) compared to lower-rate scenarios. This disparity limits the addressable demand in the United States electric vehicle leasing market, particularly among households sensitive to payment fluctuations.
Other drivers and restraints analyzed in the detailed report include:
- OEM Captive Finance Arms Expand Lease Offerings
- IRA Cell-and-Pack Content Subsidy Passed Through to Lessees
- Limited Rural Charging Infrastructure
For complete list of drivers and restraints, kindly check the Table Of Contents.
Segment Analysis
Commercial vans and light trucks expanded at 17.13% through 2031, even though passenger cars still held 84.25% share in 2025. Amazon's deployment of 30,000 Rivian vans exemplifies how high-utilization routes rapidly justify electrification . The United States electric vehicle leasing market size for commercial vehicles is forecast to compound faster than the passenger segments as fleet managers chase lower maintenance and fuel outlays. In parallel, passenger cars maintain momentum via model breadth and Section 45W pass-through benefits.
Passenger demand is gravitating towards the Tesla Model 3, Model Y, Honda Prologue, and Hyundai IONIQ 5. However, Hertz's recent writedown on Teslas highlights the volatility of residual values, especially when MSRP cuts meet software locks. Despite this setback, the commercial fleet remains undeterred. Vans, typically running to the end of their life, don't re-enter retail resale channels, bolstering confidence in lease economics.
Battery-electric units owned 77.14% share in 2025, supported by 192,000 public charging ports nationwide. Plug-in hybrids fill range-anxiety gaps, while fuel-cell vehicles-despite low share-are slated for 15.91% CAGR as Toyota and Hyundai expand hydrogen corridors. The United States electric vehicle leasing market share for BEVs will still dominate, yet second-mover propulsion options capture niche duty cycles, particularly in drayage and long-haul, where battery weight is punitive.
CARB's Advanced Clean Fleets rule compels 100% zero-emission medium and heavy-duty purchases starting by model year 2036, lifting both BEV and FCEV leasing volume . OEMs with domestic battery lines qualify for IRA credits, while European imports face subsidy gaps, a differential visible in lease penetration rates that favor compliant models.
Complete Report Scope:
- By Vehicle Type
- Passenger Cars
- Commercial Vehicles
- By Propulsion Type
- Battery Electric Vehicles
- Plug-in Hybrid Electric Vehicles
- Fuel-Cell Electric Vehicles
- By End User
- Individual Customers
- Corporate Fleets
- Government Agencies
- Ride-Sharing and Delivery Platforms
- By Duration
- Short-Term (Less than 12 months)
- Mid-Term (1-3 years)
- Long-Term (More than 3 years)
List of Companies Covered in this Report:
- Tesla Financial Services
- GM Financial
- Ford Motor Credit Company LLC
- Hyundai Capital Services
- Volkswagen Financial Services
- Toyota Financial Services
- Nissan Motor Acceptance Company
- BMW Financial Services
- Mercedes-Benz Financial Services
- Stellantis Financial Services
- Ally Financial Inc.
- Santander Consumer USA
- Enterprise Fleet Management
- LeasePlan (Ayvens Group)
- Rivian Financial Services
- Lucid Financial Services
Additional Benefits:
- The market estimate (ME) sheet in Excel format
- 3 months of analyst support
TABLE OF CONTENTS
1 Introduction
- 1.1 Study Assumptions and Market Definition
- 1.2 Scope of the Study
2 Research Methodology
3 Executive Summary
4 Market Landscape
- 4.1 Market Overview
- 4.2 Market Drivers
- 4.2.1 Federal EV Tax Credit Applied to Leases
- 4.2.2 Declining Battery Costs Lower TCO
- 4.2.3 OEM Captive Finance Arms Expand Lease Offerings
- 4.2.4 IRA Cell-&-Pack Content Subsidy Passed Through to Lessees
- 4.2.5 Growth Of Subscription-Style "Flex" Contracts
- 4.2.6 Battery Second-Life Revenue Boosts Residual Values
- 4.3 Market Restraints
- 4.3.1 High Interest-Rate Environment Inflates Monthly Payments
- 4.3.2 Limited Rural Charging Infrastructure
- 4.3.3 OEM Software Locks Create Residual-Value Risk
- 4.3.4 State Mileage-Tax Proposals Deter High-Usage Fleets
- 4.4 Value / Supply-Chain Analysis
- 4.5 Regulatory Landscape
- 4.6 Technological Outlook
- 4.7 Porter's Five Forces
- 4.7.1 Competitive Rivalry
- 4.7.2 Threat of New Entrants
- 4.7.3 Bargaining Power of Suppliers
- 4.7.4 Bargaining Power of Customers
- 4.7.5 Threat of Substitutes
5 Market Size and Growth Forecasts (Value (USD))
- 5.1 By Vehicle Type
- 5.1.1 Passenger Cars
- 5.1.2 Commercial Vehicles
- 5.2 By Propulsion Type
- 5.2.1 Battery Electric Vehicles
- 5.2.2 Plug-in Hybrid Electric Vehicles
- 5.2.3 Fuel-Cell Electric Vehicles
- 5.3 By End User
- 5.3.1 Individual Customers
- 5.3.2 Corporate Fleets
- 5.3.3 Government Agencies
- 5.3.4 Ride-Sharing and Delivery Platforms
- 5.4 By Duration
- 5.4.1 Short-Term (Less than 12 months)
- 5.4.2 Mid-Term (1-3 years)
- 5.4.3 Long-Term (More than 3 years)
6 Competitive Landscape
- 6.1 Market Concentration
- 6.2 Strategic Moves
- 6.3 Market Share Analysis
- 6.4 Company Profiles (Includes Global Level Overview, Market Level Overview, Core Segments, Financials as Available, Strategic Information, Market Rank/Share for Key Companies, Products and Services, SWOT Analysis, and Recent Developments)
- 6.4.1 Tesla Financial Services
- 6.4.2 GM Financial
- 6.4.3 Ford Motor Credit Company LLC
- 6.4.4 Hyundai Capital Services
- 6.4.5 Volkswagen Financial Services
- 6.4.6 Toyota Financial Services
- 6.4.7 Nissan Motor Acceptance Company
- 6.4.8 BMW Financial Services
- 6.4.9 Mercedes-Benz Financial Services
- 6.4.10 Stellantis Financial Services
- 6.4.11 Ally Financial Inc.
- 6.4.12 Santander Consumer USA
- 6.4.13 Enterprise Fleet Management
- 6.4.14 LeasePlan (Ayvens Group)
- 6.4.15 Rivian Financial Services
- 6.4.16 Lucid Financial Services
7 Market Opportunities and Future Outlook
- 7.1 White-space and Unmet-Need Assessment

 汽車租賃市場預測至2034年-按租賃類型、車輛類型、客戶類型、租賃期限、提供者類型和地區分類的全球分析
 日本電動車租賃市場:市場佔有率分析、產業趨勢與統計及成長預測(2026-2031)
 全球汽車租賃市場規模、佔有率、趨勢和成長分析報告(2026-2034)汽車租賃市場預測至2034年-按產品類型、車輛類型、租賃形式、最終用戶和地區分類的全球分析
 2026-2030年全球電動車隊能源管理市場
 2026-2030年全球汽車租賃市場
 汽車設備租賃市場:依設備類型、租賃期限、最終用戶產業、預訂管道和燃料類型分類-2026-2032年全球市場預測
 2026年全球汽車設備租賃市場報告電動車隊部署市場預測至2034年:按組件、車隊類型、動力類型、充電方式、最終用戶和地區分類的全球分析
 電動車隊管理市場:依組件、車輛類型、車隊類型、應用和部署類型劃分 - 至2036年的全球預測