


 |
市場調查報告書
商品編碼
2125630
鋅:市場佔有率分析、產業趨勢和統計數據、成長預測(2026-2031 年)Zinc - Market Share Analysis, Industry Trends & Statistics, Growth Forecasts (2026 - 2031) |
||||||

※ 本網頁內容可能與最新版本有所差異。詳細情況請與我們聯繫。
據 Mordor Intelligence 稱,2025 年鋅市場價值為 1378 萬噸,預計到 2031 年將達到 1506 萬噸,而 2026 年為 1393 萬噸,預測期內(2026-2031 年)的複合年成長率為 1.57%。
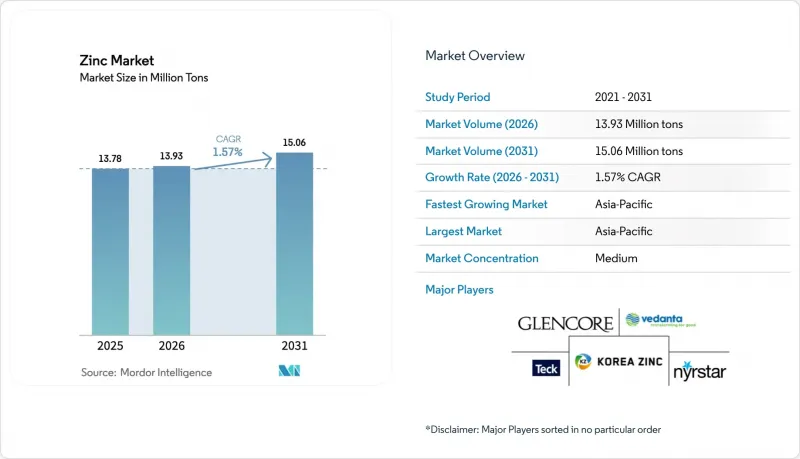
本報告按形狀(精製鋅(板條)、鋅合金等)、製造程序(初級生產、二級生產)、應用(鍍鋅、壓鑄等)、終端用戶行業(建築、交通運輸、消費品等)和地區(亞太地區、北美、歐洲、南美、中東和非洲)進行細分。市場預測以噸為單位。
全球鋅市場趨勢及洞察
基礎建設主導鋅電鍍需求激增
多年公共資本項目鞏固了亞洲和北美地區對鍍鋅企業的需求前景。印度耗資1.4兆美元的國家基礎建設項目、東協高速公路走廊以及美國的《基礎建設投資與就業法案》都需要數十萬噸符合ISO 1461和ASTM A123厚度標準的鍍鋅鋼材。在生命週期經濟性至關重要的應用中,鍍鋅塗層已成為首選的防腐蝕材料,在遍遠地區可提供50至100年的使用壽命。
耐腐蝕鋼在電動車和可再生能源領域的成長
在電池式電動車平台中,鋅鎳合金和鋅鎂合金塗層被指定用於抵禦道路除冰劑和熱循環的影響。同時,在離岸風力發電單樁基礎中,除了熱鍍鋅外,還使用有機面漆來防止氯化物腐蝕。儘管由於薄壁高抗張強度鋼的使用,每噸鋼材的塗層用量有所減少,但塗層鋼的總噸位仍在穩步成長,透過維持需求成長來支撐鋅的長期需求。
嚴格的環境和ESG法規
由於碳邊境調節機制(CBAM)認證價格約為每噸二氧化碳排放量85歐元,從歐盟以外進口精煉鋅的成本增加了每噸130至240美元。中國的「碳排放達峰、碳中和」藍圖在2024年關閉30家小規模冶煉廠,導致產能損失20萬噸。這凸顯了向低排放供應的轉變,而低排放鋅的交易價格已經比普通鋅高出3%至5%。歐盟《企業永續性報告指令》下的範圍3審核使獲得認證的冶煉廠獲得優勢,而高碳排放的競爭對手則處於劣勢。
細分市場分析
到2025年,提煉鋅(鋅板)將佔貿易量的72.21%,以支撐鍍鋅、壓鑄和黃銅加工的需求。相較之下,鋅化合物預計將以2.89%的複合年成長率成長,主要得益於輪胎用氧化鋅活化劑、用於紫外線防護的醫藥級氧化鋅以及用於軟性電子產品的透明導電薄膜。由於歐洲和印度韋爾茨窯的擴建,與再生材料相關的鋅市場規模正在擴大。韋爾茨窯可以從電弧爐粉塵中回收氧化鋅,進而減少75%的二氧化碳排放強度。
二次鋅市場受惠於CBAM信貸和企業範圍3目標等政策利好因素。因此,在中國鋅供應持續過剩的情況下,綜合礦業公司正將業務轉向溢價兩位數的化合物和合金,以實現收入來源多元化,擺脫對大宗商品鋅板的依賴。
預計到2025年,初級生產將佔總產量的65.62%,但其每噸鋅(tZn)1.5至2.5噸的二氧化碳排放量將面臨飆升的碳成本。礦山營運延誤以及前十大礦山佔40%的精礦供應量,都是進一步的風險因素。同時,二次生產(回收利用)正以2.71%的複合年成長率成長,並在鋅市場中佔據越來越大的佔有率。這得歸功於濕式冶金浸出技術的進步,該技術提高了從電弧爐(EAF)粉塵和黃銅浮渣中回收鋅的效率。歐洲的韋爾茲爐目前每年處理50萬噸廢棄物,而印度正在提高產能,以處理鋼鐵業產生的400萬噸粉塵。
區域分析
預計到2025年,亞太地區將佔全球總量的62.86%,並有望達到2.50%的最高複合年成長率。這主要得益於中國電網現代化和印度1.4兆美元基礎設施項目對鍍鋅鋼需求的吸收。東協的大型企劃,例如印尼新首都努沙登加拉的建設,將使鍍鋅鋼的需求增加一倍。此外,日本和韓國在鋅鋁鎂(Zn-Al-Mg)塗層方面擁有豐富的專業知識。監管支持、中國「碳排放達峰和碳中和」政策導致的冶煉廠關閉,以及印度為改善土壤健康而對化肥提供的優惠政策,都在推動該地區的鍍鋅鋼消費。
北美正受益於美國的《基礎設施法案》和加拿大特雷爾冶煉廠的維修努力。 South32公司的埃爾莫薩計畫預計到2027年將使提煉產量增加15萬噸,從而減少對進口的依賴。墨西哥以出口為導向的汽車生產線使鍍鋅廠幾乎運作運轉,支撐著該地區的鋅供需。
將於2026年生效的歐洲碳排放邊界調節機制(CBAM)正在推動市場對Nyrstar、Boliden和其他受監管冶煉廠生產的經認證的低碳金屬的需求成長。同時,2024/367-368號實施決定強制要求管道製造商依照修訂後的飲用水指令,將鋅浸出量控制在5毫克/公升以下,從而促進合金的重組。
其他好處:
- Excel格式的市場預測(ME)表
- 3個月的分析師支持
目錄
第1章:引言
- 市場分析與定義的前提條件
- 分析範圍
第2章 分析方法
第3章執行摘要
第4章 市場狀況
- 市場概覽
- 市場促進因素
- 基礎設施建設帶動了鍍鋅需求的激增。
- 耐腐蝕鋼在電動車和可再生能源領域的成長
- 在微量元素缺乏的土壤中廣泛使用鋅基肥料
- 鋅離子電池和鋅空氣電池的出現
- 歐盟強制要求飲用水使用鍍鋅水管。
- 市場限制因素
- 嚴格的環境和ESG法規
- 由於供應衝擊或供應過剩導致的價格波動
- 化肥中重金屬含量的規定抑制了對硫酸鋅的需求。
- 價值鏈分析
- 波特五力模型
第5章:預測市場規模與成長率
- 按形狀
- 精製鋅(板)
- 鋅合金
- 鋅化合物(氧化鋅、硫酸鋅等)
- 再生/回收鋅
- 透過生產過程
- 初級生產(採礦和提煉)
- 二次生產(回收利用)
- 透過使用
- 鍍鋅
- 壓鑄
- 黃銅
- 氧化鋅及化學產品
- 其他用途
- 按最終用戶行業分類
- 建造
- 運輸
- 電氣和電子設備
- 日常必需品
- 其他終端用戶產業
- 按地區
- 亞太地區
- 中國
- 印度
- 日本
- 韓國
- 印尼
- 馬來西亞
- 泰國
- 越南
- 其他亞太國家
- 北美洲
- 美國
- 加拿大
- 墨西哥
- 歐洲
- 德國
- 英國
- 義大利
- 法國
- 俄羅斯
- 西班牙
- 土耳其
- 北歐國家
- 其他歐洲國家
- 南美洲
- 巴西
- 阿根廷
- 哥倫比亞
- 其他南美國家
- 中東和非洲
- 沙烏地阿拉伯
- 阿拉伯聯合大公國
- 卡達
- 南非
- 埃及
- 奈及利亞
- 其他中東和非洲國家
- 亞太地區
第6章 競爭情勢
- 市場集中度
- 策略趨勢
- 市佔率和排名分析
- 公司簡介
- Boliden Group
- Glencore
- Grupo Mexico
- Hudbay Minerals Inc.
- IVANHOE MINES
- KOREAZINC
- MMG Australia Limited
- Nexa
- Nyrstar
- South32
- Teck Resources Limited
- Vedanta Limited
- Volcan
第7章 市場機會與未來展望
According to Mordor Intelligence, the zinc market size was valued at 13.78 Million tons in 2025 and is estimated to grow from 13.93 Million tons in 2026 to reach 15.06 Million tons by 2031, at a CAGR of 1.57% during the forecast period (2026-2031).
This report is Segmented by Form (Refined Zinc (Slab), Zinc Alloys, and More), Production Process (Primary Production, Secondary Production), Application (Galvanizing, Die-Casting, and More), End-User Industry (Construction, Transportation, Consumer Goods, and More), and Geography (Asia-Pacific, North America, Europe, South America, and Middle-East and Africa). The Market Forecasts are Provided in Terms of Volume (Tons).
Global Zinc Market Trends and Insights
Infrastructure-Led Galvanizing Demand Surge
Multiyear public-capital programs are locking in visibility for galvanizers across Asia and North America. India's USD 1.4 trillion National Infrastructure Pipeline, ASEAN expressway corridors, and the U.S. Infrastructure Investment and Jobs Act require hundreds of thousands of tons of coated steel that must comply with ISO 1461 and ASTM A123 thickness norms. Galvanized coatings deliver service lives of 50-100 years in rural zones, cementing their status as the preferred corrosion barrier where lifecycle economics dominate.
Growth of Corrosion-Resistant Steel in EV and Renewables
Battery-electric platforms specify Zn-Ni and Zn-Mg alloy coatings to withstand road salt and thermal cycling, while offshore-wind monopiles rely on hot-dip galvanizing plus organic topcoats to fight chloride attack. Although thinner high-strength steels reduce coating per ton, total coated-steel tonnage rises fast enough to maintain volume growth, reinforcing long-run support for the zinc market.
Stringent Environmental and ESG Regulations
CBAM certificates priced near EUR 85 tCO2 raise landed costs for non-EU refined zinc by USD 130-240 t. China's dual-carbon roadmap shut 30 small smelters in 2024, erasing 200,000 t of capacity and underscoring a shift toward low-emission supply that already trades at 3-5% premiums. Scope 3 audits under the EU Corporate Sustainability Reporting Directive elevate certified smelters and disadvantage high-carbon peers.
Other drivers and restraints analyzed in the detailed report include:
- Expansion of Zinc-Based Fertilizers in Micronutrient-Deficient Soils
- Emergence of Zinc-Ion and Zinc-Air Batteries
- Fertilizer Heavy-Metal Limits Curbing Zinc Sulfate
For complete list of drivers and restraints, kindly check the Table Of Contents.
Segment Analysis
Refined zinc (slab) controlled 72.21% of 2025 volume, underpinning galvanizing, die-casting, and brass-mill demand. In contrast, zinc compounds will rise at 2.89% CAGR, buoyed by zinc-oxide activators in tires, UV-blocking pharmaceutical grades, and transparent-conductor films for flexible electronics. The zinc market size linked to recycled feed is widening as Waelz-kiln expansions in Europe and India reclaim oxide from electric-arc-furnace dust at 75% lower CO2 intensity.
Secondary zinc enjoys policy tailwinds from CBAM credits and corporate Scope 3 targets. Integrated miners are therefore pivoting toward compounds and alloys that earn double-digit premiums, diversifying revenue away from commodity slabs amid persistent Chinese oversupply.
Primary production held 65.62% of output in 2025, but its 1.5-2.5 t CO2 tZn footprint faces escalating carbon costs. Mine delays and the fact that the top ten sites supply 40% of concentrates add another layer of risk. Conversely, secondary production (recycling) is growing at 2.71% CAGR capture zinc market share as hydrometallurgical leaching upgrades recovery from EAF dust and brass skimmings. European Waelz kilns now process 500,000 t of waste annually, and India is adding capacity to process 4 million t of dust generated by its steel sector.
Complete Report Scope:
- By Form
- Refined Zinc (Slab)
- Zinc Alloys
- Zinc Compounds (Oxide, Sulfate, etc.)
- Secondary/Recycled Zinc
- By Production Process
- Primary Production (Mining and Smelting)
- Secondary Production (Recycling)
- By Application
- Galvanizing
- Die-Casting
- Brass
- Zinc Oxide and Chemicals
- Other Applications
- By End-user Industry
- Construction
- Transportation
- Electrical and Electronics
- Consumer Goods
- Other End-user Industries
- By Geography
- Asia-Pacific
- China
- India
- Japan
- South Korea
- Indonesia
- Malaysia
- Thailand
- Vietnam
- Rest of Asia-Pacific
- North America
- United States
- Canada
- Mexico
- Europe
- Germany
- United Kingdom
- Italy
- France
- Russia
- Spain
- Turkey
- NORDIC Countries
- Rest of Europe
- South America
- Brazil
- Argentina
- Colombia
- Rest of South America
- Middle-East and Africa
- Saudi Arabia
- United Arab Emirates
- Qatar
- South Africa
- Egypt
- Nigeria
- Rest of Middle-East and Africa
- Asia-Pacific
Geography Analysis
Asia-Pacific accounted for 62.86% of global tonnage in 2025 and is set for the highest 2.50% CAGR as China's grid-modernization and India's USD 1.4 trillion infrastructure pipeline absorb coated steel. ASEAN mega-projects such as Indonesia's Nusantara capital city multiply galvanized demand, while Japan and South Korea supply Zn-Al-Mg coating know-how. Regulatory pushes, China's dual-carbon smelter closures, and India's soil-health fertilizer incentives reinforce regional consumption.
North America benefits from the U.S. infrastructure law and Canada's low-carbon Trail smelter upgrade. South32's Hermosa project will add 150,000 t of refined output in 2027, reducing import reliance. Mexico's export-oriented auto lines keep galvanizers running near capacity, anchoring regional zinc flows.
Europe's CBAM, enforceable from 2026, lifts demand for certified low-carbon metal from Nyrstar, Boliden, and other compliant smelters. At the same time, Implementing Decisions 2024/367-368 compel plumbing manufacturers to validate zinc release below 5 mg L under the revised Drinking Water Directive, spurring alloy reformulations.
- Boliden Group
- Glencore
- Grupo Mexico
- Hudbay Minerals Inc.
- IVANHOE MINES
- KOREAZINC
- MMG Australia Limited
- Nexa
- Nyrstar
- South32
- Teck Resources Limited
- Vedanta Limited
- Volcan
Additional Benefits:
- The market estimate (ME) sheet in Excel format
- 3 months of analyst support
TABLE OF CONTENTS
1 Introduction
- 1.1 Study Assumptions and Market Definition
- 1.2 Scope of the Study
2 Research Methodology
3 Executive Summary
4 Market Landscape
- 4.1 Market Overview
- 4.2 Market Drivers
- 4.2.1 Infrastructure-led galvanizing demand surge
- 4.2.2 Growth of corrosion-resistant steel in EV and renewables
- 4.2.3 Expansion of zinc-based fertilisers in micronutrient-deficient soils
- 4.2.4 Emergence of zinc-ion and zinc-air batteries
- 4.2.5 EU drinking-water zinc-coated plumbing mandate
- 4.3 Market Restraints
- 4.3.1 Stringent environmental and ESG regulations
- 4.3.2 Price volatility from supply shocks and surpluses
- 4.3.3 Fertiliser heavy-metal limits curbing Zn sulphate
- 4.4 Value Chain Analysis
- 4.5 Porter's Five Forces
- 4.5.1 Bargaining Power of Suppliers
- 4.5.2 Bargaining Power of Buyers
- 4.5.3 Threat of New Entrants
- 4.5.4 Threat of Substitutes
- 4.5.5 Degree of Competition
5 Market Size and Growth Forecasts (Volume)
- 5.1 By Form
- 5.1.1 Refined Zinc (Slab)
- 5.1.2 Zinc Alloys
- 5.1.3 Zinc Compounds (Oxide, Sulfate, etc.)
- 5.1.4 Secondary/Recycled Zinc
- 5.2 By Production Process
- 5.2.1 Primary Production (Mining and Smelting)
- 5.2.2 Secondary Production (Recycling)
- 5.3 By Application
- 5.3.1 Galvanizing
- 5.3.2 Die-Casting
- 5.3.3 Brass
- 5.3.4 Zinc Oxide and Chemicals
- 5.3.5 Other Applications
- 5.4 By End-user Industry
- 5.4.1 Construction
- 5.4.2 Transportation
- 5.4.3 Electrical and Electronics
- 5.4.4 Consumer Goods
- 5.4.5 Other End-user Industries
- 5.5 By Geography
- 5.5.1 Asia-Pacific
- 5.5.1.1 China
- 5.5.1.2 India
- 5.5.1.3 Japan
- 5.5.1.4 South Korea
- 5.5.1.5 Indonesia
- 5.5.1.6 Malaysia
- 5.5.1.7 Thailand
- 5.5.1.8 Vietnam
- 5.5.1.9 Rest of Asia-Pacific
- 5.5.2 North America
- 5.5.2.1 United States
- 5.5.2.2 Canada
- 5.5.2.3 Mexico
- 5.5.3 Europe
- 5.5.3.1 Germany
- 5.5.3.2 United Kingdom
- 5.5.3.3 Italy
- 5.5.3.4 France
- 5.5.3.5 Russia
- 5.5.3.6 Spain
- 5.5.3.7 Turkey
- 5.5.3.8 NORDIC Countries
- 5.5.3.9 Rest of Europe
- 5.5.4 South America
- 5.5.4.1 Brazil
- 5.5.4.2 Argentina
- 5.5.4.3 Colombia
- 5.5.4.4 Rest of South America
- 5.5.5 Middle-East and Africa
- 5.5.5.1 Saudi Arabia
- 5.5.5.2 United Arab Emirates
- 5.5.5.3 Qatar
- 5.5.5.4 South Africa
- 5.5.5.5 Egypt
- 5.5.5.6 Nigeria
- 5.5.5.7 Rest of Middle-East and Africa
- 5.5.1 Asia-Pacific
6 Competitive Landscape
- 6.1 Market Concentration
- 6.2 Strategic Moves
- 6.3 Market Share(%)/Ranking Analysis
- 6.4 Company Profiles (includes Global level Overview, Market level overview, Core Segments, Financials as available, Strategic Information, Products and Services, Recent Developments)
- 6.4.1 Boliden Group
- 6.4.2 Glencore
- 6.4.3 Grupo Mexico
- 6.4.4 Hudbay Minerals Inc.
- 6.4.5 IVANHOE MINES
- 6.4.6 KOREAZINC
- 6.4.7 MMG Australia Limited
- 6.4.8 Nexa
- 6.4.9 Nyrstar
- 6.4.10 South32
- 6.4.11 Teck Resources Limited
- 6.4.12 Vedanta Limited
- 6.4.13 Volcan
7 Market Opportunities and Future Outlook
- 7.1 White-space and Unmet-Need Assessment

 2026-2030年全球鋅粉、鋅片和鋅粉市場
 檸檬酸鋅:市場佔有率分析、產業趨勢與統計、成長預測(2026-2031)
 鋅片塗層市場:全球市場預測,2026-2032年
 2026-2030年全球高純度鋅市場
 無機鋅塗佈市場機會、成長要素、產業趨勢分析及2026-2035年預測。
 全球丁香酚鋅市場規模、佔有率、趨勢和成長分析報告(2026-2034)ZDDP添加劑市場:依基礎油類型、添加劑形式、鋅濃度、應用和分銷管道分類-2026-2032年全球預測鋅市場:全球鋅市場預測(依產品類型、形態、應用、終端用戶產業和分銷管道分類)-2026年至2032年鍍鋅市場:依技術、製程、鍍層厚度、基材及應用分類-2026年至2032年全球預測
 2026年全球銅、鎳、鉛和鋅市場報告