

 |
市場調查報告書
商品編碼
2125577
雲端運算:市場佔有率分析、產業趨勢與統計、成長預測(2026-2031)Cloud Computing - Market Share Analysis, Industry Trends & Statistics, Growth Forecasts (2026 - 2031) |
||||||

※ 本網頁內容可能與最新版本有所差異。詳細情況請與我們聯繫。
根據 Mordor Intelligence 預測,雲端運算市場規模將從 2025 年的 8,600 億美元成長到 2026 年的 1.04 兆美元,到 2031 年將達到 2.65 兆美元,2026 年至 2031 年的複合年成長率為 20.65%。
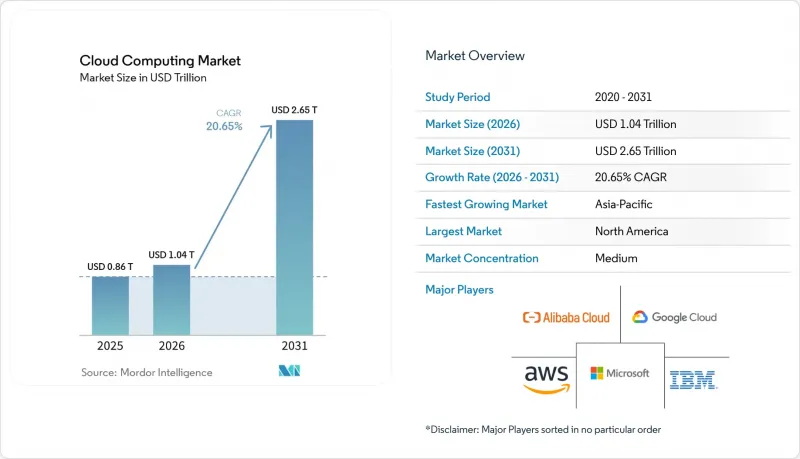
本報告按服務模式(IaaS、PaaS、SaaS)、部署模式(公共雲端、私有雲端、混合雲端)、最終用戶產業(IT和電信、銀行、金融服務和保險、製造業等)、組織規模(大型企業、中小企業)和地區進行細分。市場預測以價值(美元)表示。
全球雲端運算市場趨勢與洞察
SaaS在業務線軟體領域呈現爆炸性成長。
雲端遷移不再局限於旨在提高生產力的工作負載;它現在已擴展到關鍵業務的企業資源規劃 (ERP)、客戶關係管理 (CRM) 和財務系統,這種轉變正日益重塑整個雲端運算市場。 2024 年,Delta航空完成了一項耗資 5 億美元的數位核心系統升級,利用 SaaS 實現人工智慧驅動的個人化服務並提高準點率。此次轉型實現了持續的功能更新和嵌入式分析,從而能夠進行本地部署軟體無法實現的即時決策。受監管行業正受益於 SaaS 堆疊中內建的標準化合規管理,從而加快審計速度並降低營運成本。與優先採用 SaaS 的同業相比,延遲遷移的組織可能會面臨功能缺失和產品週期延長的風險。
生成式人工智慧工作負載激增,需要彈性運算
訓練大規模語言模式需要數千個高頻寬GPU運作,遠超過傳統企業工作負載的資源佔用。 Oracle已為其位於Oracle的德克薩斯州中心採購了價值400億美元的NVIDIA處理器,以支援OpenAI在2025年的運作。這種規模的擴展正在深刻地改變資料中心的電力、冷卻和網路架構設計。為了滿足日益成長的需求,供應商正在圍繞AI最佳化晶片、直接液冷和高速互連重新設計其架構。客戶正傾向於選擇能夠保證AI實驗和生產推理高峰期所需容量和優惠成本結構的供應商。
數據在地化法律阻礙全球發展
各司法管轄區的資料居住法規迫使服務提供者複製基礎設施並建構獨立的邏輯環境,從而增加成本和營運複雜性。跨國公司在儲存、處理和人員存取方面面臨重疊的義務,這往往迫使它們重新設計架構或提高服務價格。
細分市場分析
平台即服務 (PaaS) 預計將在 2026 年至 2031 年間以 22.85% 的複合年成長率 (CAGR) 成長,成為成長最快的服務模式。軟體即服務 (SaaS) 預計在 2025 年仍將佔據 52.87% 的市場佔有率,而基礎設施即服務 (IaaS) 仍然是其堅實的基礎。 PaaS 浪潮的驅動力來自容器編排管理、無伺服器運行時和低程式碼工具,這些工具將發布週期從數月縮短至數週。亞馬遜已撥款 1500 億美元用於以人工智慧為中心的資料中心,以支援這些 PaaS 工作負載。隨著服務提供者在其平台上整合更多內建安全和人工智慧服務,開發人員可以更專注於用戶價值,而無需陷入基礎設施細節的泥沼。
在雲端運算市場,PaaS 供應商正透過特定產業的框架和整合的 MLOps 功能來脫穎而出。這些功能縮短了部署高級分析所需的時間,提高了程式碼質量,並減輕了開發人員的負擔。這種組合使 PaaS 成為數位產品的策略工具,支援快速實驗和持續交付。
到 2025 年,私有雲端將佔總營收的 46.62%,而混合雲端的複合年成長率 (CAGR) 為 22.24%。這種模式允許企業將敏感工作負載保留在本地,同時利用公共雲端容量進行測試、分析和災害復原。隨著企業在其本地核心環境和外包容量中標準化 Kubernetes 控制平面,混合部署的雲端運算市場預計將快速成長。
Oracle與 AWS 的跨雲合作消除了資料匯出費用,並使Oracle資料庫能夠在任一雲端服務供應商上無縫運作。互通性降低了供應商鎖定風險,使客戶能夠根據效能和價格做出最佳選擇。因此,混合雲策略被視為合規性的安全閥,也是實現現代化的跳板,避免了高風險的大規模遷移(即「堆高機式遷移」)。
區域分析
預計到2025年,北美將佔全球營收的24.18%,這得益於其在雲端運算領域的早期領先地位以及眾多數位化原生企業的密集叢集。投資持續成長。亞馬遜正在賓州和北卡羅萊納州的園區投資300億美元,微軟則計畫在2025會計年度投資800億美元擴建園區。目前,該地區的成長主要由人工智慧工作負載驅動,這些工作負載需要接近性人才和研發設施。隨著企業為了實現冗餘和成本最佳化而分散工作負載,加拿大和墨西哥也正在帶來新的機會。
在歐洲,企業正努力在積極的數位轉型目標和嚴格的資料主權法規之間尋求平衡,這影響著該地區雲端運算市場的發展軌跡。企業傾向於採用混合架構,將敏感資料保留在本地,同時利用全球雲端進行開發和分析。 OVHcloud 等供應商資料保存作為其獨特的賣點。英國脫歐後的地緣政治格局變化迫使英國企業適應不斷變化的跨國數據協議,進一步加速了混合架構的普及。
亞太地區是未來成長的主要驅動力,預計將以21.65%的複合年成長率成長。基礎建設項目正在快速擴張,例如Sify計劃在印度投資50億美元建造一座專注於人工智慧的資料中心。雖然阿里雲和騰訊雲等國內巨頭主導中國市場,但國際供應商正將目光投向日本、韓國、印度以及快速成長的東南亞國協。各國政府正在推行「雲端優先」政策和智慧城市計劃,這加速了可擴展平台的需求。
其他好處:
- Excel格式的市場預測(ME)表
- 3個月的分析師支持
目錄
第1章:引言
- 研究假設和市場定義
- 調查範圍
第2章:調查方法
第3章執行摘要
第4章 市場狀況
- 市場概覽
- 市場促進因素
- 企業核心軟體領域SaaS的爆炸性成長
- 生成式人工智慧工作負載激增,需要彈性運算
- 產業專用的雲端平台(合規藍圖)
- 歐盟和海灣合作理事會的強制性主權雲
- 面向 XR 和自主運作的低於 10 毫秒邊緣雲區域的興起
- 綠色雲選擇標準與範圍 3 目標一致
- 市場限制因素
- 數據本地化法律正在擾亂全球企業發展。
- 運作成本超支與本地部署總擁有成本的比較
- 尖端晶片的出口限制限制了GPU的供應。
- 超大規模資料中心低碳電力短缺
- 供應鏈分析
- 監理情勢
- 技術展望
- 波特五力分析
- 市場宏觀經濟因素的評估
第5章 市場規模與成長預測
- 按服務模式
- IaaS
- PaaS
- SaaS
- 按部署模式
- 公共雲端
- 私有雲端
- 混合雲端
- 按行業分類的最終用戶
- 資訊科技/通訊
- BFSI
- 製造業
- 零售和消費品
- 醫療保健和生命科學
- 其他
- 按組織規模
- 大公司
- 小型企業
- 按地區
- 北美洲
- 美國
- 加拿大
- 墨西哥
- 南美洲
- 巴西
- 阿根廷
- 其他南美國家
- 歐洲
- 德國
- 英國
- 法國
- 義大利
- 西班牙
- 其他歐洲國家
- 亞太地區
- 中國
- 日本
- 印度
- 韓國
- 東南亞
- 其他亞太國家
- 中東和非洲
- 中東
- 沙烏地阿拉伯
- 阿拉伯聯合大公國
- 土耳其
- 其他中東國家
- 非洲
- 南非
- 奈及利亞
- 埃及
- 其他非洲國家
- 中東
- 北美洲
第6章 競爭情勢
- 市場集中度
- 策略趨勢
- 市佔率分析
- 公司簡介
- Amazon(AWS)
- Microsoft
- Google Cloud
- Alibaba Cloud
- IBM
- Oracle
- Salesforce
- SAP SE
- Adobe
- Tencent Cloud
- Huawei Cloud
- Rackspace
- VMware
- Snowflake
- Workday
- ServiceNow
- DigitalOcean
- OVHcloud
- Linode
- Nutanix
第7章 市場機會與未來展望
According to Mordor Intelligence, the cloud computing market size is expected to grow from USD 0.86 trillion in 2025 to USD 1.04 trillion in 2026 and is forecast to reach USD 2.65 trillion by 2031 at 20.65% CAGR over 2026-2031.
This report is Segmented by Service Model (IaaS, Paas, Saas). Deployment Model (Public Cloud, Private Cloud, Hybrid Cloud), End User Vertical (IT and Telecom, BFSI, Manufacturing, and More), Organization Size (Large Enterprises, Small and Mid-Sized Enterprises (SMEs)) and by Geography. The Market Forecasts are Provided in Terms of Value (USD).
Global Cloud Computing Market Trends and Insights
Explosive SaaS adoption in core enterprise software
Cloud migrations now encompass mission-critical enterprise-resource-planning, customer-relationship-management, and finance systems rather than only productivity workloads, a shift that is increasingly shaping the broader Cloud Computing Market. Delta Air Lines finalized a USD 500 million overhaul of its digital core in 2024, using SaaS to enable AI-driven personalization and punctuality improvements. The pivot delivers continuous feature updates and embedded analytics, unlocking real-time decision-making that on-premises software cannot match. Regulated sectors benefit from standardized compliance controls baked into SaaS stacks, accelerating audits and lowering operational overhead. Organizations delaying migration risk capability gaps and slower product cycles compared with SaaS-first peers
Proliferation of Gen-AI workloads demanding elastic compute
Large-language-model training requires thousands of high-bandwidth GPUs operating in parallel, dwarfing previous enterprise-workload footprints. Oracle reserved USD 40 billion worth of Nvidia processors for a Texas site supporting OpenAI in 2025. Such scale drives radical shifts in data-center power, cooling, and network fabric design. Providers are re-architecting around AI-optimized silicon, direct-liquid cooling, and high-speed interconnects to satisfy growing demand. Customers gravitate toward vendors able to guarantee capacity and favorable economics for bursty AI experiments and production inference.
Data-localization laws fragmenting global footprints
Jurisdiction-specific residency rules compel providers to duplicate infrastructure and create discrete logical environments, adding cost and operational complexity. Multinationals face overlapping obligations on storage, processing, and personnel access, often forcing architectural redesigns and higher service prices.
Other drivers and restraints analyzed in the detailed report include:
- Industry-specific cloud platforms (compliance-ready blueprints)
- Sovereign-cloud mandates in EU and GCC
- Run-rate cost overruns vs on-prem TCO
For complete list of drivers and restraints, kindly check the Table Of Contents.
Segment Analysis
Platform-as-a-Service is forecast to compound at 22.85% from 2026-2031, the quickest pace among service models. SaaS retained a commanding 52.87% of 2025 revenue, while Infrastructure-as-a-Service remains the elastic foundation underneath. The PaaS wave is fueled by container orchestration, serverless runtimes, and low-code tools that compress release cycles from months to weeks. Amazon earmarked USD 150 billion for AI-centric data centers catering to those PaaS workloads. As providers enrich platforms with built-in security and AI services, developers gain more freedom to focus on user value rather than plumbing.
In the cloud computing market, PaaS vendors increasingly differentiate through industry frameworks and integrated MLOps. These capabilities shorten deployment of advanced analytics, raise code quality, and reduce developer toil. The combination positions PaaS as a strategic lever for digital products, underpinning rapid experimentation and continuous delivery.
Although private clouds captured 46.62% revenue in 2025, hybrid clouds are expanding at 22.24% CAGR. The model preserves data closeness for sensitive workloads while bursting to public capacity for testing, analytics, and disaster recovery. The cloud computing market size for hybrid deployments is set to rise sharply as firms standardize Kubernetes control planes across on-premises cores and outsourced capacity.
Oracle's cross-cloud pact with AWS eliminates data-egress fees and permits Oracle Database to run seamlessly on either provider. Interoperability curbs vendor-lock fears and lets customers optimize on performance or price. Consequently, the hybrid strategy is viewed as a safety valve for compliance and a springboard for modernization without risky forklift migrations.
Complete Report Scope:
- By Service Model
- IaaS
- PaaS
- SaaS
- By Deployment Model
- Public Cloud
- Private Cloud
- Hybrid Cloud
- By End-user Vertical
- IT and Telecom
- BFSI
- Manufacturing
- Retail and Consumer Goods
- Healthcare and Life Sciences
- Others
- By Organisation Size
- Large Enterprises
- Small and Mid-Sized Enterprises (SMEs)
- By Geography
- North America
- United States
- Canada
- Mexico
- South America
- Brazil
- Argentina
- Rest of South America
- Europe
- Germany
- United Kingdom
- France
- Italy
- Spain
- Rest of Europe
- Asia-Pacific
- China
- Japan
- India
- South Korea
- Southeast Asia
- Rest of Asia-Pacific
- Middle East and Africa
- Middle East
- Saudi Arabia
- United Arab Emirates
- Turkey
- Rest of Middle East
- Africa
- South Africa
- Nigeria
- Egypt
- Rest of Africa
- Egypt
- Rest of Africa
- Middle East
- North America
Geography Analysis
North America commanded 24.18% of 2025 revenue thanks to an early lead in cloud adoption and dense clusters of digital-native enterprises. Investment continues: Amazon is channeling USD 30 billion into Pennsylvania and North Carolina campuses, while Microsoft plans USD 80 billion in fiscal-year 2025 capacity. Growth in the region now pivots around AI workloads that demand proximity to talent and research hubs. Canada and Mexico open incremental opportunities as firms spread workloads for redundancy and cost optimization.
Europe balances aggressive digital-transformation targets with stringent data-sovereignty rules, shaping the region's trajectory within the Cloud Computing Market. Organizations favor hybrid architectures that keep sensitive data local yet leverage global clouds for development and analytics. Providers such as OVHcloud emphasize European data residency as a unique selling point. Geopolitical shifts post-Brexit compel UK businesses to navigate evolving cross-border data agreements, further reinforcing hybrid adoption.
Asia-Pacific is the engine of future expansion, with a projected 21.65% CAGR. Infrastructure projects scale rapidly: Sify will invest USD 5 billion in Indian AI-focused data centers. Domestic champions such as Alibaba Cloud and Tencent Cloud dominate China, while international providers target Japan, South Korea, India, and fast-growing ASEAN states. Governments back cloud-first policies and smart-city programs, accelerating demand for scalable platforms.
- Amazon (AWS)
- Microsoft
- Google Cloud
- Alibaba Cloud
- IBM
- Oracle
- Salesforce
- SAP SE
- Adobe
- Tencent Cloud
- Huawei Cloud
- Rackspace
- VMware
- Snowflake
- Workday
- ServiceNow
- DigitalOcean
- OVHcloud
- Linode
- Nutanix
Additional Benefits:
- The market estimate (ME) sheet in Excel format
- 3 months of analyst support
TABLE OF CONTENTS
1 INTRODUCTION
- 1.1 Study Assumptions and Market Definition
- 1.2 Scope of the Study
2 RESEARCH METHODOLOGY
3 EXECUTIVE SUMMARY
4 MARKET LANDSCAPE
- 4.1 Market Overview
- 4.2 Market Drivers
- 4.2.1 Explosive SaaS adoption in core enterprise software
- 4.2.2 Proliferation of Gen-AI workloads demanding elastic compute
- 4.2.3 Industry-specific cloud platforms (compliance-ready blueprints)
- 4.2.4 Sovereign-cloud mandates in EU and GCC
- 4.2.5 Rise of less than 10 ms edge-cloud zones for XR and autonomous ops
- 4.2.6 Green-cloud buying criteria tied to Scope-3 targets
- 4.3 Market Restraints
- 4.3.1 Data-localisation laws fragmenting global footprints
- 4.3.2 Run-rate cost overruns vs on-prem TCO
- 4.3.3 Advanced chip export controls limiting GPU supply
- 4.3.4 Scarcity of low-carbon power for hyperscale DCs
- 4.4 Supply-Chain Analysis
- 4.5 Regulatory Landscape
- 4.6 Technological Outlook
- 4.7 Porter's Five Forces Analysis
- 4.7.1 Threat of New Entrants
- 4.7.2 Bargaining Power of Buyers
- 4.7.3 Bargaining Power of Suppliers
- 4.7.4 Threat of Substitutes
- 4.7.5 Competitive Rivalry
- 4.8 Assesment of Macroeconomic Factors on the market
5 MARKET SIZE AND GROWTH FORECASTS (VALUE)
- 5.1 By Service Model
- 5.1.1 IaaS
- 5.1.2 PaaS
- 5.1.3 SaaS
- 5.2 By Deployment Model
- 5.2.1 Public Cloud
- 5.2.2 Private Cloud
- 5.2.3 Hybrid Cloud
- 5.3 By End-user Vertical
- 5.3.1 IT and Telecom
- 5.3.2 BFSI
- 5.3.3 Manufacturing
- 5.3.4 Retail and Consumer Goods
- 5.3.5 Healthcare and Life Sciences
- 5.3.6 Others
- 5.4 By Organisation Size
- 5.4.1 Large Enterprises
- 5.4.2 Small and Mid-Sized Enterprises (SMEs)
- 5.5 By Geography
- 5.5.1 North America
- 5.5.1.1 United States
- 5.5.1.2 Canada
- 5.5.1.3 Mexico
- 5.5.2 South America
- 5.5.2.1 Brazil
- 5.5.2.2 Argentina
- 5.5.2.3 Rest of South America
- 5.5.3 Europe
- 5.5.3.1 Germany
- 5.5.3.2 United Kingdom
- 5.5.3.3 France
- 5.5.3.4 Italy
- 5.5.3.5 Spain
- 5.5.3.6 Rest of Europe
- 5.5.4 Asia-Pacific
- 5.5.4.1 China
- 5.5.4.2 Japan
- 5.5.4.3 India
- 5.5.4.4 South Korea
- 5.5.4.5 Southeast Asia
- 5.5.4.6 Rest of Asia-Pacific
- 5.5.5 Middle East and Africa
- 5.5.5.1 Middle East
- 5.5.5.1.1 Saudi Arabia
- 5.5.5.1.2 United Arab Emirates
- 5.5.5.1.3 Turkey
- 5.5.5.1.4 Rest of Middle East
- 5.5.5.2 Africa
- 5.5.5.2.1 South Africa
- 5.5.5.2.2 Nigeria
- 5.5.5.2.3 Egypt
- 5.5.5.2.4 Rest of Africa
- 5.5.5.2.5 Egypt
- 5.5.5.2.6 Rest of Africa
- 5.5.5.1 Middle East
- 5.5.1 North America
6 COMPETITIVE LANDSCAPE
- 6.1 Market Concentration
- 6.2 Strategic Moves
- 6.3 Market Share Analysis
- 6.4 Company Profiles (includes Global level Overview, Market level overview, Core Segments, Financials as available, Strategic Information, Market Rank/Share for key companies, Products and Services, and Recent Developments)
- 6.4.1 Amazon (AWS)
- 6.4.2 Microsoft
- 6.4.3 Google Cloud
- 6.4.4 Alibaba Cloud
- 6.4.5 IBM
- 6.4.6 Oracle
- 6.4.7 Salesforce
- 6.4.8 SAP SE
- 6.4.9 Adobe
- 6.4.10 Tencent Cloud
- 6.4.11 Huawei Cloud
- 6.4.12 Rackspace
- 6.4.13 VMware
- 6.4.14 Snowflake
- 6.4.15 Workday
- 6.4.16 ServiceNow
- 6.4.17 DigitalOcean
- 6.4.18 OVHcloud
- 6.4.19 Linode
- 6.4.20 Nutanix
7 MARKET OPPORTUNITIES AND FUTURE OUTLOOK
- 7.1 White-space and Unmet-Need Assessment

 2026-2030年全球政府部門人工智慧市場
 2026-2030年全球雲端運算市場
 雲端運算市場報告:趨勢、預測和競爭分析(至2035年)
 基於雲端的臨床試驗市場規模、佔有率和成長分析:按組件、部署類型、應用、最終用戶和地區分類-2026-2033年產業預測
 2026年全球國防雲端運算市場報告2026年全球軍用雲端運算市場報告
 行動雲端運算:市場佔有率分析、產業趨勢與統計及成長預測(2026-2031 年)QaaS(量子即服務)軟體平台:市場佔有率分析、行業趨勢和統計數據以及成長預測(2026-2031 年)
 雲端運算市場:按服務模式、部署模式、組織規模、應用程式和產業分類-2026-2032年全球市場預測
 2034年航太航太雲端運算市場預測-按服務模式、部署模式、功能、應用、最終用戶和區域分類的全球分析