


 |
市場調查報告書
商品編碼
2125564
德國離岸風力發電:市場佔有率分析、產業趨勢與統計及成長預測(2026-2031 年)Germany Offshore Wind Energy - Market Share Analysis, Industry Trends & Statistics, Growth Forecasts (2026 - 2031) |
||||||

※ 本網頁內容可能與最新版本有所差異。詳細情況請與我們聯繫。
根據 Mordor Intelligence 估計,到 2026 年,德國離岸風力發電市場規模將達到 12.41 吉瓦,高於 2025 年的 10.25 吉瓦,預計到 2031 年將達到 32.27 吉瓦。
預計從 2026 年到 2031 年,其複合年成長率將達到 21.06%。
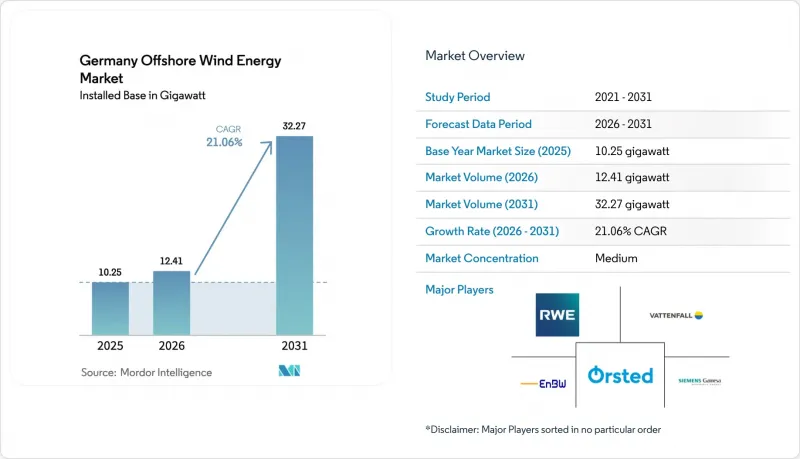
本報告按基礎類型(固定式和浮體式)、渦輪機輸出功率(3MW以下、3-6MW、6MW以上)和應用領域(公用事業規模、商業/工業、區域項目)進行分類。市場規模和預測以裝置容量(GW)為單位。
德國離岸風力發電市場趨勢與洞察
加速實現2030年達到30吉瓦的國家目標
為實現此聯邦目標(是先前承諾的兩倍),每年需要新增約3.1吉瓦的裝置容量,遠超過2023年不足300兆瓦的成長速度。德國聯邦海事和水文局已劃定特定建設區域,以幫助開發商更可靠地規劃設備訂單和投資。簡化的許可程序和提高競標透明度促使數吉瓦級項目激增,使德國離岸風力發電市場保持快速成長。各公司正在遊說加快電網接入,以便新增發電容量能夠為南部需求中心供電。實現這一目標將鞏固德國作為歐洲第二大海離岸風力發電市場的地位,僅次於英國。
由於渦輪機功率超過 14 兆瓦,平準化電力成本 (LCOE) 降低。
14-15兆瓦風力渦輪機的迅速普及提高了單機發電量,並縮短了電纜敷設距離。西門子歌美颯的「SG 14-222 DD」型風力渦輪機的年發電量比其前代產品——一台11兆瓦的機組——提高了25%。弗勞恩霍夫太陽能系統研究所(Fraunhofer ISE)預計,2024年德國離岸風電的平準化度電成本(LCOE)將在5.5至10.3歐分/千瓦時之間,這將使德國離岸風力發電的成本水準與燃氣發電相當。開發商傾向於使用更大的轉子,因為機組數量減少意味著起重機運作天數和船舶租賃期縮短,而這兩項正是建設預算中最昂貴的支出。這一趨勢有助於維持德國離岸風力發電市場的獲利能力,在該市場,零補貼競標正變得越來越普遍。
陸上輸電併網等待和瓶頸
由於海底電纜堵塞,TenneT公司在2024年切斷了其在北海9%的發電量。聯邦監管機構預測,到2045年,德國將需要新建50萬公里的輸電線路和變壓器。這一延誤推高了資金籌措成本,降低了產能利用率,並阻礙了正處於關鍵擴張階段的德國離岸風力發電市場的發展。
細分市場分析
2025年,固定式結構佔德國離岸風力發電市場84.68%的佔有率。這主要得益於博爾庫姆島和敘爾特島附近淺水區的開發,這些區域的單樁基礎平均成本為每兆瓦190萬至210萬歐元。萊茵集團(RWE)與Steelwind公司簽署的300個單樁基礎的預訂合約確保了供應至2027年,但由於歐洲鋼廠的產能利用率僅為85%,供不應求的徵兆已經顯現。如果供應短缺和鋼價飆升導致生產前置作業時間超過兩年,那麼向浮體式結構的過渡可能會加速。
預計到2025年,浮體式平台將佔據15.32%的市場佔有率,並在2031年之前以25.41%的複合年成長率成長。這主要得益於波羅的海和黑爾戈蘭島以西北海的建設項目,這些區域的水深超過50米等深線,有利於浮式平台的開發。雖然每兆瓦的資本成本仍維持在280萬至340萬歐元之間,但浮體式技術無需進行成本高昂的海底疏浚,使德國領海可開發海底面積擴大了40%。阿爾科納盆地即將進行的競標包括三個總裝置容量總合1.2吉瓦的純浮體式平台項目,預計將於2030年後通過BalWin 5併網。隨著風扇額定功率的提高,浮體式平台更高的額定容量將抵消其較高的初始成本,從而保持德國離岸風力發電市場的成長動能。
其他好處:
- Excel格式的市場預測(ME)表
- 3個月的分析師支持
目錄
第1章:引言
- 研究假設和市場定義
- 調查範圍
第2章:調查方法
第3章執行摘要
第4章 市場狀況
- 市場概覽
- 市場促進因素
- 加速實現2030年達到30吉瓦的國家目標
- 降低14兆瓦以上風力渦輪機的平準化發電成本
- 聯邦和州北海和波羅的海「2023年區域發展計畫」建設進度表
- 德國重工業企業間購電協議(PPA)的蓬勃發展
- 競標利用離岸風力發電氫氣的試點計畫(H2Global、AquaVentus)
- 數位化孿生運維平台可減少停機時間
- 市場限制因素
- 電網連接等待名單和陸上輸電瓶頸
- 冗長的海洋環境許可程序
- 重型裝運船隻和單樁工程供不應求
- 高利率環境給該專案的內部收益率(IRR)帶來了壓力。
- 供應鏈分析
- 監理情勢
- 技術展望
- 波特五力模型
- PESTLE分析
第5章 市場規模與成長預測
- 按地基類型分類
- 固定底部型
- 浮體式
- 按渦輪機容量
- 3兆瓦或以下
- 3~6 MW
- 6兆瓦或以上
- 透過使用
- 公用事業規模
- 商業和工業用途
- 社區計畫
- 按成分(定性分析)
- 機艙/渦輪機
- 刀刃
- 塔
- 發電機和齒輪箱
- Balance-of-System
- 其他(安裝、船舶、運作和維護等)
第6章 競爭情勢
- 市場集中度
- 策略趨勢(併購、聯盟、購電協議)
- 市場佔有率分析(主要公司的市場排名和佔有率)
- 公司簡介
- Orsted A/S
- RWE AG
- Vattenfall AB
- EnBW Energie Baden-Wurttemberg AG
- Siemens Gamesa Renewable Energy SA
- General Electric Company
- Nordex SE
- Enercon GmbH
- Vestas Wind Systems A/S
- PNE AG
- wpd AG
- Iberdrola Renovables Deutschland GmbH
- Equinor ASA
- Shell plc
- TotalEnergies SE
- Copenhagen Infrastructure Partners
- Parkwind NV
- EDF Renewables
- BP plc
- TenneT TSO GmbH
第7章 市場機會與未來展望
According to Mordor Intelligence, Germany offshore wind energy market size in 2026 is estimated at 12.41 gigawatt, growing from 2025 value of 10.25 gigawatt with 2031 projections showing 32.27 gigawatt, growing at 21.06% CAGR over 2026-2031.
This report is Segmented by Foundation Type (Fixed-Bottom and Floating), Turbine Capacity (Up To 3 MW, 3 To 6 MW, and Above 6 MW), and Application (Utility-Scale, Commercial and Industrial, and Community Projects). The Market Size and Forecasts are Provided in Terms of Installed Capacity (GW).
Germany Offshore Wind Energy Market Trends and Insights
Accelerated 30 GW-by-2030 National Target
The federal goal, doubled from its earlier pledge, obliges yearly additions near 3.1 GW, far above the sub-300 MW pace logged in 2023. The Federal Maritime and Hydrographic Agency has zoned precise build areas that let developers plan equipment orders and capital spending with more certainty. Faster permits and auction clarity are driving a queue of multi-gigawatt projects that will keep the German offshore wind energy market on its steep growth track. Companies are lobbying for quicker grid links so new capacity can feed demand centers in the south. Meeting the target cements Germany as Europe's second-largest offshore arena, below only the United Kingdom.
Falling Levelized Cost from>14 MW Turbines
Rapid adoption of 14-15 MW turbines lifts output per foundation and trims array-cable runs. Siemens Gamesa's SG 14-222 DD delivers 25% more annual energy than its 11 MW predecessor. Fraunhofer ISE pegs 2024 LCOE at 5.5-10.3 €c/kWh, putting offshore wind on par with gas-fired power in Germany. Developers favor bigger rotors because fewer units cut crane days and vessel charters, two of the priciest items in a build budget. The trend protects margins as zero-subsidy bids become common in the German offshore wind energy market.
Grid-Connection Queue & Onshore Transmission Bottlenecks
TenneT curtailed 9% of North Sea output in 2024 due to cable congestion. The federal regulator forecasts that 500,000 km of new lines plus transformers will be needed by 2045. Delays inflate financing costs and dent capacity factors, holding back the German offshore wind energy market during a critical scale-up phase.
Other drivers and restraints analyzed in the detailed report include:
- Federal-State North Sea-Baltic "Area Development Plan 2023" Build-out Timetable
- Corporate PPA Boom Among German Heavy Industry
- Heavy-Lift Vessel & Monopile Forging Scarcity
For complete list of drivers and restraints, kindly check the Table Of Contents.
Segment Analysis
Fixed-bottom structures represented 84.68% of the German offshore wind energy market in 2025, driven by shallow-water zones near Borkum and Sylt, where monopile costs average EUR 1.9-2.1 million per MW. RWE's 300-monopile reservation with Steelwind secures capacity through 2027 but signals scarcity, as European mills run at 85% utilization. Supply tightness and steel price inflation could accelerate the adoption of floating if fabrication lead times extend beyond two years.
Floating foundations held 15.32% in 2025 and are forecast to grow at a 25.41% CAGR through 2031, supported by Baltic sites beyond the 50-meter isobath and the North Sea west of Heligoland. Although the capital cost remains EUR 2.8-3.4 million per MW, floating technology eliminates costly seabed dredging and expands the developable seabed by 40% in German waters. Upcoming Arkona Basin tenders include three floating-specific zones totaling 1.2 GW, expected to connect through BalWin 5 after 2030. As turbine ratings climb, floating platforms' higher nameplate capacities could offset upfront cost premiums, sustaining momentum in the German offshore wind energy market.
Complete Report Scope:
- By Foundation Type
- Fixed-Bottom
- Floating
- By Turbine Capacity
- Up to 3 MW
- 3 to 6 MW
- Above 6 MW
- By Application
- Utility-scale
- Commercial and Industrial
- Community Projects
- By Component (Qualitative Analysis)
- Nacelle/Turbine
- Blade
- Tower
- Generator and Gearbox
- Balance-of-System
- Others (Installation, Vessels, O&M)
List of Companies Covered in this Report:
- Orsted A/S
- RWE AG
- Vattenfall AB
- EnBW Energie Baden-Wurttemberg AG
- Siemens Gamesa Renewable Energy S.A.
- General Electric Company
- Nordex SE
- Enercon GmbH
- Vestas Wind Systems A/S
- PNE AG
- wpd AG
- Iberdrola Renovables Deutschland GmbH
- Equinor ASA
- Shell plc
- TotalEnergies SE
- Copenhagen Infrastructure Partners
- Parkwind NV
- EDF Renewables
- BP plc
- TenneT TSO GmbH
Additional Benefits:
- The market estimate (ME) sheet in Excel format
- 3 months of analyst support
TABLE OF CONTENTS
1 Introduction
- 1.1 Study Assumptions & Market Definition
- 1.2 Scope of the Study
2 Research Methodology
3 Executive Summary
4 Market Landscape
- 4.1 Market Overview
- 4.2 Market Drivers
- 4.2.1 Accelerated 30 GW-by-2030 national target
- 4.2.2 Falling levelized cost from >14 MW turbines
- 4.2.3 Federal-state North Sea - Baltic "Area Development Plan 2023" build-out timetable
- 4.2.4 Corporate PPA boom among German heavy industry
- 4.2.5 Offshore wind-to-hydrogen pilot tenders (H2Global, AquaVentus)
- 4.2.6 Digital-twin O&M platforms cutting downtime
- 4.3 Market Restraints
- 4.3.1 Grid-connection queue & onshore transmission bottlenecks
- 4.3.2 Lengthy maritime environmental permitting
- 4.3.3 Heavy-lift vessel & monopile forging scarcity
- 4.3.4 High interest-rate environment squeezing project IRRs
- 4.4 Supply-Chain Analysis
- 4.5 Regulatory Landscape
- 4.6 Technological Outlook
- 4.7 Porter's Five Forces
- 4.7.1 Threat of New Entrants
- 4.7.2 Bargaining Power of Suppliers
- 4.7.3 Bargaining Power of Buyers
- 4.7.4 Threat of Substitutes
- 4.7.5 Competitive Rivalry
- 4.8 PESTLE Analysis
5 Market Size & Growth Forecasts
- 5.1 By Foundation Type
- 5.1.1 Fixed-Bottom
- 5.1.2 Floating
- 5.2 By Turbine Capacity
- 5.2.1 Up to 3 MW
- 5.2.2 3 to 6 MW
- 5.2.3 Above 6 MW
- 5.3 By Application
- 5.3.1 Utility-scale
- 5.3.2 Commercial and Industrial
- 5.3.3 Community Projects
- 5.4 By Component (Qualitative Analysis)
- 5.4.1 Nacelle/Turbine
- 5.4.2 Blade
- 5.4.3 Tower
- 5.4.4 Generator and Gearbox
- 5.4.5 Balance-of-System
- 5.4.6 Others (Installation, Vessels, O&M)
6 Competitive Landscape
- 6.1 Market Concentration
- 6.2 Strategic Moves (M&A, Partnerships, PPAs)
- 6.3 Market Share Analysis (Market Rank/Share for key companies)
- 6.4 Company Profiles (includes Global level Overview, Market level overview, Core Segments, Financials as available, Strategic Information, Products & Services, and Recent Developments)
- 6.4.1 Orsted A/S
- 6.4.2 RWE AG
- 6.4.3 Vattenfall AB
- 6.4.4 EnBW Energie Baden-Wurttemberg AG
- 6.4.5 Siemens Gamesa Renewable Energy S.A.
- 6.4.6 General Electric Company
- 6.4.7 Nordex SE
- 6.4.8 Enercon GmbH
- 6.4.9 Vestas Wind Systems A/S
- 6.4.10 PNE AG
- 6.4.11 wpd AG
- 6.4.12 Iberdrola Renovables Deutschland GmbH
- 6.4.13 Equinor ASA
- 6.4.14 Shell plc
- 6.4.15 TotalEnergies SE
- 6.4.16 Copenhagen Infrastructure Partners
- 6.4.17 Parkwind NV
- 6.4.18 EDF Renewables
- 6.4.19 BP plc
- 6.4.20 TenneT TSO GmbH
7 Market Opportunities & Future Outlook
- 7.1 White-space & Unmet-Need Assessment

 2026 年至 2034 年離岸風力發電機錐形貫入試驗的市場規模、佔有率、成長、全球產業分析、區域趨勢與預測。
 全球離岸風力發電市場:按組件、水深、基礎類型、風機額定功率和地區分類-預測至2035年
 離岸風力發電市場:按組件、基礎類型、渦輪機功率、應用和最終用戶分類-2026-2032年全球市場預測2026-2034年全球離岸風力發電電纜市場規模、佔有率、趨勢和成長分析報告
 離岸風力發電市場預測-按組件、位置、最終用戶和地區分類的全球分析-2034年
 離岸風力發電:市場佔有率分析、產業趨勢與統計及成長預測(2026-2031)
 離岸風力發電市場:依安裝地點、組件和區域分類離岸風力發電市場:依基礎類型、組件、安裝地點和區域分類
 2026年全球離岸風電市場報告
 離岸風力發電市場報告:按組件、基礎類型、容量、位置和地區分類(2026-2034 年)