


 |
市場調查報告書
商品編碼
2061632
離岸風力發電:市場佔有率分析、產業趨勢與統計及成長預測(2026-2031)Offshore Wind Energy - Market Share Analysis, Industry Trends & Statistics, Growth Forecasts (2026 - 2031) |
||||||
※ 本網頁內容可能與最新版本有所差異。詳細情況請與我們聯繫。
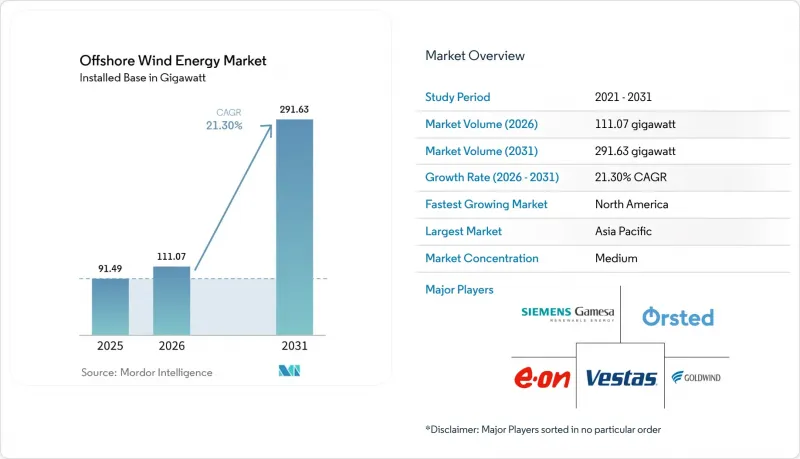
據 Mordor Intelligence 稱,2025 年離岸風力發電市場價值為 91.49 吉瓦,預計到 2031 年將達到 291.63 吉瓦,而 2026 年為 111.07 吉瓦,預測期(2026-2031 年)的複合年成長率為 21.30%。
本報告按基礎類型(固定式和浮體式)、渦輪機功率(3MW以下、3-6MW、6MW以上)、應用領域(公用事業規模、商業/工業、區域項目)以及地區(北美、歐洲、亞太、南美、中東和非洲)進行細分。市場規模和預測均以裝置容量(GW)為基礎。
全球離岸風力發電市場趨勢及洞察
平準化能源成本的快速下降正在推動市場加速成長。
成本已突破關鍵閾值。到2024年,離岸風電價格將達到0.075美元/kWh時,屆時新建離岸風力發電電場的價格在許多地區將與聯合循環燃氣電場的價格相當甚至更低。高功率渦輪機、大規模生產和更短的安裝時間將使專案總工期縮短高達30%,從而顯著提高開發商的盈利。曾經被認為無利可圖的浮體式項目,隨著學習曲線的推進和全球保險公司擴大深海域風險,資本支出(CAPEX)的下降正使其接近盈虧平衡點。供應商普遍認為,本世紀內價格低於0.060美元/千瓦時是現實可行的,這將鞏固離岸風力發電市場作為可與基荷電源相媲美的可再生能源選擇的地位。
政府正在加速引入競標制度。
透過競爭性競標,僅在2024年,歐洲就授予了23.2吉瓦的裝置容量。這比去年成長了40%,並建立了一個持續20多年的可預測現金流結構。丹麥創紀錄的低結算價格反映了其對成熟供應鏈的信心,而日本最新的1.8吉瓦框架協議則凸顯了亞洲對承包解決方案的強勁需求。德國透過將電網開發義務與招標公告掛鉤,進一步強化了這種模式,從而降低了限電風險並增加了資金籌措可能性。
安裝船短缺限制了成長。
全球能夠安裝15兆瓦風力渦輪機的自升式平台和重型裝運船隻不足50艘,這使得每日租金高達50萬至70萬美元,並在施工旺季可能導致工期延誤12至24個月。 《瓊斯法案》進一步限制了供應,禁止外國船舶在美國水域作業,迫使開發商探索支線駁船方案和模組化組裝以確保工期。
細分市場分析
至2025年,固定平台將佔離岸風電裝置總量的99.62%。這反映了製造商網路的成熟以及適用於60米水深的安裝速度。雖然這種配置能夠支援整個離岸風力發電市場的大型項目,但一旦風力渦輪機的輸出功率超過15兆瓦,單樁直徑就接近其實際應用極限。在岩石海底,導管架仍然必不可少,而重力式和吸力式解決方案則適用於特殊的地質環境。
浮體式(半潛式、立柱式浮標、張力腿式)平台正以42.1%的複合年成長率快速擴張,開闢了100米或更深海域的開發區域,這些區域的風力更為穩定,授權門檻也更低。蘇格蘭高風電場65%的產能利用率凸顯了深海風電的經濟可行性。目前,加州、韓國和日本的租賃競標均針對浮體式,這一發展勢頭有望使浮體式平台在2020年代末的離岸風力發電市場佔據兩位數的佔有率。
區域分析
到2025年,亞太地區將佔離岸風電市場榜首,市佔率高達54.35%。這主要得益於中國35吉瓦的裝置容量以及國產20兆瓦級風力發電機組(這些機組來自日益自動化的生產線)。日本第三次競標(1.8吉瓦)為歐美開發商進入深海域鋪平了道路,而台灣第三階段上網電價補貼計畫儘管面臨電網延誤,也展現出韌性。越南、印度和澳洲正在製定海底租賃框架,預計在2030年代初期形成大規模的計畫儲備。
北美地區成長速度最快,年複合成長率高達103.6%。美國聯邦政府設定的30吉瓦裝機容量目標,得益於海洋能源管理局(BOEM)高效的進度安排、各省總合17吉瓦的招標項目,以及國內造船業為保障供應鏈免受匯率衝擊所做出的努力。加拿大在評估了其超過4000吉瓦的技術潛力後,計劃在大西洋和太平洋地區取得風能租賃權。同時,墨西哥和巴西正在評估風能條件,為未來的競標做準備。
儘管市佔率有所下降,歐洲仍保持著技術領先地位。英國12吉瓦的採購計畫、德國的創新競標以及丹麥創紀錄的低價都凸顯了該地區的韌性。開發商目前正將目光投向凱爾特海、挪威烏齊拉北部和西班牙加那利群島的浮動式風力發電,以開發高功率的風電場並維持以出口為導向的供應中心。
其他好處:
- Excel格式的市場預測(ME)表
- 3個月的分析師支持
目錄
第1章:引言
- 研究假設和市場定義
- 調查範圍
第2章:調查方法
第3章執行摘要
第4章 市場狀況
- 市場概覽
- 市場促進因素
- 平準化能源成本快速下降
- 政府競標制度及固定價格採購制度
- 渦輪機尺寸增加至15兆瓦以上
- 可再生能源企業購電協議(PPA)
- 2030年後第一階段風力發電廠的設備升級
- 離岸風力發電和氫能混合項目
- 市場限制因素
- 安裝船短缺
- 電網連接瓶頸
- 水下礦產權利糾紛
- 維運人才儲備有限
- 供應鏈分析
- 監理情勢
- 技術展望
- 波特五力模型
第5章 市場規模與成長預測
- 按地基類型分類
- 固定類型
- 單樁
- 夾克
- 重力型
- 三腳架/三腳架類型
- 吸水桶
- 浮動的
- 半潛式
- 浮標
- 張力腳平臺(TLP)
- 駁船
- 固定類型
- 按渦輪機容量
- 3兆瓦或以下
- 3~6 MW
- 超過6兆瓦
- 透過使用
- 公用事業規模
- 商業和工業用途
- 區域項目
- 按成分(定性分析)
- 機艙/渦輪機
- 刀刃
- 塔
- 發電機和齒輪箱
- 基礎
- 系統平衡
- 其他(安裝、船舶、維運)
- 按地區
- 北美洲
- 美國
- 其他北美國家
- 歐洲
- 德國
- 法國
- 英國
- 西班牙
- 北歐國家
- 義大利
- 荷蘭
- 比利時
- 其他歐洲國家
- 亞太地區
- 中國
- 印度
- 日本
- 韓國
- 越南
- 其他亞太國家
- 南美洲
- 巴西
- 阿根廷
- 其他南美國家
- 中東和非洲
- 沙烏地阿拉伯
- 阿拉伯聯合大公國
- 南非
- 其他中東和非洲國家
- 北美洲
第6章 競爭情勢
- 市場集中度
- 策略趨勢(併購、聯盟、購電協議)
- 市場佔有率分析(主要公司的市場排名和佔有率)
- 公司簡介
- Siemens Gamesa Renewable Energy SA
- Vestas Wind Systems AS
- GE Vernova(GE Renewable Energy)
- Xinjiang Goldwind Science & Technology Co Ltd
- Ming Yang Smart Energy Group Ltd.
- Shanghai Electric Wind Power
- Nordex SE
- China Three Gorges Corp.
- State Power Investment Corp.(SPIC)
- Envision Energy Ltd.
- Orsted AS
- Equinor ASA
- Northland Power Inc.
- EDF SA
- E.ON SE
- RWE AG
- Iberdrola SA
- Copenhagen Infrastructure Partners
- BP plc
- TotalEnergies SE
- Shell plc
- Dominion Energy
- Ocean Winds(EDP & Engie JV)
第7章 市場機會與未來展望
According to Mordor Intelligence, the offshore wind energy market size was valued at 91.49 gigawatt in 2025 and estimated to grow from 111.07 gigawatt in 2026 to reach 291.63 gigawatt by 2031, at a CAGR of 21.30% during the forecast period (2026-2031).
This report is Segmented by Foundation Type (Fixed and Floating), Turbine Capacity (Up To 3 MW, 3 To 6 MW, and Above 6 MW), Application (Utility-Scale, Commercial and Industrial, and Community Projects), and Geography (North America, Europe, Asia-Pacific, South America, and Middle East and Africa). The Market Sizes and Forecasts are Provided in Terms of Installed Capacity (GW).
Global Offshore Wind Energy Market Trends and Insights
Rapid decline in LCOE drives market acceleration
Costs have crossed a critical threshold: at USD 0.075/kWh in 2024, new arrays equal or beat combined-cycle gas plants on price in multiple regions. Higher-rated turbines, serial fabrication, and shorter installation windows cut overall project timelines by up to 30% and materially improve developer returns. Floating projects once deemed uneconomic are approaching breakeven as learning curves trim capex and as global insurers underwrite deeper-water risks. Consensus among equipment vendors places sub-USD 0.060/kWh pricing within reach this decade, solidifying the offshore wind energy market as a go-to baseload-like renewable option.
Government auction mechanisms accelerate deployment
Competitive tenders awarded 23.2 GW across Europe in 2024 alone, a 40% year-on-year leap that extended predictable cash-flow regimes for twenty years or more. Denmark's record-low clearing price signaled confidence in supply-chain maturity, while Japan's latest 1.8 GW tranche showcased Asia's appetite for turnkey solutions. Germany strengthens the model by synchronizing grid build-out obligations with award announcements, reducing curtailment risk and lifting bankability.
Shortage of installation vessels constrains growth
Fewer than fifty jack-up and heavy-lift ships can erect 15 MW turbines worldwide, pushing day-rates to USD 500,000-700,000 and risking 12- to 24-month delays in crowded construction seasons. The Jones Act tightens supply further by capping foreign-flag work inside U.S. waters, so developers are experimenting with feeder-barge concepts and modular assembly to stay on schedule.
Other drivers and restraints analyzed in the detailed report include:
- Turbine upsizing transforms project economics
- Corporate PPAs reshape demand dynamics
- Grid connection infrastructure lags development
For complete list of drivers and restraints, kindly check the Table Of Contents.
Segment Analysis
Fixed platforms secured 99.62% of installations in 2025, reflecting proven fabricator networks and installation speeds suited to 60-m depths. This configuration underpins core projects across the offshore wind energy market, but monopile diameter is approaching practical limits as turbines surpass 15 MW. Jackets remain essential in rocky seabeds, while gravity and suction solutions service niche geological settings.
Floating (semi-submersibles, spar-buoys, and tension-leg) platforms are scaling at a 42.1% CAGR, opening 100-m-plus depths where winds blow steadier and permitting hurdles to ease. Hywind Scotland's 65% capacity factor validates the economics of deep-water generation. California, South Korea, and Japan now run floating-only lease rounds, creating tailwinds that could lift the floating slice of the offshore wind energy market to double digits by decade-end.
Geography Analysis
Asia-Pacific sat atop the offshore wind energy market with 54.35% share in 2025, propelled by China's 35 GW fleet and 20 MW domestic turbines that roll off increasingly automated lines. Japan's 1.8 GW Round 3 opened deep waters to European and U.S. developers, and Taiwan's Phase 3 feed-in model shows resilience despite grid delays. Vietnam, India, and Australia are crafting seabed-leasing frameworks that could unlock substantial pipelines by the early 2030s.
North America posts the fastest growth curve at 103.6% CAGR. The 30 GW U.S. federal goal is backed by streamlined Bureau of Ocean Energy Management (BOEM) timelines, state solicitations totaling 17 GW, and domestic vessel construction that shields the supply chain from currency shocks. Canada eyes Atlantic and Pacific leases after mapping more than 4,000 GW of technical potential, while Mexico and Brazil assess wind regimes ahead of potential auctions.
Europe retains technological leadership even as its market share dips. A 12 GW UK procurement queue, Germany's innovation auctions, and Denmark's record-low prices underscore the region's depth. Developers now look to floating turbines in the Celtic Sea, Norway's Utsira Nord, and Spain's Canary Islands to tap higher-yield sites and sustain export-oriented supply hubs.
- Siemens Gamesa Renewable Energy SA
- Vestas Wind Systems AS
- GE Vernova (GE Renewable Energy)
- Xinjiang Goldwind Science & Technology Co Ltd
- Ming Yang Smart Energy Group Ltd.
- Shanghai Electric Wind Power
- Nordex SE
- China Three Gorges Corp.
- State Power Investment Corp. (SPIC)
- Envision Energy Ltd.
- Orsted AS
- Equinor ASA
- Northland Power Inc.
- EDF SA
- E.ON SE
- RWE AG
- Iberdrola SA
- Copenhagen Infrastructure Partners
- BP plc
- TotalEnergies SE
- Shell plc
- Dominion Energy
- Ocean Winds (EDP & Engie JV)
Additional Benefits:
- The market estimate (ME) sheet in Excel format
- 3 months of analyst support
TABLE OF CONTENTS
1 Introduction
- 1.1 Study Assumptions & Market Definition
- 1.2 Scope of the Report
2 Research Methodology
3 Executive Summary
4 Market Landscape
- 4.1 Market Overview
- 4.2 Market Drivers
- 4.2.1 Rapid decline in LCOE
- 4.2.2 Government auction schemes & FITs
- 4.2.3 Turbine upsizing to 15 MW+
- 4.2.4 Corporate PPAs for renewables
- 4.2.5 Repowering of first-wave farms post-2030
- 4.2.6 Offshore-to-hydrogen hybrid projects
- 4.3 Market Restraints
- 4.3.1 Shortage of installation vessels
- 4.3.2 Grid-connection bottlenecks
- 4.3.3 Seabed-mineral rights conflicts
- 4.3.4 Limited O&M workforce pool
- 4.4 Supply-Chain Analysis
- 4.5 Regulatory Landscape
- 4.6 Technological Outlook
- 4.7 Porters Five Forces
- 4.7.1 Bargaining Power of Suppliers
- 4.7.2 Bargaining Power of Buyers
- 4.7.3 Threat of New Entrants
- 4.7.4 Threat of Substitutes
- 4.7.5 Intensity of Competitive Rivalry
5 Market Size & Growth Forecasts
- 5.1 By Foundation Type
- 5.1.1 Fixed
- 5.1.1.1 Monopile
- 5.1.1.2 Jacket
- 5.1.1.3 Gravity-Based
- 5.1.1.4 Tripod/Tripile
- 5.1.1.5 Suction Bucket
- 5.1.2 Floating
- 5.1.2.1 Semi-submersible
- 5.1.2.2 Spar-Buoy
- 5.1.2.3 Tension-Leg Platform (TLP)
- 5.1.2.4 Barge
- 5.1.1 Fixed
- 5.2 By Turbine Capacity
- 5.2.1 Up to 3 MW
- 5.2.2 3 to 6 MW
- 5.2.3 Above 6 MW
- 5.3 By Application
- 5.3.1 Utility-scale
- 5.3.2 Commercial and Industrial
- 5.3.3 Community Projects
- 5.4 By Component (Qualitative Analysis)
- 5.4.1 Nacelle/Turbine
- 5.4.2 Blade
- 5.4.3 Tower
- 5.4.4 Generator and Gearbox
- 5.4.5 Foundations
- 5.4.6 Balance-of-System
- 5.4.7 Others (Installation, Vessels, O&M)
- 5.5 By Geography
- 5.5.1 North America
- 5.5.1.1 United States
- 5.5.1.2 Rest of North America
- 5.5.2 Europe
- 5.5.2.1 Germany
- 5.5.2.2 France
- 5.5.2.3 United Kingdom
- 5.5.2.4 Spain
- 5.5.2.5 NORDIC Countries
- 5.5.2.6 Italy
- 5.5.2.7 Netherlands
- 5.5.2.8 Belgium
- 5.5.2.9 Rest of Europe
- 5.5.3 Asia-Pacific
- 5.5.3.1 China
- 5.5.3.2 India
- 5.5.3.3 Japan
- 5.5.3.4 South Korea
- 5.5.3.5 Vietnam
- 5.5.3.6 Rest of Asia-Pacific
- 5.5.4 South America
- 5.5.4.1 Brazil
- 5.5.4.2 Argentina
- 5.5.4.3 Rest of South America
- 5.5.5 Middle East and Africa
- 5.5.5.1 Saudi Arabia
- 5.5.5.2 United Arab Emirates
- 5.5.5.3 South Africa
- 5.5.5.4 Rest of Middle East and Africa
- 5.5.1 North America
6 Competitive Landscape
- 6.1 Market Concentration
- 6.2 Strategic Moves (M&A, Partnerships, PPAs)
- 6.3 Market Share Analysis (Market Rank/Share for key companies)
- 6.4 Company Profiles (includes Global level Overview, Market level overview, Core Segments, Financials as available, Strategic Information, Products & Services, and Recent Developments)
- 6.4.1 Siemens Gamesa Renewable Energy SA
- 6.4.2 Vestas Wind Systems AS
- 6.4.3 GE Vernova (GE Renewable Energy)
- 6.4.4 Xinjiang Goldwind Science & Technology Co Ltd
- 6.4.5 Ming Yang Smart Energy Group Ltd.
- 6.4.6 Shanghai Electric Wind Power
- 6.4.7 Nordex SE
- 6.4.8 China Three Gorges Corp.
- 6.4.9 State Power Investment Corp. (SPIC)
- 6.4.10 Envision Energy Ltd.
- 6.4.11 Orsted AS
- 6.4.12 Equinor ASA
- 6.4.13 Northland Power Inc.
- 6.4.14 EDF SA
- 6.4.15 E.ON SE
- 6.4.16 RWE AG
- 6.4.17 Iberdrola SA
- 6.4.18 Copenhagen Infrastructure Partners
- 6.4.19 BP plc
- 6.4.20 TotalEnergies SE
- 6.4.21 Shell plc
- 6.4.22 Dominion Energy
- 6.4.23 Ocean Winds (EDP & Engie JV)
7 Market Opportunities & Future Outlook
- 7.1 White-space & Unmet-need Assessment
 2026-2034年全球離岸風力發電電纜市場規模、佔有率、趨勢和成長分析報告
 離岸風力發電市場預測-按組件、位置、最終用戶和地區分類的全球分析-2034年
 離岸風力發電市場:按組件、基礎類型、渦輪機功率、應用和最終用戶分類-2026-2032年全球市場預測
 離岸風力發電市場:依基礎類型、組件、安裝地點和區域分類
 2026年全球離岸風電市場報告
 離岸風力發電市場報告:按組件、基礎類型、容量、位置和地區分類(2026-2034 年)離岸風力發電單樁市場依結構類型、水深等級、風扇容量等級及最終用戶分類,2026-2032年預測
 離岸風力發電市場機會、成長要素、產業趨勢分析及2026年至2035年預測近期技術發展及電力製X路徑的技術經濟評估離岸風力發電貫入試驗市場規模、佔有率、成長及全球產業分析:按類型、應用和地區的洞察,2026-2034年預測