


 |
市場調查報告書
商品編碼
2125554
輕型商用車(LCV):市場佔有率分析、行業趨勢和統計數據、成長預測(2026-2031 年)Light Commercial Vehicles - Market Share Analysis, Industry Trends & Statistics, Growth Forecasts (2026 - 2031) |
||||||

※ 本網頁內容可能與最新版本有所差異。詳細情況請與我們聯繫。
根據 Mordor Intelligence 預測,輕型商用車 (LCV) 市場規模預計將從 2025 年的 4,954.4 億美元成長到 2026 年的 5,257.1 億美元,到 2031 年將達到 7071.7 億美元,2026 年至 2031 年的複合成長率為 11%。
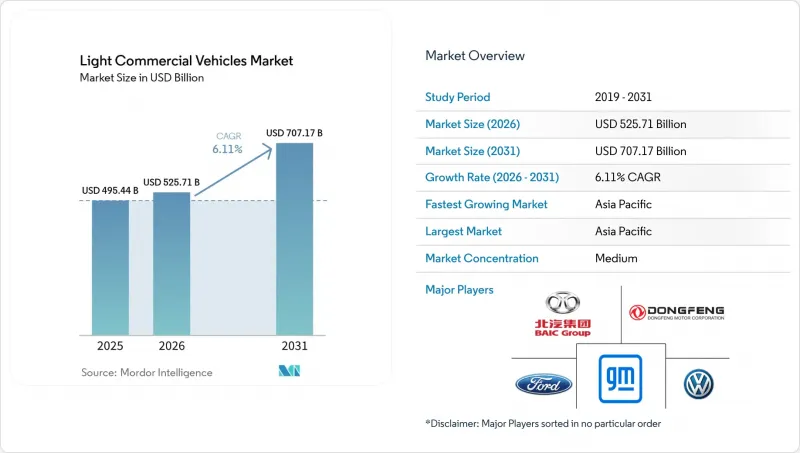
本報告按車輛類型(皮卡和廂型車)、動力類型(內燃機、混合動力、純電動、燃料電池電動)、應用領域(商業配送和物流等)、所有權類型(車隊所有權等)、負載容量(2.5噸以下和2.5噸以上)以及地區進行分類。市場預測以價值(美元)和銷售(輛)為單位呈現。
全球輕型商用車(LCV)市場趨勢與洞察
嚴格的全球二氧化碳和氮氧化物排放法規,輔以財政獎勵
從2025年中期開始,歐盟7排放標準將強制要求在實際駕駛過程中大幅降低氮氧化物(NOx)排放量,其排放量遠低於先前的歐6d-TEMP標準。預計這項變更將顯著增加柴油車的後處理成本,從而縮小柴油車和純電動貨車之間的價格差距。在中國,一項雙積分制(每售出一輛零排放輕型商用車(LCV)即可獲得額外積分)正在鼓勵製造商並促進新能源汽車的生產。美國環保署(EPA)適用於未來車型的第三階段溫室氣體排放法規為輕型卡車設定了雄心勃勃的二氧化碳減排目標,間接刺激了電動車的市場佔有率。同樣,印度的「Bharat Stage VI Phase 2」進一步收緊了顆粒物排放限制,並強制要求安裝車載診斷系統,加速了符合歐盟4標準的舊款車輛的淘汰。預計輕型商用車市場將受到這些不斷變化的排放氣體法規以及由此帶來的向更清潔車輛技術的轉型的影響。
最後一公里電子商務需求的爆炸性成長
2024年、米国のEコマース取引は重要な節目を迎え、小売売上高全体の相当な割合を占めるようになりました。特に注目すべきは、この浸透率がわずかに上昇するだけでも、追加のバンやピックアップトラックに対するかなりの需要につながるという点です。フリート運営事業者は現在、荷物の積み下ろしを容易にする低い荷台床、路肩でのアクセスを便利にするサイドドア、そして業務サイクルを支える十分な実走行航続距離といった機能を優先しています。2024年半ばまでに、アマゾンはリヴィアン製の電気配送バンを多数導入しました。これにより、ブレーキやトランスミッションの摩耗が減少したため、改造されたディーゼル車と比較して、1マイルあたりの運用コストを大幅に削減することに成功しました。活気ある都市區での車両利用率が上昇し続ける中、更換サイクルは大幅に短縮されています。この小型商用車(LCV)市場における更換の加速により、主要な自動車メーカーでは訂單残が増加傾向にあります。
儘管電池價格下降,但電動車的初始成本仍然很高。
電動貨車比柴油車貴得多。這主要是因為研發成本分攤到銷售較少的車輛上,以及更高的保固儲備。 2024年,福特的入門車型E-Transit的價格遠高於其柴油版車型Transit。如此巨大的價格差異為資本預算有限的企業帶來了挑戰。在印度,即使計入補貼,塔塔Ace EV的售價也遠高於傳統的內燃機版Ace,而充電樁的額外成本進一步拉大了這一差距。在歐洲,二手電動車的價格在2024年大幅下降,同時租賃價格也降低,融資管道也趨於緊縮。
細分市場分析
到2025年,皮卡車將佔據輕型商用車(LCV)市場45.57%的佔有率。同時,受超低排放區實施後,市場對能夠輕鬆適應狹窄路邊空間的緊湊型、空氣動力學效率高的車輛的需求推動,廂式貨車預計將以6.15%的複合排放氣體成長至2031年。輕型商用車(LCV)市場中的廂型車細分市場預計將比其他任何細分市場成長更快,而續航里程達150-200英里的電池式電動車(BEV)車型的出現正在進一步推動這一趨勢。
フォードの「F-150ライトニング」は、現場での電力供給機能によりピックアップトラックの役割が多様化していることを示していますが、一方で、大手宅配業者は、1平方公尺あたりの負載容量を最大化するハイキューブ型バンを好んでいます。欧州では、ステランティスの「e-ベルリンゴ」のようなコンパクトモデルが市街地で活躍している一方、中型バンは生鮮食品や小包裹の輸送分野を支配しています。技術者と工具を乗せられるクルーキャブ型バンはカテゴリーの境界線を曖昧にしており、小型商用車(LCV)市場における使用事例の融合を浮き彫りにしています。
内燃機関車は、既存のサービスネットワークと長距離走行の柔軟性に支えられ、2025年の生産台数の77.81%を占めています。それにもかかわらず、セクション45Wやユーロ7の規制が総コスト計算に圧力をかける中、電気自動車(EV)の代替モデルは2031年までCAGR6.22%を記録しています。リヴィアンの電気駆動車(EDV)は、120マイルの都市區ループ走行においてバッテリーの経済性を実証しましたが、ハイブリッドバンはゼロエミッション規制の達成に苦戦し、シェアを落としています。
燃料電池車の販売台数は依然として微々たるものにとどまっています。2024年時点で米国内で水素ステーションが59カ所にとどまっていることが阻礙因素となっていますが、日本と韓国では200マイルを超えるルート向けのパイロット,コリドーが試験的に導入されています。バッテリーコストの低下に伴い、電気駆動系を搭載した小型商用車(LCV)の市場規模は拡大しており、負載容量のトレードオフがあるにもかかわらず、人口密度の高い都市區でシェアを徐々に拡大しています。
區域分析
預計到2025年,亞太地區將佔全球輕型商用車(LCV)市場佔有率的38.62%,並將在2031年之前維持6.18%的複合年成長率。 2024年,受中國雙抵免政策和區域補貼的推動,商用新能源汽車(LCV)銷量顯著成長,達到相當可觀的水平。同時,印度承諾透過與生產掛鉤的獎勵進行大量投資。特別是,儘管價格溢價較高,塔塔汽車的「Ace EV」電動車仍然取得了令人矚目的銷售業績。日本正透過試營運自動駕駛輕型卡車來應對駕駛老化問題。泰國透過推出一系列稅收優惠政策,成功吸引了大規模投資到本地組裝。
歐洲在眾多零排放區的支持下,限制老舊車輛的運營,預計到2025年將佔據相當大的市場佔有率。到2030年,歐洲將實施嚴格的二氧化碳減排法規,這正推動整個歐洲大陸向電動車的大規模轉型,並加速淘汰柴油車。北美也獲得了類似的市場佔有率,但採取了不同的策略,專注於補貼而非全面禁止。例如,稅額扣抵在很大程度上抵消了電動車的價格差異,加拿大的補貼計畫促使2024年小型商用電動車的註冊量顯著成長。此外,亞馬遜、聯邦快遞和沃爾瑪等大型企業的承諾也使電動車訂單積壓情況持續多年。
南美洲與中東和非洲一樣,在全球電動車市場中所佔佔有率相對較小。巴西的「Rota 2030」舉措正在推廣與乙醇相容的靈活燃料引擎,但阿根廷儘管擁有豐富的鋰資源,卻面臨阻礙電動車投資的經濟挑戰。南非在穩定電網和發展私人充電基礎設施方面取得了進展,這預示著未來可能發生變化。然而,與歐洲和中國相比,南非目前的電動車普及率仍然很低。
其他好處:
- Excel格式的市場預測(ME)表
- 3個月的分析師支持
目錄
第1章:引言
- 研究假設和市場定義
- 調查範圍
第2章:調查方法
第3章執行摘要
第4章 主要產業趨勢
- 都市化、人口、對汽車/大眾運輸的需求
- 輕型商用車(LCV)擁有量和汽車擁有率
- 輕型商用車市場電動車滲透率
- 燃油和電費價格差異(每公里,內燃機汽車與電動車)
- 電動車和內燃機汽車的總擁有成本(TCO)差異
- 資金籌措和所有權模式(貸款、租賃、認購)
- 電池化學成分構成比與電池組能量密度(例如,磷酸鐵鋰電池與鎳基碳化鋰電池等)
- 家中、職場和公共場所充電樁的普及程度/密度
- 快速充電網路滲透率和功率頻寬現狀
- 替代燃料基礎設施(燃料電池電動車的氫氣)
- 補貼和消費者獎勵(購買激勵、稅收激勵、通行費/停車費激勵)的價值
- OEM電動車產品線及未來車型計劃
- 價值鍊和通路分析
- 監管、財政和產業政策框架
第5章 市場狀況
- 市場概覽
- 市場促進因素
- 加強全球二氧化碳和氮氧化物排放法規,並輔以財務獎勵。
- 最後一公里電子商務需求的爆炸性成長
- 電池成本快速下降:低於每千瓦時 100 美元
- 車隊遠端資訊處理技術可降低總擁有成本並縮短更新週期。
- 模組化設備系統生態系統縮短了交貨時間。
- 基於訂閱的加值服務模式正在加速被中小企業採用。
- 市場限制因素
- 儘管電池價格下降,但電動車的初始成本仍然很高。
- 倉庫環境以外缺乏充電基礎設施
- 大容量電池組對負載容量的影響
- 雙排座皮卡車的稅收不確定性
- 價值供應鏈分析
- 監理情勢
- 技術展望
- 波特五力模型
第6章 市場規模與成長預測
- 車輛類型
- 皮卡車
- 廂型車(小型、中型、大型)
- 依推進類型
- ICE
- 混合
- 電池供電
- 燃料電池發電
- 透過使用
- 商業配送/物流
- 工業/建築支持
- 地方政府和公共服務
- 自有車型
- 車隊所有權
- 租
- 訂閱/虛擬即服務
- 按負載容量(GVW等級)
- 2.5噸或以下
- 2.6~3.5t
- 超過3.5噸
- 按地區
- 北美洲
- 美國
- 加拿大
- 其他北美國家
- 南美洲
- 巴西
- 阿根廷
- 其他南美國家
- 歐洲
- 德國
- 法國
- 英國
- 西班牙
- 義大利
- 俄羅斯
- 其他歐洲國家
- 亞太地區
- 中國
- 印度
- 日本
- 韓國
- 澳洲和紐西蘭
- 其他亞太國家
- 中東和非洲
- 沙烏地阿拉伯
- 阿拉伯聯合大公國
- 南非
- 其他中東和非洲國家
- 北美洲
第7章 競爭情勢
- 市場集中度
- 策略趨勢
- 市佔率分析
- 公司簡介
- Ford Motor Company
- Toyota Motor Corporation
- Stellantis NV
- Daimler AG(Mercedes-Benz Vans)
- Renault Group
- General Motors Company
- Volkswagen AG
- Nissan Motor Co. Ltd.
- Hyundai Motor Company
- Tata Motors Limited
- Mahindra & Mahindra Limited
- Isuzu Motors Limited
- BYD Auto Co. Ltd.
- Dongfeng Motor Corporation
- Ashok Leyland Limited
- Volvo Group
- Rivian Automotive Inc.
- BAIC Motor Corporation Ltd.
- Gaz Group
- Iveco Group NV
第8章 市場機會與未來展望
- 評估市場閒置頻段和未滿足的需求
第9章:CEO們需要思考的關鍵策略問題
According to Mordor Intelligence, the light commercial vehicles market size is expected to grow from USD 495.44 billion in 2025 to USD 525.71 billion in 2026 and is forecast to reach USD 707.17 billion by 2031 at a 6.11% CAGR over 2026-2031.
This report is Segmented by Vehicle Type (Pick-Up Trucks and Vans), Propulsion Type (ICE, Hybrid, Battery-Electric, and Fuel-Cell Electric), Application (Commercial Delivery & Logistics and More), Ownership Model (Fleet-Owned and More), Payload (Less Than or Equal To 2. 5t and More), and Geography. Market Forecasts are Provided in Terms of Value (USD) and Volume (Units).
Global Light Commercial Vehicles Market Trends and Insights
Stringent Global CO2 & NOx Standards with Fiscal Incentives
Starting mid-2025, Euro 7 mandates a significant reduction in real-world NOx emissions, requiring levels much lower than the previous Euro 6d-TEMP standards. This change is expected to substantially increase diesel after-treatment costs, thereby reducing the price difference between diesel vehicles and battery-electric vans . In China, the dual-credit system encourages manufacturers by offering additional credits for each zero-emission light commercial vehicle sold, driving an increase in new-energy vehicle production. The EPA's Phase 3 greenhouse-gas rule, applicable to future model years, sets ambitious CO2 reduction targets for light trucks, indirectly promoting a notable share of electric vehicles . Similarly, India's Bharat Stage VI Phase 2 enforces stricter particulate emission limits and requires on-board diagnostics, accelerating the phase-out of older fleets that align with Euro 4 standards.The LCV Market is expected to be influenced by these evolving emission regulations and the resulting shift toward cleaner vehicle technologies.
Exploding Last-Mile E-Commerce Demand
In 2024, e-commerce transactions in the U.S. reached a significant milestone, accounting for a substantial portion of total retail sales. Notably, even a small increase in this penetration translates to a considerable demand for additional vans or pickups. Fleet operators are now prioritizing features such as low cargo floors for easier loading, side doors for convenient curbside access, and sufficient real-world range to support their duty cycles. By mid-2024, Amazon had deployed a large number of electric delivery vans from Rivian, realizing notable reductions in operating costs per mile compared to retrofitted diesel counterparts, due to diminished brake and transmission wear. As vehicle utilization in bustling cities continues to rise, replacement cycles have shortened significantly. This accelerated churn in the light commercial vehicle market is leading to growing order backlogs at major OEMs.
High Upfront Cost of ELCVs Despite Falling Battery Prices
Electric vans carry a significant premium over their diesel counterparts, primarily due to development costs being distributed across a smaller volume and elevated warranty reserves. In 2024, Ford's base E-Transit was priced notably higher than its diesel Transit counterpart. This substantial price difference poses challenges for operators with constrained capital budgets. In India, even after accounting for subsidies, Tata's Ace EV was priced at a considerably higher premium compared to the traditional internal-combustion Ace, a disparity further exacerbated by the additional expense of required chargers. In Europe, weak prices for used electric vehicles (EVs) experienced a notable decline in 2024, dampening lease residuals and tightening credit availability.
Other drivers and restraints analyzed in the detailed report include:
- Rapid Battery-Cost Decline Below USD 100/kWh
- Fleet Telematics Lowering TCO & Accelerating Renewal Cycles
- Charging Infrastructure Gaps Outside Depot Environments
For complete list of drivers and restraints, kindly check the Table Of Contents.
Segment Analysis
Pick-up trucks captured 45.57% of the light commercial vehicle market share in 2025. Vans, however, are forecast to expand at a 6.15% CAGR through 2031 as ultra-low-emission zones encourage compact, aerodynamic bodies that slip into tight curb spaces. The light commercial vehicle market size for vans is projected to grow faster than any other vehicle class, reinforced by battery-electric variants that now meet 150-200-mile duty cycles.
Ford's F-150 Lightning shows pickups are diversifying roles with on-site power export, yet parcel giants favor high-cube vans that maximize cargo per square meter. In Europe, compact models such as Stellantis e-Berlingo thrive inside city walls, while medium vans dominate perishables and parcel segments. Crew-cab vans that seat technicians plus tools blur category lines, underscoring converging use cases in the light commercial vehicle market.
Internal-combustion units still supplied 77.81% of 2025 production, supported by existing service networks and long-range flexibility. Electric alternatives nevertheless post a 6.22% CAGR through 2031 as Section 45W and Euro 7 pressure tip total cost calculations. Rivian's EDV validated battery economics on 120-mile urban loops, while hybrid vans struggle to meet zero-emission mandates and lose ground.
Fuel-cell volumes remain marginal, constrained by 59 hydrogen stations in the United States during 2024, though Japan and South Korea pilot corridors for routes beyond 200 miles. As battery costs decline, the light commercial vehicle market size attached to electric drivetrains widens, capturing incremental share in dense city zones despite payload trade-offs.
Complete Report Scope:
- By Vehicle Type
- Pick-up Trucks
- Vans (Compact, Medium, Heavy)
- By Propulsion Type
- ICE
- Hybrid
- Battery-Electric
- Fuel-Cell Electric
- By Application
- Commercial Delivery & Logistics
- Industrial / Construction Support
- Municipal & Public Services
- By Ownership Model
- Fleet-Owned
- Leased
- Subscription / VaaS
- By Payload (GVW Class)
- Less than or equal to 2.5 t
- 2.6 - 3.5 t
- More than 3.5 t
- By Geography
- North America
- United States
- Canada
- Rest of North America
- South America
- Brazil
- Argentina
- Rest of South America
- Europe
- Germany
- France
- United Kingdom
- Spain
- Italy
- Russia
- Rest of Europe
- Asia Pacific
- China
- India
- Japan
- South Korea
- Australia & New Zealand
- Rest of Asia Pacific
- Middle East and Africa
- Saudi Arabia
- United Arab Emirates
- South Africa
- Rest of Middle East and Africa
- North America
Geography Analysis
Asia Pacific held 38.62% of the light commercial vehicle market in 2025 and is expected to register a 6.18% CAGR to 2031. In 2024, China's dual-credit rewards and local subsidies significantly boosted sales of commercial new-energy vehicles to substantial levels. Meanwhile, India's production-linked incentives attracted considerable investment commitments. Notably, Tata's Ace EV achieved notable sales, even commanding a significant price premium. Japan is addressing its aging driver demographic by testing autonomous kei trucks. In a strategic move, Thailand introduced an extended tax holiday, successfully attracting a major investment in local assembly .
Europe accounted for a significant share of the 2025 market volumes, supported by numerous zero-emission zones that restrict older vehicle models. With stringent mandates for CO2 emission reductions by 2030, the continent is driving a substantial shift toward electric vehicles, accelerating the phase-out of diesel. North America captured a comparable market share but adopted a different approach, focusing on subsidies rather than outright bans. For instance, tax credits subsidize a significant portion of the electric premium, and a rebate program in Canada substantially increased light commercial EV registrations in 2024. Furthermore, fleet commitments from major companies like Amazon, FedEx, and Walmart are sustaining order backlogs for several years.
South America, alongside the Middle East & Africa, collectively represents a smaller portion of the global market value. While Brazil's Rota 2030 initiative promotes ethanol-friendly flex-fuel engines, Argentina faces economic challenges that hinder EV investments, despite the nation's abundant lithium resources. South Africa is making progress with grid stabilization and a private charging rollout, signaling a potential shift in the future. However, the country's current EV penetration remains minimal compared to Europe and China.
- Ford Motor Company
- Toyota Motor Corporation
- Stellantis N.V.
- Daimler AG (Mercedes-Benz Vans)
- Renault Group
- General Motors Company
- Volkswagen AG
- Nissan Motor Co. Ltd.
- Hyundai Motor Company
- Tata Motors Limited
- Mahindra & Mahindra Limited
- Isuzu Motors Limited
- BYD Auto Co. Ltd.
- Dongfeng Motor Corporation
- Ashok Leyland Limited
- Volvo Group
- Rivian Automotive Inc.
- BAIC Motor Corporation Ltd.
- Gaz Group
- Iveco Group N.V.
Additional Benefits:
- The market estimate (ME) sheet in Excel format
- 3 months of analyst support
TABLE OF CONTENTS
1 Introduction
- 1.1 Study Assumptions & Market Definition
- 1.2 Scope of the Study
2 Research Methodology
3 Executive Summary
4 Key Industry Trend
- 4.1 Urbanization, Population & Vehicle/Transit Demand
- 4.2 LCV Ownership & Motorization Rate
- 4.3 EV Penetration in LCV Market
- 4.4 Fuel vs Electricity Price Spread (Per km, ICE vs EV)
- 4.5 EV vs ICE Total Cost of Ownership (TCO) Gap
- 4.6 Financing & Ownership Models (Loans, Leasing, Subscription)
- 4.7 Battery Chemistry Mix & Pack Energy Density (LFP vs NMC etc.)
- 4.8 Home, Workplace & Public Charger Access / Density
- 4.9 Fast-Charging Network Coverage & Power Bands
- 4.10 Alternative Fuels Infrastructure (Hydrogen for FCEVs)
- 4.11 Subsidy & Consumer Incentive Value (Purchase, Tax, Toll/Parking Benefits)
- 4.12 OEM EV Line-up & Model Pipeline
- 4.13 Value-Chain & Distribution-Channel Analysis
- 4.14 Regulatory, Fiscal & Industrial Policy Framework
5 Market Landscape
- 5.1 Market Overview
- 5.2 Market Drivers
- 5.2.1 Stringent Global Co2 & NOX Standards With Fiscal Incentives
- 5.2.2 Exploding Last-Mile E-Commerce Demand
- 5.2.3 Rapid Battery-Cost Decline Below USD 100 /Kwh
- 5.2.4 Fleet Telematics Lowering TCO & Accelerating Renewal Cycles
- 5.2.5 Modular Upfitting Ecosystems Shortening Delivery Lead-Time
- 5.2.6 Subscription-Based VAAS Models Unlocking SME Adoption
- 5.3 Market Restraints
- 5.3.1 High Upfront Cost Of ELCVs Despite Falling Battery Prices
- 5.3.2 Charging Infrastructure Gaps Outside Depot Environments
- 5.3.3 Payload Penalties from Heavy Battery Packs
- 5.3.4 Tax-Policy Uncertainty on Double-Cab Pickups
- 5.4 Value / Supply-Chain Analysis
- 5.5 Regulatory Landscape
- 5.6 Technological Outlook
- 5.7 Porter's Five Forces
- 5.7.1 Threat of New Entrants
- 5.7.2 Bargaining Power of Suppliers
- 5.7.3 Bargaining Power of Buyers
- 5.7.4 Threat of Substitutes
- 5.7.5 Competitive Rivalry
6 Market Size & Growth Forecasts (Value (USD) and Volume (Units))
- 6.1 By Vehicle Type
- 6.1.1 Pick-up Trucks
- 6.1.2 Vans (Compact, Medium, Heavy)
- 6.2 By Propulsion Type
- 6.2.1 ICE
- 6.2.2 Hybrid
- 6.2.3 Battery-Electric
- 6.2.4 Fuel-Cell Electric
- 6.3 By Application
- 6.3.1 Commercial Delivery & Logistics
- 6.3.2 Industrial / Construction Support
- 6.3.3 Municipal & Public Services
- 6.4 By Ownership Model
- 6.4.1 Fleet-Owned
- 6.4.2 Leased
- 6.4.3 Subscription / VaaS
- 6.5 By Payload (GVW Class)
- 6.5.1 Less than or equal to 2.5 t
- 6.5.2 2.6 - 3.5 t
- 6.5.3 More than 3.5 t
- 6.6 By Geography
- 6.6.1 North America
- 6.6.1.1 United States
- 6.6.1.2 Canada
- 6.6.1.3 Rest of North America
- 6.6.2 South America
- 6.6.2.1 Brazil
- 6.6.2.2 Argentina
- 6.6.2.3 Rest of South America
- 6.6.3 Europe
- 6.6.3.1 Germany
- 6.6.3.2 France
- 6.6.3.3 United Kingdom
- 6.6.3.4 Spain
- 6.6.3.5 Italy
- 6.6.3.6 Russia
- 6.6.3.7 Rest of Europe
- 6.6.4 Asia Pacific
- 6.6.4.1 China
- 6.6.4.2 India
- 6.6.4.3 Japan
- 6.6.4.4 South Korea
- 6.6.4.5 Australia & New Zealand
- 6.6.4.6 Rest of Asia Pacific
- 6.6.5 Middle East and Africa
- 6.6.5.1 Saudi Arabia
- 6.6.5.2 United Arab Emirates
- 6.6.5.3 South Africa
- 6.6.5.4 Rest of Middle East and Africa
- 6.6.1 North America
7 Competitive Landscape
- 7.1 Market Concentration
- 7.2 Strategic Moves
- 7.3 Market Share Analysis
- 7.4 Company Profiles (includes Global Level Overview, Market Level Overview, Core Segments, Financials as Available, Strategic Information, Market Rank/Share for Key Companies, Products and Services, SWOT Analysis, and Recent Developments)
- 7.4.1 Ford Motor Company
- 7.4.2 Toyota Motor Corporation
- 7.4.3 Stellantis N.V.
- 7.4.4 Daimler AG (Mercedes-Benz Vans)
- 7.4.5 Renault Group
- 7.4.6 General Motors Company
- 7.4.7 Volkswagen AG
- 7.4.8 Nissan Motor Co. Ltd.
- 7.4.9 Hyundai Motor Company
- 7.4.10 Tata Motors Limited
- 7.4.11 Mahindra & Mahindra Limited
- 7.4.12 Isuzu Motors Limited
- 7.4.13 BYD Auto Co. Ltd.
- 7.4.14 Dongfeng Motor Corporation
- 7.4.15 Ashok Leyland Limited
- 7.4.16 Volvo Group
- 7.4.17 Rivian Automotive Inc.
- 7.4.18 BAIC Motor Corporation Ltd.
- 7.4.19 Gaz Group
- 7.4.20 Iveco Group N.V.
8 Market Opportunities & Future Outlook
- 8.1 White-space & Unmet-Need Assessment
9 Key Strategic Questions for CEOs

 輕型商用車市場預測至2034年:按車輛類型、動力系統、應用、所有權和地區分類的全球分析
 全球輕型商用車市場規模、佔有率、趨勢和成長分析報告(2026-2034)
 輕型商用車市場-2026-2032年全球市場預測
 輕型商用車市場:按動力類型、車輛等級和地區分類
 輕型商用車市場-全球產業規模、佔有率、趨勢、機會及預測(依車輛類型、酬載能力、燃料類型、地區及競爭格局分類,2021-2031年)
 輕型商用車市場規模、佔有率及成長分析(按車輛類型、燃料類型、所有權類型和地區分類)-2026-2033年產業預測北美和歐洲輕型商用車服務市場(2024 年和 2030 年)