


 |
市場調查報告書
商品編碼
2125517
美國汽車經銷商:市場佔有率分析、行業趨勢和統計數據以及成長預測(2026-2031 年)United States Automotive Dealership - Market Share Analysis, Industry Trends & Statistics, Growth Forecasts (2026 - 2031) |
||||||

※ 本網頁內容可能與最新版本有所差異。詳細情況請與我們聯繫。
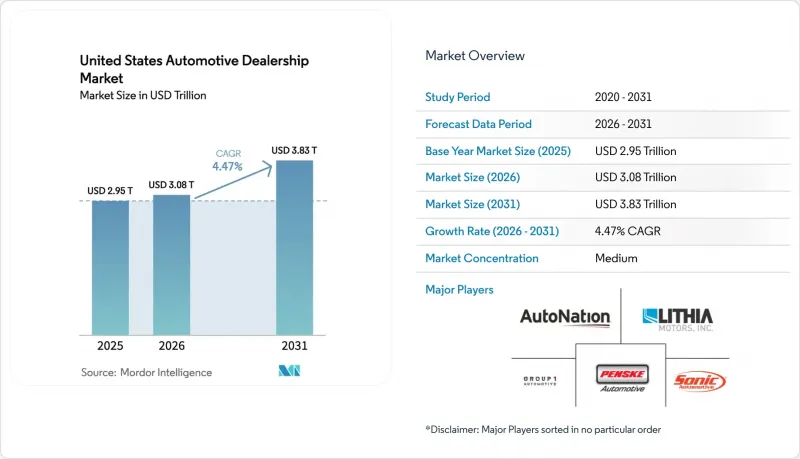
根據 Mordor Intelligence 預測,美國汽車經銷市場規模將從 2025 年的 2.95 兆美元成長到 2026 年的 3.08 兆美元,到 2031 年將達到 3.83 兆美元,2026 年至 2031 年的複合年成長率為 4.47%。
本報告按類型(新車和二手車銷售)、經銷商類型(特許經銷商、獨立經銷商等)、車輛類型(乘用車、輕型卡車和SUV等)、銷售管道(實體店、線上/全通路)、客戶群和地區進行細分。市場預測以美元計價。
美國汽車經銷市場趨勢與洞察
電動車車型的推出正在加速。
特許經營集團正投入數十億美元打造電動車展示室和服務車間。每家店的資本投資從二級充電樁的10萬美元到三級直流快速充電樁及電力設備升級所需的100萬美元不等。福特Model e認證精英計畫就是一個典型的例子,將培訓、工具和充電樁安裝打包在一個緊湊的時間表內,重塑了零售商的資本投資規劃週期。領先的經銷商透過電池保固和軟體訂閱服務獲得了更高的業務收益,彌補了電動車機械維修頻率較低的不足。儘管區域差異依然存在,加州和紐約的經銷商充電樁利用率高於中西部北部地區的經銷商,但預計2024年全美電動車註冊量的成長凸顯了這項投資的長期獲利能力。
新車庫存水位恢復
隨著OEM廠商生產趨於穩定,截至2024年11月,經銷商庫存達到323萬台,接近疫情前340萬至350萬台的水準。供應狀況的改善使得零售商得以重啟獎勵計劃,恢復銷售提成,從而彌補了此前因供應受限而導致的兩年利潤率下滑。在半導體供應恢復正常的背景下,國內品牌重新推出具競爭力的租賃方案,吸引對付款方式敏感的消費者重返展示室。與2022年供不應求時期相比,經銷商目前的存貨周轉有所下降,因此更加依賴人工智慧驅動的需求預測引擎來避免庫存積壓。此外,充足的庫存也增強了大型經銷商集團的議價能力,使其能夠大量採購配額車輛,進一步擴大了相對於小規模獨立經銷商的成本優勢。
電動車和ADAS的服務升級需要高額資本投入。
安裝電動車電池升降機、隔熱儲存設備和ADAS校準設備的成本在每家門市5.6萬美元至65萬美元之間。在農村市場,價格合理的電力供應和熟練技術人員的取得尤其困難,迫使一些單店經營者退出市場,而不是為老舊設施再融資。合併後的公司可以利用規模優勢降低成本,透過更大的業務量攤提資本投資,進一步擴大變動成本差距。雖然原始設備製造商(OEM)的還款計劃可以抵消部分成本,但通常要求承諾一定的業務量,從而獎勵企業進一步合併。因此,資本密集度是獨立經營者面臨的最緊迫的結構性阻力,預計將使整體市場成長率下降0.6個百分點。
細分市場分析
到2025年,美國二手車市場將佔據52.85%的市場佔有率,鞏固其作為該通路經濟基礎的地位。儘管批發指數趨於正常化,但由於租賃返還率下降推動了殘值上升,經銷商仍能維持毛利。點對點回購工具持續提升利潤率,避免了競標費用並降低了物流成本。各類認證二手車均維持溢價,周轉率提高25%,改善現金流量並減輕庫存資金的利息負擔。
隨著汽車製造商產能限制的緩解,預計到2031年,新車複合年成長率將達到5.41%,超過二手車增速。 2025年初,相當於交易價格平均6.8%的獎勵成功吸引了猶豫不決的消費者重返展示室,尤其是入門車型。隨著供應恢復正常,新車在美國汽車銷售市場的佔有率預計將逐步上升,但價格透明度和經銷商的試點項目預計將在銷售初期限制毛利的成長。經銷商正在縮短置換車輛的保養週期,力求在27天內完成二手車庫存週轉,而行業平均為35天,從而維持兩種車型整體的毛利表現。
到2025年,特許經營集團將佔據美國汽車經銷市場57.60%的佔有率,而由原始設備製造商(OEM)的獨家配額、擔保權以及與專屬式金融公司建立的合作關係所支持的直銷數位平台,預計將在2031年之前以6.02%的複合年成長率(CAGR)保持最高水準。這些合作構成了高准入門檻。市場整合型公司正透過收購帶來的綜效來提高單店息稅折舊攤提前利潤(EBITDA),例如Lithia在採購和行銷方面實現的規模經濟。純數位公司利用輕資產模式,儘管利潤率較低,但仍實現了兩位數的銷售成長。然而,全通路混合模式正在興起,例如亞馬遜汽車整合了經銷商的配送系統,既能維持消費者的便利性,又能確保最後一公里物流的成本效益。
在價格敏感型買家重視談判柔軟性和非原廠保固方案的地區,獨立經銷商仍保持著一定的地位。然而,特許經營者有義務安裝電動車相容設備,並有權使用OTA軟體,這使他們在未來的電氣化進程中擁有結構性優勢。從長遠來看,隨著繼任計畫和高資本密集度促使單店業主剝離業務,美國汽車經銷商市場的規模預計將更加向業績卓越的跨州集團傾斜。投資於「線上購買」平台和當日服務通道的特許經營商將超越那些僅依賴傳統到店客戶的競爭對手。
其他好處:
- Excel格式的市場預測(ME)表
- 3個月的分析師支持
目錄
第1章:引言
- 研究假設和市場定義
- 調查範圍
第2章:調查方法
第3章執行摘要
第4章 市場狀況
- 市場概覽
- 市場促進因素
- 電動車車型的推出正在加速。
- 新車庫存水位恢復
- 經銷商主導的F&I產品擴張
- 擴大認證二手車(CPO)項目
- 州級數位零售法
- 透過經銷商提供的 OEM 訂閱模式
- 市場限制因素
- 電動車和ADAS服務升級需要大量資金投入
- OEM直接面對消費者的銷售模式
- 網路定價透明度的提高給利潤率帶來了壓力。
- 聯邦貿易委員會合規成本增加(金融和保險)
- 價值供應鏈分析
- 監理情勢
- 技術展望
- 波特五力分析
第5章 市場規模與成長預測
- 按類型
- 新車銷售
- 二手車銷售
- 按零售商
- 加盟店
- 獨立經銷商
- 直接面對消費者的數位零售商
- 車輛類型
- 搭乘用車
- 輕型卡車和SUV
- 中型和重型商用車輛
- 按銷售管道
- 實體店面
- 線上/全通路
- 按客戶細分
- 個人消費者
- 車隊和公司實體
- 按地區(美國)
- 東北
- 中西部
- 南部
- 西方
第6章 競爭情勢
- 市場集中度
- 策略趨勢
- 市佔率分析
- 公司簡介
- AutoNation Inc.
- Lithia Motors Inc.
- Penske Automotive Group
- Group 1 Automotive Inc.
- Sonic Automotive Inc.
- Asbury Automotive Group Inc.
- Hendrick Automotive Group
- CarMax Inc.
- Carvana Co.
- Larry H. Miller Dealerships
- Ken Garff Automotive Group
- Staluppi Auto Group
- Morgan Auto Group
- Holman Automotive
- Serra Automotive
- Napleton Automotive Group
- Suburban Collection
第7章 市場機會與未來展望
According to Mordor Intelligence, the United States automotive dealership market size is expected to grow from USD 2.95 trillion in 2025 to USD 3.08 trillion in 2026 and is forecast to reach USD 3.83 trillion by 2031 at 4.47% CAGR over 2026-2031.
This report is Segmented by Type (New-Vehicle Sales and Used-Vehicle Sales), Retailer (Franchised Dealers, Independent Dealers, and More), Vehicle Type (Passenger Cars, Light Trucks and SUVs, and More), Sales Channel (Brick and Mortar, Online/Omnichannel), Customer Segment, and Region. The Market Forecasts are Provided in Terms of Value (USD).
United States Automotive Dealership Market Trends and Insights
Accelerating EV Model Launches
Franchise groups have pledged billions for EV-ready showrooms and service bays . Capital outlays per location range from USD 100,000 for Level 2 chargers to more than USD 1 million, where Level 3 DC fast-charging plus utility upgrades are required. Ford's Model e Certified Elite program illustrates OEM mandates that bundle training, tooling, and charger installation under strict timelines, reshaping cap-ex planning cycles for retailers. Early movers capture incremental service profits from battery warranty work and software-subscription enablement, offsetting EVs' lower mechanical-repair frequency. Geographic disparity persists; dealers in California and New York see higher charger utilization than peers in the Upper Midwest, yet nationwide EV registration growth in 2024 supports long-run investment viability.
Recovery in New-Vehicle Inventory Levels
OEM production stability lifted dealer stock to 3.23 million units by November 2024, close to the 3.4 - 3.5 million pre-pandemic norm. Improved supply lets retailers restore traditional incentive programs and recoup volume-based bonuses, reversing two years of margin erosion caused by constrained pipelines. Domestic brands, supported by normalized chip supply, re-establish competitive lease offers that draw payment-sensitive buyers back to showrooms. Dealers must manage slower turn-rates than in 2022's shortage era, prompting heavier reliance on AI-driven demand-forecasting engines to avoid over-stocking. Robust inventory also strengthens the negotiating power of large dealer groups, who can bulk-purchase allocations, widening their cost advantage over smaller independents.
High CAPEX for EV and ADAS Service Upgrades
EV battery hoists, insulated storage, and ADAS calibration rigs cost USD 56,000-650,000 per rooftop . Access to affordable power feeds and specialized technicians is especially constrained in rural markets, forcing some single-point operators to exit instead of refinancing aging facilities. Consolidators enjoy scale cost leverage and can amortize tooling over larger throughput, widening their variable-cost gap. OEM reimbursement programs partially defray expenses but usually require volume commitments, embedding further consolidation incentives. Consequently, capital intensity is the most immediate structural headwind for independents, lowering market-wide growth by an estimated 0.6 percentage points.
Other drivers and restraints analyzed in the detailed report include:
- Dealer-Led Expansion of F&I Products
- Growth of Certified Pre-Owned (CPO) Programs
- OEM Direct-to-Consumer Models
For complete list of drivers and restraints, kindly check the Table Of Contents.
Segment Analysis
The United States automotive dealership market size for used vehicles held a 52.85% share in 2025, cementing its role as the channel's economic backbone. Elevated residual values, bolstered by curtailed lease returns, helped dealers protect grosses even as wholesale indices normalized. Margins continue to benefit from private-party acquisition tools that circumvent auction fees and reduce inbound logistics costs. Certified tiers maintain premium pricing and 25% faster turn-rates, improving cash velocity that supports floorplan interest outlays.
New vehicles are projected to log a 5.41% CAGR, outpacing used growth through 2031 as OEM production constraints fade. Incentives averaging 6.8% of transaction price in early 2025 have pulled sidelined buyers back into showrooms, especially on entry-level trims. As supply normalizes, the United States automotive dealership market share for new vehicles is expected to climb modestly, though pricing transparency and agency pilots will cap front-end gross upside. Dealers tighten reconditioning cycles on trade-ins, aiming to flip used inventory within 27 days versus the 35-day industry median, sustaining blended gross performance across both vehicle streams.
Franchised groups controlled 57.60% of the United States automotive dealership market in 2025, and direct-to-consumer digital platforms record the highest forecast CAGR at 6.02% to 2031, underpinned by exclusive OEM allocations, warranty authority, and financing captive ties that erect high entry barriers. Market consolidators leverage acquisition synergies such as Lithia's economies in procurement and marketing to expand EBITDA per rooftop. Digital pure-plays leverage asset-light models, booking double-digit unit gains despite narrow contribution margins. Still, omnichannel hybrids are emerging, with Amazon Autos integrating dealer fulfillment to keep last-mile logistics cost-effective while preserving consumer convenience.
Independent lots retain relevance where price-sensitive shoppers value negotiation flexibility and non-OEM warranty bundles. Yet franchise operators' mandated EV tooling and OTA software rights grant them a structural advantage in an electrified future. Over time, the United States automotive dealership market size is expected to skew toward high-performing multi-state groups as succession planning and capital intensity prompt single-store owners to divest. Franchisees that invest in click-to-buy platforms and same-day service lanes will outperform peers relying solely on legacy walk-in traffic.
Complete Report Scope:
- By Type
- New-Vehicle Sales
- Used-Vehicle Sales
- By Retailer
- Franchised Dealers
- Independent Dealers
- Direct-to-Consumer Digital Retailers
- By Vehicle Type
- Passenger Cars
- Light Trucks and SUVs
- Medium and Heavy Commercial Vehicles
- By Sales Channel
- Brick and Mortar
- Online / Omnichannel
- By Customer Segment
- Individual Consumers
- Fleet and Corporate
- By Region (United States)
- Northeast
- Midwest
- South
- West
List of Companies Covered in this Report:
- AutoNation Inc.
- Lithia Motors Inc.
- Penske Automotive Group
- Group 1 Automotive Inc.
- Sonic Automotive Inc.
- Asbury Automotive Group Inc.
- Hendrick Automotive Group
- CarMax Inc.
- Carvana Co.
- Larry H. Miller Dealerships
- Ken Garff Automotive Group
- Staluppi Auto Group
- Morgan Auto Group
- Holman Automotive
- Serra Automotive
- Napleton Automotive Group
- Suburban Collection
Additional Benefits:
- The market estimate (ME) sheet in Excel format
- 3 months of analyst support
TABLE OF CONTENTS
1 Introduction
- 1.1 Study Assumptions & Market Definition
- 1.2 Scope of the Study
2 Research Methodology
3 Executive Summary
4 Market Landscape
- 4.1 Market Overview
- 4.2 Market Drivers
- 4.2.1 Accelerating EV Model Launches
- 4.2.2 Recovery in New-Vehicle Inventory Levels
- 4.2.3 Dealer-Led Expansion of F&I Products
- 4.2.4 Growth of Certified Pre-Owned (CPO) Programs
- 4.2.5 State-Level Digital Retailing Legislation
- 4.2.6 OEM Subscription Models via Dealers
- 4.3 Market Restraints
- 4.3.1 High CAPEX for EV and ADAS Service Upgrades
- 4.3.2 OEM Direct-to-Consumer Models
- 4.3.3 Margin Compression from Online Price Transparency
- 4.3.4 Increased FTC Compliance Costs (F&I)
- 4.4 Value / Supply-Chain Analysis
- 4.5 Regulatory Landscape
- 4.6 Technological Outlook
- 4.7 Porter's Five Forces Analysis
- 4.7.1 Threat of New Entrants
- 4.7.2 Bargaining Power of Buyers
- 4.7.3 Bargaining Power of Suppliers
- 4.7.4 Threat of Substitutes
- 4.7.5 Intensity of Competitive Rivalry
5 Market Size & Growth Forecasts (Value (USD))
- 5.1 By Type
- 5.1.1 New-Vehicle Sales
- 5.1.2 Used-Vehicle Sales
- 5.2 By Retailer
- 5.2.1 Franchised Dealers
- 5.2.2 Independent Dealers
- 5.2.3 Direct-to-Consumer Digital Retailers
- 5.3 By Vehicle Type
- 5.3.1 Passenger Cars
- 5.3.2 Light Trucks and SUVs
- 5.3.3 Medium and Heavy Commercial Vehicles
- 5.4 By Sales Channel
- 5.4.1 Brick and Mortar
- 5.4.2 Online / Omnichannel
- 5.5 By Customer Segment
- 5.5.1 Individual Consumers
- 5.5.2 Fleet and Corporate
- 5.6 By Region (United States)
- 5.6.1 Northeast
- 5.6.2 Midwest
- 5.6.3 South
- 5.6.4 West
6 Competitive Landscape
- 6.1 Market Concentration
- 6.2 Strategic Moves
- 6.3 Market Share Analysis
- 6.4 Company Profiles (Includes Global Level Overview, Market Level Overview, Core Segments, Financials as Available, Strategic Information, Market Rank/Share for Key Companies, Products and Services, SWOT Analysis, and Recent Developments)
- 6.4.1 AutoNation Inc.
- 6.4.2 Lithia Motors Inc.
- 6.4.3 Penske Automotive Group
- 6.4.4 Group 1 Automotive Inc.
- 6.4.5 Sonic Automotive Inc.
- 6.4.6 Asbury Automotive Group Inc.
- 6.4.7 Hendrick Automotive Group
- 6.4.8 CarMax Inc.
- 6.4.9 Carvana Co.
- 6.4.10 Larry H. Miller Dealerships
- 6.4.11 Ken Garff Automotive Group
- 6.4.12 Staluppi Auto Group
- 6.4.13 Morgan Auto Group
- 6.4.14 Holman Automotive
- 6.4.15 Serra Automotive
- 6.4.16 Napleton Automotive Group
- 6.4.17 Suburban Collection
7 Market Opportunities & Future Outlook
- 7.1 White-Space & Unmet-Need Assessment

 2026-2034年全球汽車輪胎線上零售市場規模、佔有率、趨勢和成長分析報告
 汽車API管理市場預測至2034年-按組件、部署模式、API類型、組織規模、應用、最終用戶和地區分類的全球分析
 汽車配件市場規模、佔有率和成長分析:按產品類型、車輛類型、銷售管道、分銷通路、價格範圍和地區分類-2026-2033年產業預測
 汽車電子商務市場分析及至2035年預測:按類型、產品、服務、技術、組件、應用、部署、最終用戶、解決方案和模式
 汽車輪胎線上零售市場規模、佔有率和成長分析:按輪胎類型、季節、銷售管道、車輛類型、分銷模式、最終用戶和地區分類-2026-2033年產業預測小鵬汽車策略概況:全球,2026年
 東南亞汽車經銷商:市場佔有率分析、產業趨勢與統計及成長預測(2026-2031)
 2026年全球汽車售後市場報告智慧經銷商CRM市場預測至2034年:按類型、功能、應用和區域分類的全球分析
 2026-2030年全球汽車售後市場電子商務零售市場