


 |
市場調查報告書
商品編碼
2125338
美國閥門:市場佔有率分析、行業趨勢和統計數據、成長預測(2026-2031)United States Valves - Market Share Analysis, Industry Trends & Statistics, Growth Forecasts (2026 - 2031) |
||||||

※ 本網頁內容可能與最新版本有所差異。詳細情況請與我們聯繫。
根據 Mordor Intelligence 預測,美國閥門市場規模將從 2025 年的 190.2 億美元成長到 2026 年的 199.4 億美元,然後在 2031 年達到 252.8 億美元,2026 年至 2031 年的複合年成長率為 4.86%。
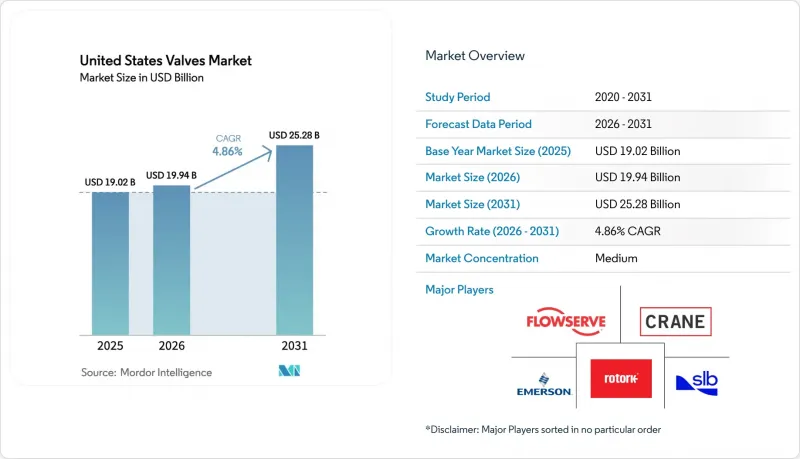
本報告按類型(球閥、蝶閥、閘閥、截止閥、止回閥、塞閥、控制閥等)、材質(鋼、鑄鐵、合金、塑膠等)、操作方式(氣壓、電動、液壓等)、終端用戶產業(石油天然氣、發電等)和地區細分。市場預測以美元計價。
美國閥門市場的趨勢和洞察
頁岩油再壓裂活動的快速擴張正在推動閥門更換的需求。
二次破碎作業已將閥門壽命從18-24個月縮短至12-15個月,持續推動二疊紀盆地和其他主要頁岩資源產區的售後市場需求。超過10,000 psi的壓力循環需要高性能設計,並具備更強的密封性和耐腐蝕性。售後市場供應商受益於更高的更換頻率,而原始設備製造商(OEM)則透過升級材料和服務合約獲得附加價值。隨著二次加壓頻率的增加,對能夠在多級加工過程中調節流量的控制閥的需求也隨之增加。能夠在時間緊迫的環境下獲得產品認證並快速部署的供應商將獲得競爭優勢。
加快向水利基礎設施現代化項目注入聯邦資金
《基礎設施投資與就業法案》撥款550億美元用於供水系統,其中大部分用於更換已運作30至50年的老舊閥門。市政當局優先考慮採用智慧、無鉛和遠端控制閥門,以提高洩漏檢測效率並確保符合監管要求。美國環保署(EPA)的輪調基金是聯邦津貼的補充,確保計畫供應穩定,直到2030年。提供包括閥門、執行器和監控軟體在內的承包工程的供應商獲得了更高的利潤率,尤其是在東北部和中西部地區,這些地區的閥門更換需求迫切。由於採購週期較長,與市政當局合作經驗豐富的供應商更具優勢。
鋼鐵和合金價格的波動給OEM廠商的利潤率帶來了壓力。
2024年,鋼材現貨價格波動幅度高達40%至60%,對簽訂長期合約的閥門製造商的利潤率帶來壓力。沒有避險策略的中小型企業更容易受到收入波動的影響,在某些情況下,甚至被迫使用替代材料重新設計產品。附加費條款和指數掛鉤定價可以幫助大型企業抵銷價格波動的影響,但實施這些條款需要與客戶進行談判並更新系統。價格波動也會使庫存計畫更加複雜,增加營運資金需求,並可能延緩創新投資。
細分市場分析
到2025年,閘閥將占美國閥門市場佔有率的27.24%。這反映了閘閥在管道和供水網路中的廣泛應用,在這些應用中,完全關閉至關重要。既定的規範使其成為許多工程標準的預設選擇,從而支撐了穩定的替換需求。蝶閥正以5.05%的複合年成長率快速成長,其緊湊的面積和在暖通空調(HVAC)和自動化工藝生產線中快速直角回轉操作的優勢備受青睞。隨著設施業主優先考慮能源效率和遠端控制,美國蝶閥市場正在擴張。截止閥和止回閥已成為流量調節和防止回流的標準配置,而受精度要求驅動的控制閥則佔據了一個高價值的細分市場。積層製造技術在原型製作方面的普及實現了快速客製化,但由於成本和耐用性的考慮,傳統鑄造仍然是大規模生產的首選。
工程團隊越來越重視總安裝成本而非採購價格,蝶閥因其重量輕、可降低結構和運行成本而受益於此趨勢。另一方面,閘閥憑藉其堅固的楔形密封和全通徑流道,在腐蝕性或磨蝕性環境中仍保持優勢。改裝數位位置回饋裝置,現有閘閥可以整合到工廠的DCS平台中,從而延長其使用壽命並支援現代監控策略。能夠透過統一的資產管理軟體支援混合閘閥和蝶閥配置的供應商正在贏得維護契約,從而提高美國閥門市場的客戶留存率。
預計到2025年,鋼材產品將佔據40.88%的市場。這主要得益於鋼材的高抗張強度和耐熱性,這些特性對於上游能源和化學加工應用至關重要。冶金和塗層技術的進步延長了鋼材的平均故障間隔時間(MTBF),確保了鋼材在公共產業。
公共產業會仔細考慮生命週期成本,並通常選擇塑膠管道作為低壓管道材料,因為腐蝕會導致鋼管頻繁更換。混合解決方案,例如鋼管體加塑膠內襯,兼顧了強度和耐化學腐蝕性,並在中壓領域逐漸佔據市場佔有率。合金材料在核能和航太等嚴苛環境中仍然佔據主導地位,但其有限的產量限制了其市場佔有率。鑄鐵仍然用於傳統的城市基礎設施系統,但由於其重量和腐蝕等缺點,其使用正在逐漸減少。材料創新對於滿足日益嚴格的環境和性能標準仍然至關重要,尤其是在引入氫能服務後,新的相容性挑戰日益凸顯。
其他好處:
- Excel格式的市場預測(ME)表
- 3個月的分析師支持
目錄
第1章:引言
- 研究假設和市場定義
- 調查範圍
第2章:調查方法
第3章執行摘要
第4章 市場狀況
- 市場概覽
- 市場促進因素
- 頁岩油再壓裂技術的快速擴張推高了閥門更換的需求。
- 聯邦政府對水利基礎設施現代化改造的撥款正在加速增加。
- 引入利用工業IoT的預測性維護
- 已製定適用於氫氣環境的閥門的設計標準。
- 碳捕獲計畫的聯邦投資稅額扣抵
- 模組化資料中心的發展需要精密冷卻閥。
- 市場限制因素
- 鋼鐵和合金價格的波動給OEM廠商的利潤率帶來了壓力。
- 智慧閥門試運行和維護方面的技能差距
- 特殊閥門鑄件的進口關稅
- 網路安全問題正在減緩連網閥門的普及。
- 產業價值鏈分析
- 宏觀經濟因素的影響
- 監理情勢
- 技術展望
- 波特五力分析
- 評估新冠肺炎疫情的影響
第5章 市場規模與成長預測
- 按類型
- 球閥
- 蝶閥
- 閘閥
- 球閥
- 止回閥
- 塞閥
- 控制閥
- 其他類型
- 材料
- 鋼
- 鑄鐵
- 合金基體
- 塑膠
- 其他材料
- 透過操作方法
- 手動的
- 氣壓
- 電的
- 油壓
- 其他操作方法
- 按最終用戶行業分類
- 石油和天然氣
- 發電
- 化學品
- 水和污水處理
- 礦業
- 食品/飲料
- 製藥
- 其他終端用戶產業
- 按地區
- 東北
- 中西
- 南
- 西方
第6章 競爭情勢
- 市場集中度
- 策略趨勢
- 市佔率分析
- 公司簡介
- Emerson Electric Co.
- Schlumberger Limited
- Flowserve Corporation
- Crane Company
- Rotork plc
- Bray International, Inc.
- KITZ Corporation
- Parker-Hannifin Corporation
- Curtiss-Wright Corporation
- Watts Water Technologies, Inc.
- AVK Holding A/S
- Velan Inc.
- Johnson Controls International plc
- Honeywell International Inc.
- Spirax-Sarco Engineering plc
- Pentair plc
- Cameron(SLB)
- AUMA Riester GmbH and Co. KG
- Samson Aktiengesellschaft
- Swagelok Company
第7章 市場機會與未來展望
According to Mordor Intelligence, the US valves market size is expected to grow from USD 19.02 billion in 2025 to USD 19.94 billion in 2026 and is forecast to reach USD 25.28 billion by 2031 at 4.86% CAGR over 2026-2031.
This report is Segmented by Type (Ball Valve, Butterfly Valve, Gate Valve, Globe Valve, Check Valve, Plug Valve, Control Valve, and More), Material (Steel, Cast Iron, Alloy-Based, Plastic, and More), Actuation Method (Manual, Pneumatic, Electric, Hydraulic, and More), End-User Industry (Oil and Gas, Power Generation, and More), and Region. The Market Forecasts are Provided in Terms of Value (USD).
United States Valves Market Trends and Insights
Rapid Shale-Oil Refracturing Activity Boosting Valve Replacements
Refracturing campaigns shorten valve lifecycles from 18-24 months to 12-15 months, driving steady aftermarket demand in Permian and other shale hotspots. Pressure cycling above 10,000 psi necessitates premium designs with enhanced sealing and corrosion resistance. Aftermarket providers benefit from higher replacement frequency, while OEMs capture value through upgraded materials and service agreements. Rising refracturing intensity also spurs demand for control valves that can modulate flow during multi-stage treatments. Suppliers able to certify products for rapid deployment gain a competitive edge in this time-sensitive environment.
Accelerating Federal Funding for Water Infrastructure Modernization
The Infrastructure Investment and Jobs Act allocates USD 55 billion for water systems, much of which targets aging valves that entered service 30-50 years ago. Municipalities prioritize smart, lead-free, and remotely actuated valves to increase leak detection efficiency and regulatory compliance. EPA revolving funds supplement federal grants, ensuring a steady pipeline of projects through 2030. Suppliers offering turnkey packages, including valves, actuators, and monitoring software, capture higher margins, especially in the Northeast and Midwest, where replacement urgency is acute. Long procurement cycles favor vendors with proven municipal references.
Steel and Alloy Price Volatility Squeezing OEM Margins
Spot steel prices fluctuated 40-60% in 2024, compressing margins for valve makers locked into long-term contracts. Smaller companies lacking hedging programs face greater earnings swings, sometimes redesigning products with alternative materials. Surcharge clauses and index-based pricing help larger firms offset volatility, but implementation requires customer negotiation and system updates. Volatility also complicates inventory planning, raising working capital requirements and potentially delaying innovation spending.
Other drivers and restraints analyzed in the detailed report include:
- Industrial IoT-Enabled Predictive Maintenance Adoption
- Hydrogen-Ready Valve Design Standards Emerging
- Skills Gap in Smart-Valve Commissioning and Maintenance
For complete list of drivers and restraints, kindly check the Table Of Contents.
Segment Analysis
Gate valves held 27.24% of the U.S. valve market share in 2025, reflecting their entrenched use in pipelines and water networks, where tight shut-off is mandatory. Their established specifications make them the default choice in many engineering standards, supporting steady demand for replacement. Butterfly valves gain momentum with a 5.05% CAGR, prized for compact footprints and fast quarter-turn operation in HVAC and automated process lines. The U.S. valves market size for butterfly designs grows as facility owners prioritize energy efficiency and remote control. Globe and check valves remain staples for throttling and backflow prevention, while control valves occupy higher-value niches driven by precision requirements. Growth in additive manufacturing prototypes enables rapid customization; however, large-scale production still favors traditional casting due to cost and durability considerations.
Engineering teams are increasingly evaluating total installed cost rather than purchase price, benefiting butterfly valves where weight savings reduce structural and actuation expenses. Conversely, gate valves maintain dominance in corrosive or abrasive services by offering robust wedge seals and full-bore flow paths. Digital position feedback retrofits allow legacy gate valves to integrate with plant DCS platforms, extending service life and aligning with modern monitoring strategies. Vendors that can support mixed fleets of gate and butterfly valves through unified asset-management software win maintenance contracts, thereby deepening customer stickiness in the U.S. valves market.
Steel products held a 40.88% market share in 2025, underpinned by their high tensile strength and temperature tolerance, which are essential for upstream energy and chemical processing applications. Improved metallurgy and coatings extend mean time between failure, safeguarding steel's role in critical services. Plastic valves grow at the fastest rate, with a 4.92% CAGR, driven by their corrosion resistance and lower installation weight in water treatment and certain chemical processes. The U.S. valves market size for plastics is expected to expand further as utilities address lead-replacement mandates.
Utilities weigh lifecycle costs, often selecting plastic for low-pressure lines where corrosion drives frequent steel replacement. Hybrid solutions, such as plastic-lined steel bodies, strike a balance between strength and chemical resistance, capturing a share of the mid-pressure range. Alloy-based materials maintain a premium position in extreme environments, such as nuclear and aerospace applications, although limited volumes restrict their market share. Cast iron continues to serve legacy municipal systems, but its use is slowly declining due to its weight and corrosion drawbacks. Material innovations remain pivotal to meeting increasingly stringent environmental and performance standards, especially as the introduction of hydrogen services presents new compatibility challenges.
Complete Report Scope:
- By Type
- Ball Valve
- Butterfly Valve
- Gate Valve
- Globe Valve
- Check Valve
- Plug Valve
- Control Valve
- Other Types
- By Material
- Steel
- Cast Iron
- Alloy-Based
- Plastic
- Other Materials
- By Actuation Method
- Manual
- Pneumatic
- Electric
- Hydraulic
- Other Actuation Methods
- By End-User Industry
- Oil and Gas
- Power Generation
- Chemical
- Water and Wastewater
- Mining
- Food and Beverage
- Pharmaceuticals
- Other End-User Industries
- By Region
- Northeast
- Midwest
- South
- West
List of Companies Covered in this Report:
- Emerson Electric Co.
- Schlumberger Limited
- Flowserve Corporation
- Crane Company
- Rotork plc
- Bray International, Inc.
- KITZ Corporation
- Parker-Hannifin Corporation
- Curtiss-Wright Corporation
- Watts Water Technologies, Inc.
- AVK Holding A/S
- Velan Inc.
- Johnson Controls International plc
- Honeywell International Inc.
- Spirax-Sarco Engineering plc
- Pentair plc
- Cameron (SLB)
- AUMA Riester GmbH and Co. KG
- Samson Aktiengesellschaft
- Swagelok Company
Additional Benefits:
- The market estimate (ME) sheet in Excel format
- 3 months of analyst support
TABLE OF CONTENTS
1 INTRODUCTION
- 1.1 Study Assumptions and Market Definition
- 1.2 Scope of the Study
2 RESEARCH METHODOLOGY
3 EXECUTIVE SUMMARY
4 MARKET LANDSCAPE
- 4.1 Market Overview
- 4.2 Market Drivers
- 4.2.1 Rapid Shale-Oil Refracturing Activity Boosting Valve Replacements
- 4.2.2 Accelerating Federal Funding for Water Infrastructure Modernization
- 4.2.3 Industrial IoT-Enabled Predictive Maintenance Adoption
- 4.2.4 Hydrogen-Ready Valve Design Standards Emerging
- 4.2.5 Federal Investment Tax Credits for Carbon-Capture Projects
- 4.2.6 Growth of Modular Data Centers Requiring Precision Cooling Valves
- 4.3 Market Restraints
- 4.3.1 Steel and Alloy Price Volatility Squeezing OEM Margins
- 4.3.2 Skills Gap in Smart-Valve Commissioning and Maintenance
- 4.3.3 Import Tariffs on Specialty Valve Castings
- 4.3.4 Cybersecurity Concerns Slowing Connected-Valve Deployments
- 4.4 Industry Value Chain Analysis
- 4.5 Impact of Macroeconomic Factors
- 4.6 Regulatory Landscape
- 4.7 Technological Outlook
- 4.8 Porter's Five Forces Analysis
- 4.8.1 Bargaining Power of Suppliers
- 4.8.2 Bargaining Power of Buyers
- 4.8.3 Threat of New Entrants
- 4.8.4 Threat of Substitutes
- 4.8.5 Intensity of Competitive Rivalry
- 4.9 Assessment of Impact of COVID-19
5 MARKET SIZE AND GROWTH FORECASTS (VALUE)
- 5.1 By Type
- 5.1.1 Ball Valve
- 5.1.2 Butterfly Valve
- 5.1.3 Gate Valve
- 5.1.4 Globe Valve
- 5.1.5 Check Valve
- 5.1.6 Plug Valve
- 5.1.7 Control Valve
- 5.1.8 Other Types
- 5.2 By Material
- 5.2.1 Steel
- 5.2.2 Cast Iron
- 5.2.3 Alloy-Based
- 5.2.4 Plastic
- 5.2.5 Other Materials
- 5.3 By Actuation Method
- 5.3.1 Manual
- 5.3.2 Pneumatic
- 5.3.3 Electric
- 5.3.4 Hydraulic
- 5.3.5 Other Actuation Methods
- 5.4 By End-User Industry
- 5.4.1 Oil and Gas
- 5.4.2 Power Generation
- 5.4.3 Chemical
- 5.4.4 Water and Wastewater
- 5.4.5 Mining
- 5.4.6 Food and Beverage
- 5.4.7 Pharmaceuticals
- 5.4.8 Other End-User Industries
- 5.5 By Region
- 5.5.1 Northeast
- 5.5.2 Midwest
- 5.5.3 South
- 5.5.4 West
6 COMPETITIVE LANDSCAPE
- 6.1 Market Concentration
- 6.2 Strategic Moves
- 6.3 Market Share Analysis
- 6.4 Company Profiles (includes Global level overview, Market level overview, Core Segments, Financials as available, Strategic Information, Market Rank/Share for key companies, Products and Services, and Recent Developments)
- 6.4.1 Emerson Electric Co.
- 6.4.2 Schlumberger Limited
- 6.4.3 Flowserve Corporation
- 6.4.4 Crane Company
- 6.4.5 Rotork plc
- 6.4.6 Bray International, Inc.
- 6.4.7 KITZ Corporation
- 6.4.8 Parker-Hannifin Corporation
- 6.4.9 Curtiss-Wright Corporation
- 6.4.10 Watts Water Technologies, Inc.
- 6.4.11 AVK Holding A/S
- 6.4.12 Velan Inc.
- 6.4.13 Johnson Controls International plc
- 6.4.14 Honeywell International Inc.
- 6.4.15 Spirax-Sarco Engineering plc
- 6.4.16 Pentair plc
- 6.4.17 Cameron (SLB)
- 6.4.18 AUMA Riester GmbH and Co. KG
- 6.4.19 Samson Aktiengesellschaft
- 6.4.20 Swagelok Company
7 MARKET OPPORTUNITIES AND FUTURE OUTLOOK
- 7.1 White-Space and Unmet-Need Assessment

 閥門:市場佔有率分析、行業趨勢和統計數據、成長預測(2026-2031 年)
 氣動閥門彈簧市場規模、佔有率和成長分析:按產品類型、材質、應用、分銷管道、最終用戶和地區分類-2026-2033年產業預測
 蓄壓器充壓閥市場分析及預測(至2035年):類型、產品、技術、組件、應用、製程、最終用戶、功能、安裝類型
 鋼製混合閥市場規模、佔有率和成長分析:按閥門類型、材質等級、應用、最終用戶、連接方式和地區分類-2026-2033年產業預測
 閥襯市場:全球市場預測,2026-2032年分流閥市場:全球市場預測,2026-2032年旋轉閥市場:全球市場預測,2026-2032年
 2026年全球高壓閥門市場報告2026年全球牛心包瓣膜市場報告
 2026-2030年全球閥門市場