


 |
市場調查報告書
商品編碼
2125337
沉澱二氧化矽:市場佔有率分析、產業趨勢與統計、成長預測(2026-2031)Precipitated Silica - Market Share Analysis, Industry Trends & Statistics, Growth Forecasts (2026 - 2031) |
||||||

※ 本網頁內容可能與最新版本有所差異。詳細情況請與我們聯繫。
根據 Mordor Intelligence 預測,沉澱二氧化矽市場預計將從 2025 年的 325 萬噸成長到 2026 年的 338 萬噸,到 2031 年達到 408 萬噸,2026 年至 2031 年的複合年成長率預計為 3.86%。
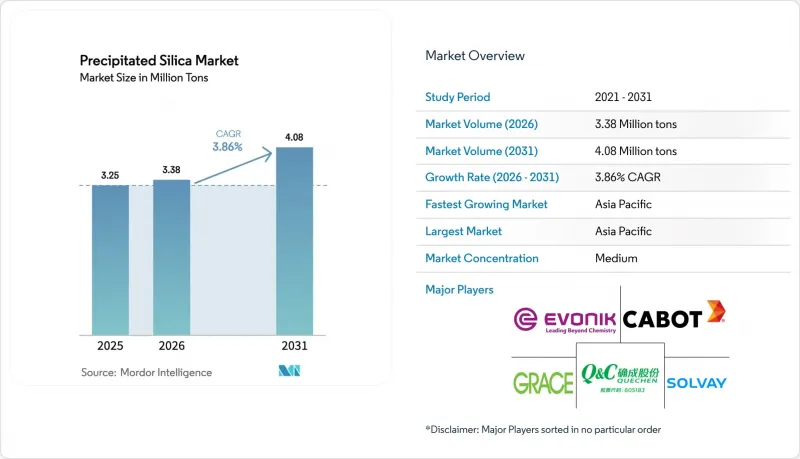
本報告按等級(橡膠、食品、飼料及其他)、形態(粉末、珠粒、微珠和顆粒)、生產流程(濕法和乾法)、終端應用行業(農業、口腔護理和化妝品、輪胎、電子產品等)以及地區(亞太地區、北美地區、歐洲地區、南美地區以及中東和非洲地區)進行細分。市場預測以噸為單位。
全球矽酸鹽沉降市場趨勢及洞察
受電氣化推動,對二氧化矽增強型電動車輪胎的需求增加。
電池組扭力和重量的增加正在加速電動車輪胎的磨損,但汽車製造商為了達到續航里程目標,不得不降低滾動阻力。將輪胎中二氧化矽的含量從10-15 phr提高到20-30 phr,可以在保持抓地力的同時,將滯後效應降低高達25%。在中國,預計2025年將生產950萬輛電池式電動車和插電式混合動力汽車,每輛車將消耗4-5條輪胎。這些輪胎的二氧化矽含量將比內燃機車型高出40-60%,將導致中國每年對二氧化矽的需求增加約5萬-7萬噸。歐盟輪胎標籤檢視標準的收緊(將於2024年中期生效)正在推動這一轉變,北美汽車製造商也正在採用類似的採購規範,無論原油價格如何波動,都將二氧化矽添加到其基準輪胎設計中。這一趨勢正在鞏固沉澱二氧化矽市場的結構性成長,並鼓勵各地區的生產商投資建設專門用於電動車級二氧化矽的生產能力。
推廣低滾動阻力環保輪胎的相關法規
在美國,企業平均燃油經濟性(CAFE)法規設定了2026款乘用車燃油經濟性目標為49英里/加侖(約5.3公升/百公里),要求汽車製造商採用低滾動阻力輪胎,以實現3-5%的燃油經濟性提升。 ASTM F2493測試程序與ISO 28580標準的協調統一,使得輪胎製造商能夠在全球範圍內持續檢驗二氧化矽配方。在日本和韓國,只有滾動阻力係數低於9.0的輪胎才能獲得最高等級的輪胎標籤,而這一水平幾乎不可能在不使用二氧化矽增強材料的情況下達到。此外,預計到2025年,這兩個市場乘用車輪胎的二氧化矽滲透率將超過70%。這些協調一致的政策確立了最低合規標準,保護了沉澱二氧化矽市場免受短期價格波動的影響,從而保障了產能擴張計畫的順利進行。
硫酸供應緊張導致成本上升。
沉澱二氧化矽的合成每噸產品需要0.3至0.4噸硫酸。 2024年美國元素硫產量下降5%至820萬噸,導致坦帕市硫酸合約價格飆升68%,從2024年第一季的每噸69美元漲至年底的每噸116美元。在中國,冶煉廠停產和出口限制進一步推高了現貨價格。儘管生產商正在考慮垂直整合硫回收業務,但回收工廠的建造成本超過5,000萬美元,投資回收期超過五年。這些高昂的成本給毛利率帶來了壓力,尤其是通用粉末級沉澱二氧化矽,從而抑制了短期內對沉澱二氧化矽市場的投資興趣。
細分市場分析
到2025年,橡膠用二氧化矽將佔總銷售量的55.12%,這反映了其在低滾動阻力輪胎胎面中的成熟應用。雖然食品級二氧化矽的銷售量較小,但預計到2031年,其複合年成長率將達到4.56%,是所有等級中成長最快的,這主要得益於全球品牌商採用清潔潔淨標示的抗結塊劑。到2025年,牙科用二氧化矽磨料的市場規模將達到約5億美元,這主要得益於牙膏在新興市場滲透率的持續提高。儘管橡膠級二氧化矽的銷售量仍然很高,但這些趨勢正日益推動食品和口腔護理等細分市場的成長,使沉澱二氧化矽市場的收入來源更加多元化。
穩定的法律規範,即美國食品藥物管理局 (FDA) 的 GRAS 規則 (21 CFR 172.480) 和歐洲食品安全局 (EFSA) 2018 年的聲明,降低了食品加工商配方變更的風險,並支持了該等級產品的推廣。同時,稻殼灰基材料的實例表明,即使採用生質能衍生的生產流程,也能達到輪胎級比表面積,從而縮小與現有濕式製程產品的成本差距。到 2031 年,食品級和口腔護理級產品合計可能佔特種用途沉澱二氧化矽市場近三分之一的佔有率,挑戰其在橡膠化合物領域的傳統主導地位。
由於粉狀二氧化矽易於分散在橡膠和塑膠中,預計到2025年,其出貨量將佔總出貨量的48.31%。同時,顆粒狀二氧化矽因其均勻的球形結構可防止顆粒感並保持流動性,在牙膏和化妝品凝膠需求的推動下,正以6.34%的複合年成長率成長。台灣、日本和印度每條生產線500萬至1000萬美元的噴霧乾燥設備投資正在擴大顆粒狀二氧化矽的產能,縮短供應鏈的前置作業時間。雖然粉狀二氧化矽仍將是主要產品,但顆粒狀二氧化矽有望在沉澱二氧化矽市場中開闢出一個高階細分市場,這得益於微塑膠法規豁免了無機二氧化矽的聚合物限制。
由於其均勻的顆粒形態,珠狀產品符合歐洲對微珠替代品的要求,口腔護理品牌正積極採用行銷策略,強調其快速溶解的特性。顆粒劑繼續用於農業混合物中,而微珠則在化妝品和塗料等細分市場中佔據了一席之地。因此,預計到2031年,珠狀產品的銷售額將佔總銷售額的20%以上,這將改變整個沉澱二氧化矽市場的銷售結構,並推高其平均售價。
區域分析
預計到2025年,亞太地區將佔全球銷售量的50.24%,並將以3.95%的複合年成長率持續成長至2031年。中國2025年電動車產量將達到950萬輛,這將支撐該地區對輪胎用二氧化矽的需求。同時,中國、印度和泰國的稻殼灰計畫正在開發低成本的供應來源。日本和韓國已實施嚴格的輪胎標示標準,強制要求使用二氧化矽進行增強,該地區二氧化矽的滲透率已超過70%。泰國的生質能相關合作項目,例如贏創的瑪塔普項目,正在加強原料的穩定供應,並協助實現碳中和。憑藉著這一發展勢頭,亞洲仍然是沉降二氧化矽市場投資週期的核心。
在北美和歐洲,贏創位於查爾斯頓的工廠擴建項目計劃於2026年1月投產,屆時濕法工藝產能將提升50%,以滿足日益成長的電動車輪胎訂單。同時,凱美提卡收購PPG的資產後,其位於查爾斯湖和代爾夫宰爾的工廠每年新增產能20萬噸。歐盟更嚴格的輪胎標籤法規和對微塑膠的禁令正在加速汽車和個人護理行業向二氧化矽替代品的轉變。然而,硫酸價格飆升給歐美生產商帶來了沉重壓力,凸顯了整個沉澱二氧化矽市場成本差異巨大。
南美洲及中東及非洲地區呈現局部成長態勢。在2024年汽車銷量達到210萬輛的背景下,巴西輪胎產業在本地需求的推動下正在復甦。阿根廷的化肥混合商正在採用二氧化矽作為流化劑,而波灣合作理事會(GCC)成員國則致力於將特種二氧化矽後向整合到下游石化產業叢集中。來自亞洲的物流成本通常為每噸100-150美元,這有利於現有濕式製程供應商。因此,在成熟的二氧化矽市場格局中,這些地區被視為具有戰略意義的第二成長機會。
其他好處:
- Excel格式的市場預測(ME)表
- 3個月的分析師支持
目錄
第1章:引言
- 研究假設和市場定義
- 調查範圍
第2章:調查方法
第3章執行摘要
第4章 市場狀況
- 市場概覽
- 市場促進因素
- 受電氣化推動,電動車對含二氧化矽輪胎的需求不斷成長。
- 監理機關推廣低滾動阻力的「環保型」輪胎。
- 在潔淨標示配方中採用食品級二氧化矽
- 利用稻殼灰在循環經濟中大規模生產二氧化矽(亞洲)
- 用於鋰離子電池隔離膜的高純度二氧化矽
- 市場限制因素
- 硫酸供應緊張導致成本上升。
- 汽車OEM廠商生產週期的波動性
- 消費者對二氧化矽基微塑膠(個人護理用品)的抵制
- 價值鏈分析
- 波特五力模型
第5章 市場規模與成長預測
- 按年級
- 橡膠級
- 食品級
- 牙科和口腔清潔用品等級
- 飼料級
- 其他(電池隔膜級和技術/工業級)
- 按形式
- 粉末
- 珠
- 微型珍珠
- 顆粒
- 透過生產過程
- 濕式工藝
- 乾法工藝
- 按最終用途行業分類
- 農業
- 口腔護理和化妝品
- 胎
- 電子設備
- 其他終端用戶產業
- 按地區
- 亞太地區
- 中國
- 印度
- 日本
- 韓國
- 其他亞太國家
- 北美洲
- 美國
- 加拿大
- 墨西哥
- 歐洲
- 德國
- 英國
- 義大利
- 法國
- 其他歐洲國家
- 南美洲
- 巴西
- 阿根廷
- 其他南美國家
- 中東和非洲
- 沙烏地阿拉伯
- 南非
- 其他中東和非洲國家
- 亞太地區
第6章 競爭情勢
- 市場集中度
- 策略趨勢
- 市佔率和排名分析
- 公司簡介
- Antenchem
- Cabot Corporation
- Denka Company Limited
- Evonik Industries AG
- FUJI SILYSIA CHEMICAL LTD.
- Huber Engineered Materials
- Jinsha Precipitated Silica Manufacturing Co., Ltd.
- Kadvani Chemicals Pvt. Ltd.
- Madhu Silica Pvt. Ltd.
- Oriental Silicas Corporation
- Qemetica
- Quechen Silicon Chemical
- Solvay
- Sunshine Industries
- Tata Chemicals Ltd.
- Tokuyama Corporation
- Tosoh Silica Corporation
- WR Grace & Co.
第7章 市場機會與未來展望
According to Mordor Intelligence, the precipitated silica market size is expected to increase from 3.25 Million tons in 2025 to 3.38 Million tons in 2026 and reach 4.08 Million tons by 2031, growing at a CAGR of 3.86% over 2026-2031.
This report is Segmented by Grade (Rubber, Food, Feed, and Others), Form (Powder, Beads, Micro-Pearls, and Granules), Production Process (Wet and Dry), End-Use Industry (Agriculture, Oral Care and Cosmetics, Tire, Electronics, and More), and Geography (Asia-Pacific, North America, Europe, South America, and the Middle East and Africa). The Market Forecasts are Provided in Terms of Volume (Tons).
Global Precipitated Silica Market Trends and Insights
Electrification-Driven Demand for Silica-Enhanced EV Tires
Instant torque and heavier battery packs make EV tires wear faster, yet range targets force automakers to curb rolling resistance. Raising precipitated silica loadings from 10-15 phr to 20-30 phr cuts hysteresis by up to 25% while preserving grip. China built 9.5 million battery-electric and plug-in hybrid vehicles in 2025, each consuming four to five tires with silica content 40-60% higher than combustion models, equating to roughly 50,000-70,000 t of incremental annual demand locally. Tightened EU tire-labeling thresholds that took effect mid-2024 reinforce the shift, and North American OEMs have adopted similar procurement specs, embedding silica into baseline tire designs irrespective of oil-price swings. The trend locks in structural growth for the precipitated silica market, encouraging producers to invest in dedicated EV-grade capacity across all regions.
Regulatory Push for Low-Rolling-Resistance Green Tires
Corporate Average Fuel Economy rules set 49 mpg targets for model-year 2026 passenger cars in the United States, compelling automakers to mandate low-rolling-resistance tires that can deliver 3-5% fuel savings. ASTM F2493 test procedures and ISO 28580 harmonization let tire makers validate silica formulations consistently worldwide. Japan and South Korea award top tire-label grades only for rolling-resistance coefficients under 9.0, a level nearly unreachable without silica reinforcement, and both markets exceeded 70% silica penetration in passenger-car tires during 2025. These synchronized policies form a compliance floor that shields the precipitated silica market from short-term price cycles, thereby sustaining capacity-expansion pipelines.
Tight Sulfuric-Acid Supply Inflating Costs
Precipitated silica synthesis needs 0.3-0.4 t of sulfuric acid per tonne of product. US elemental sulfur output slid 5% to 8.2 million t in 2024, driving Tampa contract acid prices from USD 69/t in Q1 2024 to USD 116/t by year-end, a 68% surge. Chinese spot prices climbed even faster due to smelter shutdowns and export curbs. Producers weigh backward integration into sulfur recovery, yet regeneration plants cost more than USD 50 million, and paybacks stretch past five years. These cost spikes compress gross margins, particularly for commodity powder grades, and temper near-term investment appetite in the precipitated silica market.
Other drivers and restraints analyzed in the detailed report include:
- Food-Grade Silica Uptake in Clean-Label Formulations
- Rice-Husk-Ash Circular-Economy Silica Scale-Up
- Automotive OEM Production-Cycle Volatility
For complete list of drivers and restraints, kindly check the Table Of Contents.
Segment Analysis
Rubber-grade silica held 55.12% of volume in 2025, reflecting entrenched use in low-rolling-resistance tire tread. Food-grade volumes, though smaller, are growing at 4.56% CAGR through 2031, the fastest among all grades, as global brand owners adopt clean-label anti-caking agents. Dental-silica abrasives reached about USD 500 million in 2025, backed by rising toothpaste penetration in emerging economies. These dynamics keep rubber volumes high, yet incremental growth increasingly stems from food and oral-care niches, diversifying revenue streams inside the precipitated silica market.
Steady regulatory frameworks, the FDA's GRAS rule 21 CFR 172.480, and EFSA's 2018 opinion, lower reformulation risk for food processors, underpinning the grade's expansion. Meanwhile, rice-husk-ash feedstock demonstrates that biomass routes can deliver tire-grade surface areas, narrowing cost gaps with wet-process incumbents. By 2031, food and oral-care grades together could approach one-third of the precipitated silica market size for specialty applications, challenging the traditional dominance of rubber compounds.
Powder accounted for 48.31% of 2025 shipments because it disperses easily into rubber and plastics. Beads, however, are advancing at 6.34% CAGR on the back of toothpaste and cosmetic gel demand, where uniform spheres prevent grit and maintain flow. Spray-drying investments of USD 5-10 million per line have lifted bead capacity across Taiwan, Japan, and India, trimming supply-chain lead times. Powder will remain the workhorse, yet beads are set to carve a premium sub-segment of the precipitated silica market, bolstered by microplastics regulations that exclude inorganic silica from polymer restrictions.
Consistent particle morphology allows beads to meet European microbead replacements, and oral-care brands capitalize on marketing claims around faster dissolution. Granules continue serving agricultural blends, while micro-pearls hold niche cosmetic and coating positions. As a result, beads could exceed 20% of form sales by 2031, shifting revenue mix and raising average selling prices across the precipitated silica market.
Complete Report Scope:
- By Grade
- Rubber Grade
- Food Grade
- Dental/Oral-Care Grade
- Feed Grade
- Others (Battery-Separator Grade and Technical/Industrial Grade)
- By Form
- Powder
- Beads
- Micro-pearls
- Granules
- By Production Process
- Wet Process
- Dry Process
- By End-use Industry
- Agriculture
- Oral Care and Cosmetics
- Tire
- Electronics
- Other End-user Industries
- By Geography
- Asia-Pacific
- China
- India
- Japan
- South Korea
- Rest of Asia-Pacific
- North America
- United States
- Canada
- Mexico
- Europe
- Germany
- United Kingdom
- Italy
- France
- Rest of Europe
- South America
- Brazil
- Argentina
- Rest of South America
- Middle-East and Africa
- Saudi Arabia
- South Africa
- Rest of Middle-East and Africa
- Asia-Pacific
Geography Analysis
Asia-Pacific retained 50.24% of 2025 volume and is set for 3.95% CAGR through 2031. China's 9.5 million EV output in 2025 underpins local tire-grade silica demand, while rice-husk-ash projects across China, India, and Thailand unlock low-cost supply. Japan and South Korea enforce stringent tire-label grades that require silica reinforcement, pushing regional penetration above 70%. Thai biomass tie-ups, such as Evonik's Map Ta Phut venture, enhance feedstock security and carbon credentials. This momentum keeps Asia at the core of the precipitated silica market investment cycle.
In North America and Europe, Evonik's Charleston expansion, operational in January 2026, boosts wet-process capacity by 50% to serve rising EV-tire orders, while Qemetica's purchase of PPG's assets added 200,000 t pa across Lake Charles and Delfzijl. EU tire-label tightening and microplastics bans accelerate silica substitution in both automotive and personal-care channels. However, sulfuric-acid price inflation weighs on European and US producers, highlighting cost-structure disparities across the precipitated silica market.
South America and the Middle East & Africa show selective growth pockets. Brazil's tire industry recovered alongside 2.1 million vehicle sales in 2024, spurring local demand. Argentina's fertilizer blenders employ silica as a flow agent, while Gulf Cooperation Council nations aim to backward-integrate specialty silica into downstream petrochemicals clusters. Logistics costs from Asia often add USD 100-150/t, protecting entrenched wet-process suppliers. These regions thus remain strategic second-tier opportunities within the precipitated silica market landscape.
- Antenchem
- Cabot Corporation
- Denka Company Limited
- Evonik Industries AG
- FUJI SILYSIA CHEMICAL LTD.
- Huber Engineered Materials
- Jinsha Precipitated Silica Manufacturing Co., Ltd.
- Kadvani Chemicals Pvt. Ltd.
- Madhu Silica Pvt. Ltd.
- Oriental Silicas Corporation
- Qemetica
- Quechen Silicon Chemical
- Solvay
- Sunshine Industries
- Tata Chemicals Ltd.
- Tokuyama Corporation
- Tosoh Silica Corporation
- W. R. Grace & Co.
Additional Benefits:
- The market estimate (ME) sheet in Excel format
- 3 months of analyst support
TABLE OF CONTENTS
1 Introduction
- 1.1 Study Assumptions and Market Definition
- 1.2 Scope of the Study
2 Research Methodology
3 Executive Summary
4 Market Landscape
- 4.1 Market Overview
- 4.2 Market Drivers
- 4.2.1 Electrification-driven demand for silica-enhanced EV tyres
- 4.2.2 Regulatory push for low-rolling-resistance "green" tyres
- 4.2.3 Food-grade silica uptake in clean-label formulations
- 4.2.4 Rice-husk-ash circular-economy silica scale-up (Asia)
- 4.2.5 High-purity silica for Li-ion battery separators
- 4.3 Market Restraints
- 4.3.1 Tight sulphuric-acid supply inflating costs
- 4.3.2 Automotive OEM production-cycle volatility
- 4.3.3 Consumer backlash on silica micro-plastics (personal care)
- 4.4 Value Chain Analysis
- 4.5 Porter's Five Forces
- 4.5.1 Bargaining Power of Suppliers
- 4.5.2 Bargaining Power of Buyers
- 4.5.3 Threat of New Entrants
- 4.5.4 Threat of Substitutes
- 4.5.5 Degree of Competition
5 Market Size and Growth Forecasts (Volume)
- 5.1 By Grade
- 5.1.1 Rubber Grade
- 5.1.2 Food Grade
- 5.1.3 Dental/Oral-Care Grade
- 5.1.4 Feed Grade
- 5.1.5 Others (Battery-Separator Grade and Technical/Industrial Grade)
- 5.2 By Form
- 5.2.1 Powder
- 5.2.2 Beads
- 5.2.3 Micro-pearls
- 5.2.4 Granules
- 5.3 By Production Process
- 5.3.1 Wet Process
- 5.3.2 Dry Process
- 5.4 By End-use Industry
- 5.4.1 Agriculture
- 5.4.2 Oral Care and Cosmetics
- 5.4.3 Tire
- 5.4.4 Electronics
- 5.4.5 Other End-user Industries
- 5.5 By Geography
- 5.5.1 Asia-Pacific
- 5.5.1.1 China
- 5.5.1.2 India
- 5.5.1.3 Japan
- 5.5.1.4 South Korea
- 5.5.1.5 Rest of Asia-Pacific
- 5.5.2 North America
- 5.5.2.1 United States
- 5.5.2.2 Canada
- 5.5.2.3 Mexico
- 5.5.3 Europe
- 5.5.3.1 Germany
- 5.5.3.2 United Kingdom
- 5.5.3.3 Italy
- 5.5.3.4 France
- 5.5.3.5 Rest of Europe
- 5.5.4 South America
- 5.5.4.1 Brazil
- 5.5.4.2 Argentina
- 5.5.4.3 Rest of South America
- 5.5.5 Middle-East and Africa
- 5.5.5.1 Saudi Arabia
- 5.5.5.2 South Africa
- 5.5.5.3 Rest of Middle-East and Africa
- 5.5.1 Asia-Pacific
6 Competitive Landscape
- 6.1 Market Concentration
- 6.2 Strategic Moves
- 6.3 Market Share(%)/Ranking Analysis
- 6.4 Company Profiles (includes Global level Overview, Market level overview, Core Segments, Financials as available, Strategic Information, Products and Services, and Recent Developments)
- 6.4.1 Antenchem
- 6.4.2 Cabot Corporation
- 6.4.3 Denka Company Limited
- 6.4.4 Evonik Industries AG
- 6.4.5 FUJI SILYSIA CHEMICAL LTD.
- 6.4.6 Huber Engineered Materials
- 6.4.7 Jinsha Precipitated Silica Manufacturing Co., Ltd.
- 6.4.8 Kadvani Chemicals Pvt. Ltd.
- 6.4.9 Madhu Silica Pvt. Ltd.
- 6.4.10 Oriental Silicas Corporation
- 6.4.11 Qemetica
- 6.4.12 Quechen Silicon Chemical
- 6.4.13 Solvay
- 6.4.14 Sunshine Industries
- 6.4.15 Tata Chemicals Ltd.
- 6.4.16 Tokuyama Corporation
- 6.4.17 Tosoh Silica Corporation
- 6.4.18 W. R. Grace & Co.
7 Market Opportunities and Future Outlook
- 7.1 White-Space and Unmet-Need Assessment

 印度沉澱二氧化矽:市場佔有率分析、產業趨勢與統計、成長預測(2026-2031)
 沉澱二氧化矽市場-2026-2032年全球市場預測
 沉澱二氧化矽市場規模、佔有率、成長、全球產業分析、區域洞察及2026-2034年預測。
 全球沉澱二氧化矽市場:市場規模、佔有率和趨勢分析(按應用和地區分類),細分市場預測(2026-2033 年)
 2026年全球沉澱二氧化矽市場報告
 沉澱二氧化矽市場規模、佔有率及成長分析(按應用、最終用戶及地區分類)-2026-2033年產業預測
 2032 年沈澱二氧化矽市場預測:按等級、形式、製造流程、來源、應用、最終用戶和地區進行的全球分析
 沉澱二氧化矽市場機會、成長動力、產業趨勢分析及2025-2034年預測
 全球沉澱二氧化矽市場(至 2030 年)按應用(橡膠、食品、塑膠、電池隔膜、其他)、最終用戶產業(汽車、化妝品、電子、農業)、等級(橡膠、食品、工業、化妝品)和地區分類