

 |
市場調查報告書
商品編碼
2124957
美國工程服務:市場佔有率分析、產業趨勢與統計及成長預測(2026-2031 年)United States Engineering Services - Market Share Analysis, Industry Trends & Statistics, Growth Forecasts (2026 - 2031) |
||||||

※ 本網頁內容可能與最新版本有所差異。詳細情況請與我們聯繫。
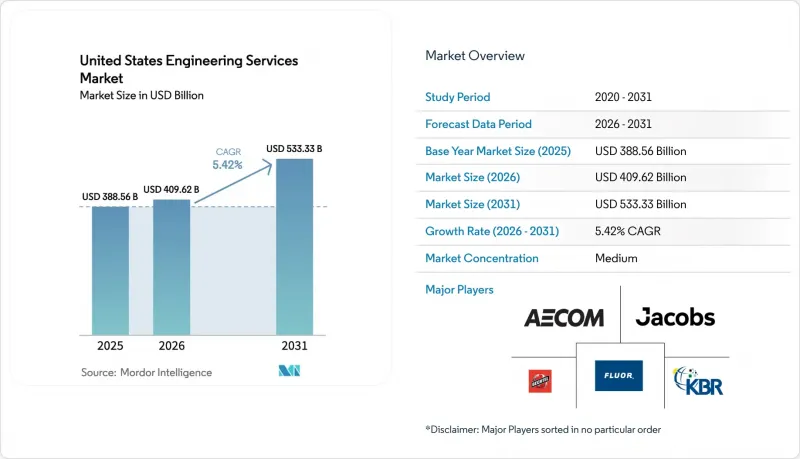
據 Mordor Intelligence 稱,2025 年美國工程服務市值為 3874.2 億美元,預計到 2031 年將達到 5333.3 億美元,而 2026 年為 4096.2 億美元,2026 年至 2031 年預測成長率為 5.42%。
本報告按應用領域(土木工程、機械工程、電氣工程、環境工程、化學工程、結構工程、軟體系統)、服務類型(諮詢與設計、其他)、最終用戶產業(建築與基礎設施、石油與天然氣、其他)、合作模式(內部、其他)和地區進行細分。市場預測以美元計價。
美國工程服務市場的趨勢與洞察
IIJA提供聯邦基礎設施資金。
《基礎設施投資與就業法案》(IIJA)已確保到2026年獲得5,500億美元的新資金,具體分配如下:1,100億美元用於公路和橋樑,660億美元用於鐵路,650億美元用於寬頻建設。隨著各州將布倫特-斯彭斯大橋重建和門戶隧道等重大項目推進採購階段,設計公司正在爭取早期規劃和施工管理的補償。 「購買美國貨」條款要求工程師檢驗國內鋼鐵和水泥供應鏈,這導致設計工期延長至多一年,並增加了計費調整時間。為滿足擔保要求,小型、中型和大型工程、採購、施工和管理(EPCM)公司之間的合資企業數量激增,這不僅擴大了補償分配範圍,也增加了參與企業的數量。中期來看,穩定的預算分配和簡化的津貼發放預計將使土木和結構工程領域的訂單積壓保持穩定。
加速半導體製造廠和電池超級工廠的建設
根據《晶片和工業安全法案》(CHIPS)和《科學法》提供的527億美元獎勵方案,2024年至2026年間共宣布了23個製造項目。每個專案都需要隔振地基、超純水循環系統和製程排氣系統,這擴大了機械、電氣和化學工程師的工作範圍。同樣,位於喬治亞、田納西州和密西根州的電池超級工廠也推動了對無塵室和高壓變電站設計的需求。儘管企業正在採用模組化模板來標準化設備連接,但場地特定的地震和環境限制仍然需要客製化工程設計,這也導致了高額的工程報酬。
由於長期缺乏技術純熟勞工,導致帳單成本增加。
40%的註冊工程師年齡超過55歲,而2022年至2025年間,獲得ABET(美國工程認證委員會)認證的註冊工程師人數以每年3%的速度下降。企業每年將應屆畢業生的起薪提高8%至12%,這給固定價格合約的利潤率帶來了壓力。將一些不太複雜的繪圖工作外包給印度或菲律賓只能部分緩解人手不足的壓力,因為仍需要美國專家的簽署。能夠自動產生符合標準的佈局圖的自動化工具或許是一種解決方案,但由於大多數監管機構只允許將其用於倉庫和輕工業設施類型,因此其短期影響有限。
細分市場分析
預計到2025年,土木工程將占美國工程服務市場規模的34.59%。這一成長將主要得益於IIJA資助的橋樑維修、公路拓寬和雨水排水系統改進項目。隨著公共產業對其電網進行現代化改造,以及製造商利用工業IoT平台對其工廠維修,軟體和系統工程預計將在2031年之前以5.89%的複合年成長率成長。隨著可容納50kW機架密度的液冷資料中心設計的普及,對機械工程的需求不斷成長;而隨著相量計量裝置和自動饋線開關的引入,電氣工程的範圍也在擴大,這些裝置和開關有助於提高電網的可靠性。環境工程持續獲得與PFAS(全氟烷基物質)清理和濕地替代措施相關的訂單,而結構工程專業人員則受益於西海岸的抗震加固法規。
對軟體和系統解決方案日益成長的需求反映了業主對營運技術 (OT) 網路威脅的擔憂,尤其是在關鍵基礎設施領域。如今,合約通常將軟體編碼與 OT 安全增強功能捆綁在一起,為熟悉零信任架構的公司提供了穩定可靠的收入來源。只要 IIJA 的預算撥款持續,土木工程預計至少在 2028 年之前仍將保持主導地位;但如果國會未能按高於以往標準的水平續簽陸路交通撥款,其成長速度可能會放緩。整體而言,應用領域的多元化使美國工程服務市場免受個別細分市場週期性波動的影響。
至2025年,諮詢和設計服務占美國工程服務市場佔有率的38.11%。這主要是由於投資者在投入資金之前,需要詳細的早期方案來確定專案範圍和成本。預計到2031年,自動化和數位工程的複合年成長率將達到5.67%。這反映了BIM二級標準的強制實施以及數位孿生技術在縮短試運行週期方面的應用。製程和工廠工程正受益於半導體和電池工廠日益成長的需求,這些工廠在訂購設備之前需要管道和儀器以及危險區域分類。產品工程仍然集中在航太和國防領域,該領域在製造之前會使用有限元素方法和熱分析來檢驗設計。
隨著老舊橋樑和變電站的狀況評估和生命週期建模變得日益必要,資產管理的範圍正在不斷擴大。對施工管理的需求仍然強勁,客戶會根據專案的複雜程度,在「風險管理案例管理(CMAR)」模式和「設計-建造(DB)」模式之間進行選擇。隨著碰撞檢測和4D調度工具的普及,美國自動化服務相關的工程服務市場規模預計將擴大。這將有助於減少浪費,根據美國總承包商協會(AGC)估計,浪費佔建築預算的5%至10%。將這些工具納入固定價格提案的公司,透過有效地將先前由客戶承擔的技術成本貨幣化,從而維持了較高的利潤率。
其他好處
- Excel格式的市場預測(ME)表
- 3個月的分析師支持
目錄
第1章:引言
- 研究假設和市場定義
- 調查範圍
第2章:調查方法
第3章執行摘要
第4章 市場狀況
- 市場概覽
- 市場促進因素
- IIJA提供聯邦基礎設施資金。
- 加速半導體製造廠和電池超級工廠的建設
- 先進製造生產線的近岸外包
- 電力公司規模的可再生能源併網項目訂單積壓量達到歷史新高。
- 需要專門工程技術的國防現代化項目
- 透過引入人工智慧驅動的數位孿生技術,可以減少返工。
- 維修以增強老舊基礎設施應對氣候變遷的能力
- 更嚴格的建築能效標準將加速機電設備(機械能處理裝置)的重新設計。
- 市場限制因素
- 與鋼材和混凝土投入成本波動相關的成本轉移風險。
- NEPA和州環境審查程序耗時更長。
- 由於長期缺乏技術純熟勞工,導致帳單成本增加。
- 各州工程師執照制度的差異
- 專業責任責任險保費上漲
- 產業價值鏈分析
- 宏觀經濟因素對市場的影響
- 監管和技術展望
- 波特五力分析
- 比較分析:內部工程與外包工程
- 供應商服務創新趨勢
第5章 市場規模與成長預測
- 透過使用
- 土木工程
- 機器
- 電
- 環境
- 化學
- 結構
- 軟體系統
- 按服務類型
- 諮詢與設計
- 製程和工廠工程
- 產品開發與原型製作
- 自動化和數位工程
- 資產管理及維
- 施工管理
- 按最終用戶行業分類
- 建築和基礎設施
- 石油和天然氣
- 製造業
- 公共產業(電力、水)
- 交通運輸(鐵路、機場、港口)
- 通訊和資料中心
- 醫療機構
- 國防/航太
- 可再生能源項目
- 按參與模式
- 內部
- 外包、工程總承包管理
- 官民合作關係(PPP)框架
- 按地區
- 東北
- 中西部
- 南部
- 西
第6章 競爭情勢
- 市場集中度
- 策略趨勢
- 市佔率分析
- 公司簡介
- AECOM
- Jacobs Engineering Group Inc.
- Bechtel Corporation
- Fluor Corporation
- KBR, Inc.
- HDR, Inc.
- Terracon Consultants, Inc.
- Black & Veatch Holding Company
- Jensen Hughes, Inc.
- ECS Limited
- WSP USA Inc.
- Tetra Tech, Inc.
- STV Group, Inc.
- Arup US, Inc.
- Gannett Fleming, Inc.
- Burns & McDonnell Engineering Company, Inc.
- HNTB Corporation
- Parsons Corporation
- Louis Berger US, Inc.
- AtkinsRealis USA Inc.
- Ghafari Associates, LLC
- Kimley-Horn and Associates, Inc.
- Dewberry Engineers Inc.
- Michael Baker International, Inc.
第7章 市場機會與未來展望
According to Mordor Intelligence, the United States engineering services market size was valued at USD 387.42 billion in 2025 and estimated to grow from USD 409.62 billion in 2026 to reach USD 533.33 billion by 2031, at a CAGR of 5.42% during the forecast period 2026-2031.
This report is Segmented by Application (Civil, Mechanical, Electrical, Environmental, Chemical, Structural, and Software and Systems), Service Type (Consulting and Design, and More), End-User Industry (Construction and Infrastructure, Oil and Gas, and More), Engagement Model (In-House, and More), and Geography. The Market Forecasts are Provided in Terms of Value (USD).
United States Engineering Services Market Trends and Insights
Federal Infrastructure Funding Under IIJA
The Infrastructure Investment and Jobs Act unlocked USD 550 billion in fresh allocations through 2026, including USD 110 billion for roads and bridges, USD 66 billion for rail, and USD 65 billion for broadband. Design firms are securing front-end planning and construction-management fees as states move stalwart projects like the Brent Spence Bridge replacement and the Gateway Tunnel into procurement. Buy-America clauses are stretching design schedules by up to a year as engineers validate domestic steel and cement supply chains, expanding billable coordination hours. Joint ventures between small and large EPCMs are proliferating to meet bonding thresholds, fragmenting fee pools yet widening participation. Over the medium term, consistent appropriations and streamlined grant disbursement will keep civil and structural backlogs robust.
Accelerating Semiconductor Fabs and Battery Gigafactory Construction
The CHIPS and Science Act's USD 52.7 billion incentive package has catalysed 23 announced fabs between 2024 and 2026. Each facility demands vibration-isolated foundations, ultra-pure water loops, and process exhaust systems, enlarging the addressable scope for mechanical, electrical, and chemical engineers. Battery gigafactories in Georgia, Tennessee, and Michigan are likewise driving cleanroom and high-voltage substation design mandates. Firms are deploying modular templates that standardize tool hook-ups, yet site-specific seismic and environmental constraints preserve the need for bespoke engineering, sustaining premium fee rates.
Persistent Skilled-Labor Shortages Inflating Billing Rates
Forty percent of licensed engineers are over 55, and ABET enrolments fell 3% annually from 2022-2025. Firms are raising entry-level pay by 8-12% a year, compressing margins on fixed-price contracts. Outsourcing low-complexity drafting to India and the Philippines offsets only a portion of labour pressure, as U.S.-based professional seals remain mandatory. Automation tools that autogenerate code-compliant layouts promise relief, yet most regulators accept them only for warehousing and light-industrial typologies, limiting near-term impact.
Other drivers and restraints analyzed in the detailed report include:
- AI-Enabled Digital Twin Adoption Reducing Re-work
- Record Utility-Scale Renewable Interconnection Backlog
- Lengthy NEPA and State Environmental Reviews
For complete list of drivers and restraints, kindly check the Table Of Contents.
Segment Analysis
Civil engineering accounted for 34.59% of the United States engineering services market size in 2025, fuelled by bridge rehabilitation, highway widening, and storm-water upgrades funded under the IIJA. Software and systems engineering is on track for a 5.89% CAGR through 2031 as utilities modernize distribution grids and manufacturers retrofit plants with industrial IoT platforms. Mechanical engineering demand is climbing in parallel with data-center liquid-cooling designs handling 50 kW rack densities, while electrical engineering scopes are expanding with phasor measurement units and automated feeder switches that underpin grid reliability. Environmental engineering continues to capture mandates for PFAS remediation and wetland mitigation, whereas structural specialists gain from seismic-retrofit rules on the West Coast.
The preference for software and systems solutions mirrors owner concern over operational-technology cyber threats, especially across critical infrastructure. Contracts now bundle software coding with OT hardening, creating steady retainer revenue for firms versed in zero-trust architectures. Civil engineering will stay dominant until at least 2028 while IIJA allocations flow, yet growth could taper without fresh congressional surface-transport authorizations at elevated levels. Overall, application diversity cushions the United States engineering services market from cyclical swings in any single discipline.
Consulting and design services captured 38.11% of the 2025 United States engineering services market share as owners required detailed front-end packages to pin down scope and cost before mobilizing capital. Automation and digital engineering is projected to post a 5.67% CAGR through 2031, reflecting BIM Level 2 mandates and digital-twin adoption that compress commissioning cycles. Process and plant engineering rides the semiconductor and battery-plant wave, demanding piping and instrumentation diagrams and hazardous-area classifications ahead of equipment orders. Product engineering remains concentrated within aerospace and defense, where finite-element and thermal modelling validate designs prior to fabrication.
Asset-management scopes are rising as aging bridges and substations need condition assessments and lifecycle modelling. Construction-management demand stays steady, with owners choosing between construction-manager-at-risk and design-build depending on complexity. The United States engineering services market size tied to automation services will advance as clash-detection and 4D scheduling tools become mainstream, reducing the waste that the Associated General Contractors of America pegs at 5-10% of construction budgets. Firms embedding such tools within fixed-fee proposals effectively monetize technology previously borne by owners, sustaining margin resilience.
Complete Report Scope:
- By Application
- Civil
- Mechanical
- Electrical
- Environmental
- Chemical
- Structural
- Software and Systems
- By Service Type
- Consulting and Design
- Process and Plant Engineering
- Product Engineering and Prototyping
- Automation and Digital Engineering
- Asset Management and O&M
- Construction Management
- By End-user Industry
- Construction and Infrastructure
- Oil and Gas
- Manufacturing
- Utilities (Power, Water)
- Transportation (Rail, Airports, Ports)
- Telecommunications and Data Centers
- Healthcare Facilities
- Defense and Aerospace
- Renewable Energy Projects
- By Engagement Model
- In-house
- Outsourced, EPCM
- Public-Private Partnership (PPP) Frameworks
- By Geography
- Northeast
- Midwest
- South
- West
List of Companies Covered in this Report:
- AECOM
- Jacobs Engineering Group Inc.
- Bechtel Corporation
- Fluor Corporation
- KBR, Inc.
- HDR, Inc.
- Terracon Consultants, Inc.
- Black & Veatch Holding Company
- Jensen Hughes, Inc.
- ECS Limited
- WSP USA Inc.
- Tetra Tech, Inc.
- STV Group, Inc.
- Arup US, Inc.
- Gannett Fleming, Inc.
- Burns & McDonnell Engineering Company, Inc.
- HNTB Corporation
- Parsons Corporation
- Louis Berger U.S., Inc.
- AtkinsRealis USA Inc.
- Ghafari Associates, LLC
- Kimley-Horn and Associates, Inc.
- Dewberry Engineers Inc.
- Michael Baker International, Inc.
Additional Benefits:
- The market estimate (ME) sheet in Excel format
- 3 months of analyst support
TABLE OF CONTENTS
1 INTRODUCTION
- 1.1 Study Assumptions and Market Definition
- 1.2 Scope of the Study
2 RESEARCH METHODOLOGY
3 EXECUTIVE SUMMARY
4 MARKET LANDSCAPE
- 4.1 Market Overview
- 4.2 Market Drivers
- 4.2.1 Federal Infrastructure Funding under IIJA
- 4.2.2 Accelerating Semiconductor Fabs and Battery Gigafactory Construction
- 4.2.3 Near-shoring Advanced Manufacturing Lines
- 4.2.4 Record Utility-Scale Renewable Interconnection Backlog
- 4.2.5 Defense Modernization Programs Requiring Specialized Engineering
- 4.2.6 AI-Enabled Digital Twin Adoption Reducing Re-work
- 4.2.7 Climate-Resilience Retrofits of Aging Infrastructure
- 4.2.8 Stricter Building Energy Codes Driving MEP Redesigns
- 4.3 Market Restraints
- 4.3.1 Volatile Steel and Concrete Input-Cost Pass-Through Risk
- 4.3.2 Lengthy NEPA and State Environmental Reviews
- 4.3.3 Persistent Skilled-Labor Shortages Inflating Billing Rates
- 4.3.4 State-by-State Engineering Licensing Variances
- 4.3.5 Rising Professional Liability Insurance Premiums
- 4.4 Industry Value-Chain Analysis
- 4.5 Impact of Macroeconomic Factors on the Market
- 4.6 Regulatory and Technological Outlook
- 4.7 Porter's Five Forces Analysis
- 4.7.1 Bargaining Power of Buyers
- 4.7.2 Bargaining Power of Suppliers
- 4.7.3 Threat of New Entrants
- 4.7.4 Threat of Substitutes
- 4.7.5 Intensity of Competitive Rivalry
- 4.8 Comparative Analysis, In-house vs Outsourced Engineering
- 4.9 Vendor Service Innovation Trends
5 MARKET SIZE AND GROWTH FORECASTS (VALUE)
- 5.1 By Application
- 5.1.1 Civil
- 5.1.2 Mechanical
- 5.1.3 Electrical
- 5.1.4 Environmental
- 5.1.5 Chemical
- 5.1.6 Structural
- 5.1.7 Software and Systems
- 5.2 By Service Type
- 5.2.1 Consulting and Design
- 5.2.2 Process and Plant Engineering
- 5.2.3 Product Engineering and Prototyping
- 5.2.4 Automation and Digital Engineering
- 5.2.5 Asset Management and O&M
- 5.2.6 Construction Management
- 5.3 By End-user Industry
- 5.3.1 Construction and Infrastructure
- 5.3.2 Oil and Gas
- 5.3.3 Manufacturing
- 5.3.4 Utilities (Power, Water)
- 5.3.5 Transportation (Rail, Airports, Ports)
- 5.3.6 Telecommunications and Data Centers
- 5.3.7 Healthcare Facilities
- 5.3.8 Defense and Aerospace
- 5.3.9 Renewable Energy Projects
- 5.4 By Engagement Model
- 5.4.1 In-house
- 5.4.2 Outsourced, EPCM
- 5.4.3 Public-Private Partnership (PPP) Frameworks
- 5.5 By Geography
- 5.5.1 Northeast
- 5.5.2 Midwest
- 5.5.3 South
- 5.5.4 West
6 COMPETITIVE LANDSCAPE
- 6.1 Market Concentration
- 6.2 Strategic Moves
- 6.3 Market Share Analysis
- 6.4 Company Profiles (includes Global Level Overview, Market Level Overview, Core Segments, Financials as available, Strategic Information, Market Rank/Share, Products and Services, Recent Developments)
- 6.4.1 AECOM
- 6.4.2 Jacobs Engineering Group Inc.
- 6.4.3 Bechtel Corporation
- 6.4.4 Fluor Corporation
- 6.4.5 KBR, Inc.
- 6.4.6 HDR, Inc.
- 6.4.7 Terracon Consultants, Inc.
- 6.4.8 Black & Veatch Holding Company
- 6.4.9 Jensen Hughes, Inc.
- 6.4.10 ECS Limited
- 6.4.11 WSP USA Inc.
- 6.4.12 Tetra Tech, Inc.
- 6.4.13 STV Group, Inc.
- 6.4.14 Arup US, Inc.
- 6.4.15 Gannett Fleming, Inc.
- 6.4.16 Burns & McDonnell Engineering Company, Inc.
- 6.4.17 HNTB Corporation
- 6.4.18 Parsons Corporation
- 6.4.19 Louis Berger U.S., Inc.
- 6.4.20 AtkinsRealis USA Inc.
- 6.4.21 Ghafari Associates, LLC
- 6.4.22 Kimley-Horn and Associates, Inc.
- 6.4.23 Dewberry Engineers Inc.
- 6.4.24 Michael Baker International, Inc.
7 MARKET OPPORTUNITIES AND FUTURE OUTLOOK
- 7.1 White-space and Unmet-Need Assessment

 2026-2034年全球人工智慧(AI)工程市場規模、佔有率、趨勢和成長分析報告
 工程服務市場-2026-2032年全球市場預測
 2026-2036年全球引擎及引擎零件試驗鑽機市場
 法醫工程市場規模、佔有率和趨勢分析報告:按服務、最終用途、應用、地區和細分市場分類(2026-2033 年)工程實驗室即服務 (ELaaS) 市場:市場規模、佔有率和趨勢分析(按實驗室類型、訪問模式、最終用途和地區分類),細分市場預測(2026-2033 年)繪圖服務市場:全球市場按產品類型、價格範圍、應用和最終用戶分類的預測 - 2026-2032 年
 2026年全球人工智慧(AI)工程市場報告
 亞太地區工程研發服務:市佔率分析、產業趨勢與統計、成長預測(2026-2031)2026年全球工程服務市場報告2026年全球工程研發外包市場報告