


 |
市場調查報告書
商品編碼
2044292
亞太地區工程研發服務:市佔率分析、產業趨勢與統計、成長預測(2026-2031)Asia-Pacific Engineering Research And Development Services - Market Share Analysis, Industry Trends & Statistics, Growth Forecasts (2026 - 2031) |
||||||

※ 本網頁內容可能與最新版本有所差異。詳細情況請與我們聯繫。
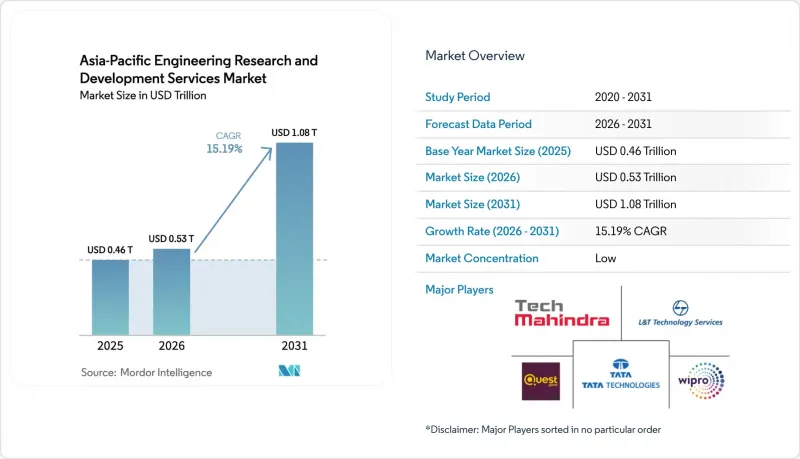
亞太地區工程研發服務市場預計將從 2025 年的 4,629.6 億美元成長到 2026 年的 5,332.8 億美元,然後到 2031 年達到 10815.1 億美元,2026 年至 2031 年的複合年成長率為 15.19%。
與西方同行相比,該地區擁有50-70%的成本優勢;政府主導的人工智慧政策旨在將推理工程留在國內;政府資助的5G/6G測試平台也為該地區吸引核心產品研發週期做出了貢獻。儘管印度仍然是最大的收入中心,但中國和日本正透過國內創新和5G後時代計畫實現供應商多元化。工程服務供應商和全球能力中心正在加劇對人工智慧人才的競爭,促使雙方都向二線城市的微型中心靠攏,以降低離職率和房地產成本。 2025年後的出口管制力道加大,正推動企業向內部工程模式和混合交付架構進行結構性轉變。
亞太地區工程研發服務市場的趨勢與洞察。
向數位化優先的產品生命週期轉型
數位雙胞胎、基於模型的系統工程和模擬主導的檢驗正在大幅減少實體原型所需的迭代次數,工作負載也正轉移到擁有雲端原生產品生命週期管理堆疊的亞太地區中心。日本的「2025年綜合創新策略」撥款超過2000億美元用於高效能運算驅動的設計。採用生成式人工智慧工具的公司報告稱,產品上市時間縮短了25%,但同時也面臨技能短缺的問題。在印度,只有五分之一的自稱人工智慧專家的人在生產環境中部署模型。因此,ISO 15288和IEC 62443認證對於必須證明其能夠安全應對數位工程威脅的區域供應商變得至關重要。
亞太地區外包的成本差異
越南的工程人事費用約為美國的30%,西歐的50%,而外包到海外的專案毛利率超過40%。結合新加坡和越南的交付體系利用越南高效的STEM(科學、技術、工程和數學)工作許可製度,在新加坡進行以客戶為中心的架構設計,在胡志明市進行大規模實施工作。然而,印度主要城市的房地產價格和工資上漲正促使企業轉移到哥印拜陀和維沙卡帕特南等第二中心。這些地區的營運成本低20-30%,地方政府也在共同投資興建「即插即用」的園區。
工程人才持續流失
半導體和嵌入式設計職位的年離職率高達25%至30%,這不僅降低了生產力,也迫使企業支付高額招募獎金。安永會計師事務所2024年的調查發現,只有43%的工程師對所在機構有歸屬感,凸顯了人才流失的風險。印度主要城市超過15%的薪資漲幅正在縮小與東歐的成本差距。服務供應商目前正將更大比例的營運預算用於技能提升培訓和員工福利計劃,這雖然會給短期利潤率帶來壓力,但對於維持亞太工程研發服務市場的交付速度至關重要。
細分市場分析
2025年,外包服務在亞太地區工程研發服務市場中佔據68.21%的佔有率。然而,在出口管制日益嚴格的背景下,專屬式中心預計將維持15.53%的成長率。像賽諾菲這樣的跨國公司計劃在2026年將其位於海得拉巴的員工人數擴充至4500人,從而將先前分散在三大洲的臨床和監管工作流程集中化。這項轉變將使臨床實驗試驗提交週期縮短近五分之一。此外,專屬式中心將與印度的GENESIS獎勵相輔相成,同時將高度敏感的程式碼保留在公司內部防火牆內,從而減少與第三方許可的摩擦。
短期來看,可變成本的柔軟性使得外包在平台轉型(例如從內燃機到電動車的動力傳動系統重新設計)中仍然效用。在這種情況下,供應商可以在12週內推出多學科團隊。然而,中國和印尼的資料在地化要求正逐步促使企業採用混合模式,也就是由內部團隊處理受保護的演算法,而將檢驗工作外包。柔佛和檳城的免稅工業園區透過將企業所得稅降至5%,並將知識工作者的個人所得稅降至15%,提高了企業自有設施的吸引力。
截至2025年,工程服務供應商在亞太地區工程研發服務市場中佔據54.12%的佔有率,而全球能力中心(GCC)正以15.59%的複合年成長率快速成長。印度擁有超過1700家全球能力中心(GCC),2024年創造了646億美元的收入。隨著企業尋求符合ISO 13485和AS9100標準,到2030年,這一數字可能超過1,050億美元。此外,全球能力中心內部的智慧財產權管理體係有助於企業遵守新的出口管制法規。
儘管存在這些波動,大規模工程服務提供者 (ESP) 憑藉其規模經濟優勢,仍然是重大交易的核心。 L&T 技術服務公司展現了其作為服務提供者的敏捷性,在 2025 年成功拿下價值 1 億美元的半導體專案。私募股權投資興趣依然濃厚,高瓴資本在 2026 年對 Quest World 投資 45 億美元就印證了這一點。然而,無論是大型企業 (GCC) 還是大型工程服務提供者(股權)都面臨著激烈的人才競爭,這推高了曾經用於降低成本的區域性城市的薪資溢價。
其他好處:
- Excel格式的市場預測(ME)表
- 3個月的分析師支持
目錄
第1章:引言
- 研究假設和市場定義
- 調查範圍
第2章:調查方法
第3章執行摘要
第4章 市場狀況
- 市場概覽
- 市場促進因素
- 向數位化優先的產品生命週期轉型
- 亞太地區外包的成本差異
- 加速電動車和自動駕駛平台項目
- 政府資助的 5G/6G 測試平台
- 二線城市的微型樞紐和稅收優惠園區
- 利用世代人工智慧進行製造設計
- 市場限制因素
- 工程人才持續流失
- 智慧財產權保護與出口管制合規成本
- 企劃為基礎的計費方式面臨越來越大的壓力。
- 限制程式碼傳輸的資料本地化方法
- 產業價值鏈分析
- 監理情勢和政策趨勢
- 技術展望、數位工程與工業4.0
- 波特五力分析
- 新進入者的威脅
- 買方的議價能力
- 供應商的議價能力
- 替代品的威脅
- 競爭公司之間的競爭
- 宏觀經濟因素對市場的影響
- 關鍵基本指標分析
- 目前可用的工程師人才庫
- 人力資源技能提升舉措(政府和產業)
第5章 市場規模與成長預測
- 依採購模式
- 內部/專屬工程
- 外包工程服務
- 按服務供應商類型
- 世界容量中心(GCC)
- 工程服務供應商(ESP)
- 按行業
- 車
- 產業
- 航太/國防
- 家用電子電器
- 半導體
- BFSI
- 零售
- 衛生保健
- 資訊科技和通訊
- 其他行業部門
- 按服務線分類的服務線
- 機械和電機工程
- 嵌入式工程
- 軟體工程
- 交付模式
- 陸上
- 離岸
- 近岸
- 混合
- 國家
- 中國
- 印度
- 日本
- 韓國
- 澳洲
- 新加坡
- 馬來西亞
- 印尼
- 亞太其他地區
第6章 競爭情勢
- 市場集中度
- 策略趨勢
- 市佔率分析
- 公司簡介
- L&T Technology Services Limited
- Tata Technologies Limited
- QuEST Global Services Pte. Ltd.
- Wipro Limited
- Tech Mahindra Limited
- Infosys Limited
- Cyient Limited
- HCL Technologies Limited
- KPIT Technologies Limited
- GlobalLogic Inc.
- Persistent Systems Limited
- Tata Elxsi Limited
- Harman International Industries, Incorporated
- Capgemini SE(Capgemini Engineering)
- Accenture plc
- DXC Technology Company
- Alten SA
- SII Group SA
- AKKA Technologies SE
- NTT DATA Corporation
- Pactera Technology International Ltd.
- Industrial Technology Research Institute(ITRI)
第7章 市場機會與未來展望
The Asia-Pacific engineering research and development services market size is expected to grow from USD 462.96 billion in 2025 to USD 533.28 billion in 2026 and is forecast to reach USD 1,081.51 billion by 2031 at 15.19% CAGR over 2026-2031.
Cost advantages of 50-70% versus Western peers, sovereign-AI mandates that keep inference engineering onshore, and government-funded 5G-6G test beds combine to pull core product-development cycles into the region. India remains the single largest revenue hub, while China and Japan diversify the vendor base with indigenous-innovation and Beyond-5G programs. Engineering service providers and global capability centers intensify competition for AI-ready talent, nudging both groups toward tier-2 city micro-hubs that lower attrition and real-estate costs. Heightened export-control scrutiny since 2025 is reinforcing a structural pivot toward in-house engineering models and hybrid delivery architectures.
Asia-Pacific Engineering Research And Development Services Market Trends and Insights
Shift to Digital-First Product Life-Cycles
Digital twins, model-based systems engineering, and simulation-driven validation have slashed the number of physical-prototype loops and redirected workload to Asia-Pacific centers equipped with cloud-native product lifecycle management stacks. Japan's 2025 Integrated Innovation Strategy earmarks more than USD 200 billion for HPC-enabled design. Firms adopting generative AI tooling report 25% shorter time-to-market but face skill shortages; only 1 in 5 self-identified AI professionals in India deploys models in production . ISO 15288 and IEC 62443 certifications are, therefore, becoming table stakes for regional vendors that must demonstrate the secure handling of digital engineering threads.
Outsourcing-Friendly Cost Differentials in Asia-Pacific
Engineering wages in Vietnam equal roughly 30% of U.S. rates and 50% of Western European levels, preserving gross margins above 40% for projects shifted offshore. Singapore-Vietnam delivery splits combine client-facing architecture in Singapore with volume execution in Ho Chi Minh City, leveraging Vietnam's streamlined STEM work-permit regime. However, rising real estate and salary inflation in tier-1 Indian cities is fueling a drift toward second-tier hubs such as Coimbatore and Visakhapatnam, where operating expenses are 20-30% lower and local governments co-invest in plug-and-play campuses.
Persistent Engineering-Talent Attrition
Annual churn of 25-30% in semiconductor and embedded design roles erodes productivity and forces premium hiring bonuses. A 2024 EY survey showed that only 43% of engineers felt organizational belonging, signaling retention risk. Compensation inflation above 15% in tier-1 Indian cities narrows the cost gap versus Eastern Europe. Providers now allocate a growing share of operating budgets to reskilling academies and wellness initiatives, which depress short-term margins yet remain essential for sustaining delivery velocity in the Asia-Pacific engineering research and development services market.
Other drivers and restraints analyzed in the detailed report include:
- Accelerated Electric Vehicle and Autonomous Platform Programs
- Government-Funded 5G-6G Test-Beds
- IP-Protection and Export-Control Compliance Costs
For complete list of drivers and restraints, kindly check the Table Of Contents.
Segment Analysis
Outsourced services controlled 68.21% of Asia-Pacific engineering research and development services market share in 2025. Captive centers, however, are projected to clock a 15.53% growth pace as export rules tighten. Multinationals like Sanofi expanded Hyderabad headcount to 4,500 in 2026, centralizing clinical and regulatory workflows once spread across three continents. That shift cuts investigational new drug filing cycles by nearly one-fifth. Captives also dovetail with India's GENESIS incentives, while allowing sensitive code to remain behind corporate firewalls, limiting third-party licensing friction.
Near-term, variable-cost flexibility keeps outsourcing relevant for platform migrations such as ICE-to-EV powertrain redesigns where providers spin up multidisciplinary squads inside 12 weeks. Yet data-localization in China and Indonesia is nudging hybrid models that reserve protected algorithms for in-house teams and farm out validation. Tax-holiday parks in Johor and Penang amplify the appeal of owned facilities by dropping corporate levies to 5% and personal taxes to 15% for knowledge staff.
Engineering service providers held 54.12% of Asia-Pacific engineering research and development services market size in 2025, but global capability centers are accelerating faster at a 15.59% CAGR. India hosts more than 1,700 GCCs generating USD 64.6 billion in fiscal 2024, and that figure could surpass USD 105 billion by 2030 as firms chase ISO 13485 and AS9100 compliance. GCC internal control of intellectual property also eases navigation of new export-control layers.
Despite the swing, scale advantages keep large ESPs center-stage for mega deals. L&T Technology Services landed a USD 100 million semiconductor program in 2025, evidencing provider agility. Private-equity interest remains strong, as a USD 4.5 billion Hillhouse stake in Quest Global showed in 2026. Still, both GCCs and ESPs confront a ferocious talent war that inflates wage premiums in second-tier cities once tapped for cost savings.
The Asia-Pacific Engineering Research and Development Services Market is Segmented by Sourcing Model (In-house/Captive Engineering, and More), Service Provider Type (Global Capability Centres, and More), Industry Vertical (Automotive, and More), Service Line (Mechanical and Electrical Engineering, and More), Delivery Model (Onshore, and More), and Country. The Market Forecasts are Provided in Terms of Value (USD).
List of Companies Covered in this Report:
- L&T Technology Services Limited
- Tata Technologies Limited
- QuEST Global Services Pte. Ltd.
- Wipro Limited
- Tech Mahindra Limited
- Infosys Limited
- Cyient Limited
- HCL Technologies Limited
- KPIT Technologies Limited
- GlobalLogic Inc.
- Persistent Systems Limited
- Tata Elxsi Limited
- Harman International Industries, Incorporated
- Capgemini SE (Capgemini Engineering)
- Accenture plc
- DXC Technology Company
- Alten S.A.
- SII Group SA
- AKKA Technologies SE
- NTT DATA Corporation
- Pactera Technology International Ltd.
- Industrial Technology Research Institute (ITRI)
Additional Benefits:
- The market estimate (ME) sheet in Excel format
- 3 months of analyst support
TABLE OF CONTENTS
1 INTRODUCTION
- 1.1 Study Assumptions and Market Definition
- 1.2 Scope of the Study
2 RESEARCH METHODOLOGY
3 EXECUTIVE SUMMARY
4 MARKET LANDSCAPE
- 4.1 Market Overview
- 4.2 Market Drivers
- 4.2.1 Shift to Digital-First Product Life-Cycles
- 4.2.2 Outsourcing-Friendly Cost Differentials in Asia-Pacific
- 4.2.3 Accelerated Electric Vehicle and Autonomous Platform Programs
- 4.2.4 Government-Funded 5G/6G Test-Beds
- 4.2.5 Tier-2 City Micro-Hubs and Tax-Holiday Parks
- 4.2.6 Generative-AI-Assisted Design-for-Manufacture
- 4.3 Market Restraints
- 4.3.1 Persistent Engineering-Talent Attrition
- 4.3.2 IP-Protection and Export-Control Compliance Costs
- 4.3.3 Rising Project-Based Billing Price Pressure
- 4.3.4 Data-Localization Laws Limiting Code-Transfer
- 4.4 Industry Value Chain Analysis
- 4.5 Regulatory Landscape and Policy Developments
- 4.6 Technological Outlook, Digital Engineering and Industry 4.0
- 4.7 Porter's Five Forces Analysis
- 4.7.1 Threat of New Entrants
- 4.7.2 Bargaining Power of Buyers
- 4.7.3 Bargaining Power of Suppliers
- 4.7.4 Threat of Substitutes
- 4.7.5 Intensity of Competitive Rivalry
- 4.8 Impact of Macroeconomic Factors on the Market
- 4.9 Key Base-Indicator Analysis
- 4.9.1 Current Available Talent Pool of Engineers
- 4.9.2 Talent Upskill Initiatives (Govt and Industry)
5 MARKET SIZE AND GROWTH FORECASTS (VALUE)
- 5.1 By Sourcing Model
- 5.1.1 In-house/Captive Engineering
- 5.1.2 Outsourced Engineering Services
- 5.2 By Service Provider Type
- 5.2.1 Global Capability Centres (GCCs)
- 5.2.2 Engineering Service Providers (ESPs)
- 5.3 By Industry Vertical
- 5.3.1 Automotive
- 5.3.2 Industrial
- 5.3.3 Aerospace and Defence
- 5.3.4 Consumer Electronics
- 5.3.5 Semiconductor
- 5.3.6 BFSI
- 5.3.7 Retail
- 5.3.8 Healthcare
- 5.3.9 IT and Telecom
- 5.3.10 Rest of Industry Verticals
- 5.4 By Service Line
- 5.4.1 Mechanical and Electrical Engineering
- 5.4.2 Embedded Engineering
- 5.4.3 Software Engineering
- 5.5 By Delivery Model
- 5.5.1 Onshore
- 5.5.2 Offshore
- 5.5.3 Near-shore
- 5.5.4 Hybrid
- 5.6 By Country
- 5.6.1 China
- 5.6.2 India
- 5.6.3 Japan
- 5.6.4 South Korea
- 5.6.5 Australia
- 5.6.6 Singapore
- 5.6.7 Malaysia
- 5.6.8 Indonesia
- 5.6.9 Rest of Asia-Pacific
6 COMPETITIVE LANDSCAPE
- 6.1 Market Concentration
- 6.2 Strategic Moves
- 6.3 Market Share Analysis
- 6.4 Company Profiles (includes Global Level Overview, Market Level Overview, Core Segments, Financials as available, Strategic Information, Market Rank/Share, Products and Services, Recent Developments)
- 6.4.1 L&T Technology Services Limited
- 6.4.2 Tata Technologies Limited
- 6.4.3 QuEST Global Services Pte. Ltd.
- 6.4.4 Wipro Limited
- 6.4.5 Tech Mahindra Limited
- 6.4.6 Infosys Limited
- 6.4.7 Cyient Limited
- 6.4.8 HCL Technologies Limited
- 6.4.9 KPIT Technologies Limited
- 6.4.10 GlobalLogic Inc.
- 6.4.11 Persistent Systems Limited
- 6.4.12 Tata Elxsi Limited
- 6.4.13 Harman International Industries, Incorporated
- 6.4.14 Capgemini SE (Capgemini Engineering)
- 6.4.15 Accenture plc
- 6.4.16 DXC Technology Company
- 6.4.17 Alten S.A.
- 6.4.18 SII Group SA
- 6.4.19 AKKA Technologies SE
- 6.4.20 NTT DATA Corporation
- 6.4.21 Pactera Technology International Ltd.
- 6.4.22 Industrial Technology Research Institute (ITRI)
7 MARKET OPPORTUNITIES AND FUTURE OUTLOOK
- 7.1 White-Space and Unmet-Need Assessment

 美國工程服務:市場佔有率分析、產業趨勢與統計及成長預測(2026-2031 年)
 2026-2034年全球人工智慧(AI)工程市場規模、佔有率、趨勢和成長分析報告
 工程服務市場-2026-2032年全球市場預測
 2026-2036年全球引擎及引擎零件試驗鑽機市場
 法醫工程市場規模、佔有率和趨勢分析報告:按服務、最終用途、應用、地區和細分市場分類(2026-2033 年)工程實驗室即服務 (ELaaS) 市場:市場規模、佔有率和趨勢分析(按實驗室類型、訪問模式、最終用途和地區分類),細分市場預測(2026-2033 年)繪圖服務市場:全球市場按產品類型、價格範圍、應用和最終用戶分類的預測 - 2026-2032 年
 2026年全球人工智慧(AI)工程市場報告2026年全球工程服務市場報告2026年全球工程研發外包市場報告