


 |
市場調查報告書
商品編碼
2124743
冷藏拖車:市場佔有率分析、行業趨勢和統計數據、成長預測(2026-2031)Refrigerated Trailer - Market Share Analysis, Industry Trends & Statistics, Growth Forecasts (2026 - 2031) |
||||||

※ 本網頁內容可能與最新版本有所差異。詳細情況請與我們聯繫。
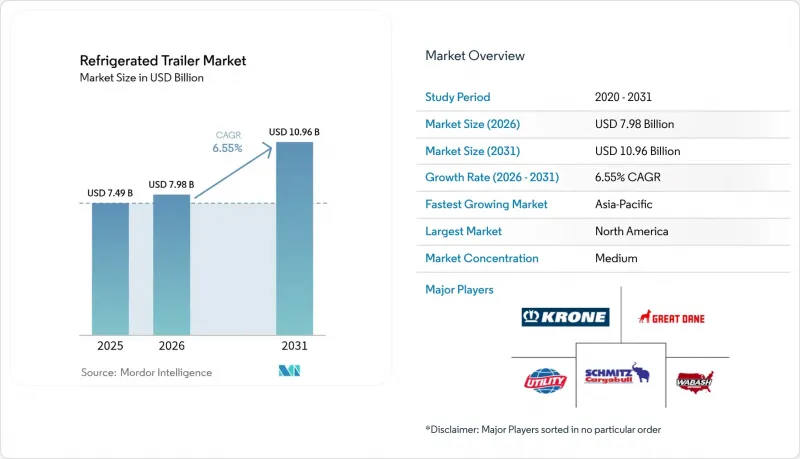
據 Mordor Intelligence 稱,2025 年冷藏拖車市值為 74.9 億美元,預計到 2031 年將達到 109.6 億美元,而 2026 年為 79.8 億美元,預測期(2026-2031 年)的複合年成長率為 6.55%。
本報告按產品類型(冷凍食品拖車和冷藏食品拖車)、拖車長度(28英尺以下、29-49英尺、49英尺以上)、製冷動力來源(柴油內燃機、柴油-電力混合動力等)、最終用戶(乳製品、水果和蔬菜、肉類和魚貝類、藥品等)以及地區進行細分。市場預測以價值(美元)和數量(輛)表示。
全球冷藏拖車市場趨勢及洞察
電子商務主導了對最後一公里冷鏈配送需求的成長。
線上生鮮配送服務正在重新思考配送頻率和拖車設計,敦促承運商採用更短、更靈活的車輛,以便應對多個溫度區域並能在人口密集的都市區道路上行駛。 Performance Food Group 已透過在加州部署 30 多輛純電動冷藏拖車來支援零排放履約中心,證明了電動系統的商業性可行性。這些長度達 28 英尺的拖車用途廣泛,推動了其業務成長。此外,像 Thermo King 的「TracKing」平台這樣的高精度遠端資訊處理技術,即使在走走停停的路線上,也能將貨物溫度控制在 ±0.9°F 以內。投資電動拖車的承運商還能利用市政噪音控制法規和柴油車無法實現的夜間配送時段。隨著城市地區逐步推行堵塞收費和零排放區,承運商將電動冷藏拖車視為應對未來通行限制的有效手段。因此,電子商務的成長與永續性政策的融合,鞏固了小型電池驅動車輛作為下一代冷鏈重要組成部分的地位。
更嚴格的食品安全法規要求記錄溫度並實現可追溯性。
美國《食品安全現代化法案》(FSMA) 204 的實施要求托運人記錄高風險食品在整個運輸過程中的溫度歷史。違規行為可能導致產品召回和民事處罰,其成本遠超過額外設備費用,因此推動了配備自動資料上傳功能的遠端資訊處理拖車的普及。 Great Dane 公司現已在其新型冷藏拖車上配備 FleetPulse 遠端資訊處理系統,提供即時警報以簡化審核合規流程。歐盟法規 (EC) 852/2004 也強制規定了類似的追溯要求,鼓勵承運商對現有拖車進行改造,加裝藍牙探頭和雲端控制面板。這項監管轉變使那些將硬體、軟體和合規報告整合到訂閱套餐中的供應商受益。從長遠來看,強制性溫度記錄很可能成為全球標準,從而提高所有冷藏拖車市場參與企業的標準。
與柴油動力儲能裝置相比,電動/混合動力儲能裝置的初始成本較高。
電池驅動的電動卡車(TRU)成本是柴油卡車的兩到三倍,這意味著對於沒有補貼的運輸公司而言,投資回收期超過五年。依賴商業貸款的小規模運輸公司面臨更高的利率,難以調整現金流。 Wabash National 透過其「拖車即服務」(Trailers-as-a-Service)訂閱服務來應對這項挑戰,該服務將硬體、維護和遠端資訊處理系統打包到月費中,將資本支出(Capex)轉化為營運支出(OpEx)。訓練技術人員安全維護高壓系統會產生間接成本,而當地電價也會影響總擁有成本(TCO)。在電池價格下降或獎勵加大之前,在燃油稅和排放氣體法規相對寬鬆的地區,柴油卡車可能仍將佔據主導地位。
細分市場分析
到2025年,冷藏拖車將佔冷藏拖車市場規模的54.62%,這主要得益於肉類、水產品和已調理食品的物流運輸,這些食品需要在零下溫度下保持品質。對於承運商而言,每車貨物的價值持續超過10萬美元,因此採用高隔熱性能和雙壓縮機系統是合理的。同時,預計到2031年,冷藏拖車市場將以8.33%的複合年成長率成長,因為線上食品雜貨和生物製藥對溫度穩定性的要求在36°F至46°F之間,這促使承運商投資於多區內襯和快速冷卻蒸發器。
隨著科技的融合,它們之間的界線正變得日益模糊。 Great Dane 的 Everest 平台配備了變速壓縮機和可移動隔板,使運輸公司能夠在冷藏和冷凍模式之間輕鬆切換。加州空氣資源委員會 (CARB) 的低全球暖化潛力 (GWP) 法規建議使用在寬溫度範圍內有效的冷媒,這鼓勵原始設備製造商 (OEM) 設計靈活的系統。隨著生鮮食品的前置作業時間縮短,運輸公司越來越需要能夠根據不同用途(例如,今天運輸草莓,明天運輸冰淇淋)切換用途且不會造成溫度洩漏的拖車。
到2025年,長度超過49英尺的拖車將佔總銷量的52.05%,這反映了州際公路運輸的規模經濟效應,因為這些地區的裝卸平台和交叉轉運站已根據53英尺級車輛的標準進行了標準化。此細分市場的永續發展主要得益於可預測的裝載效率和每噸英里運輸次數的減少。同時,長度不超過28英尺的拖車將以8.05%的複合年成長率實現最高成長,因為城市物流中針對大型車輛的堵塞法規將日益嚴格。
在都市區配送高峰時段,能夠靈活轉彎和路邊停靠的車輛更受歡迎。因此,小型冷藏車廂正在滿足芝加哥、巴黎和新加坡等城市線上雜貨和食材自煮包配送的需求。類似航空貨運「樞紐輻射式」模式的混合車隊,使用48英尺長的長途貨車將貨物運送到都市區配送中心,再由28英尺長的衛星車輛進行後續配送。汽車製造商也積極回應,提供可根據底盤長度客製化的模組化冷藏組件,方便車隊管理人員整合零件庫存。
區域分析
預計到2025年,北美將引領冷藏拖車市場,佔據39.15%的市場。這主要得益於北美強大的州際公路網路、倉庫自動化以及《食品安全現代化法案》(FSMA)強制要求數位化溫度記錄的規定。核心需求平均每年為4.4萬輛,儘管2024年由於底盤交付延遲導致需求暫時下降,但預計2025年訂單將訂單。為了滿足零售商的ESG(環境、社會和治理)評分標準,車隊營運商正在採用訂閱模式和電動冷藏拖車單元(TRU),遠端資訊處理技術的普及率已超過70%,從而實現了預測性維護和路線最佳化。
亞太地區是所有地區中成長最快的,複合年成長率達8.92%,這主要得益於JBS在越南投資1億美元建設肉類加工中心等投資項目,以及快速的都市化推動了人均冷鏈支出成長。本地組裝線降低了進口關稅,使符合標準的冷藏拖車對該地區車隊而言更加經濟實惠。中國和印度政府對農業冷庫的補貼間接刺激了對冷藏拖車的需求,而共享出行平台正在試點運營可共用貨運能力的冷藏車,這表明運輸方式融合的潛力巨大。
在歐洲,修訂後的氟化氣體法規促使高全球暖化潛勢(GWP)的R404A系統被二氧化碳和丙烷等天然冷媒逐步取代,尤其是在德國、法國和北歐國家。總擁有成本(TCO)估算表明,在陸地電力資源發達的高密度配送路線上,純電動拖車具有優勢。在拉丁美洲和非洲等新興市場,由開發銀行資助的基礎設施項目正在推進,但由於外匯波動,車輛投資成長放緩。
其他好處:
- Excel格式的市場預測(ME)表
- 3個月的分析師支持
目錄
第1章:引言
- 研究假設和市場定義
- 調查範圍
第2章:調查方法
第3章執行摘要
第4章 市場狀況
- 市場概覽
- 市場促進因素
- 電子商務的發展帶動了對最後一公里冷鏈配送的需求不斷成長。
- 更嚴格的食品安全法規要求記錄溫度並實現可追溯性。
- 向無柴油混合動力和全電動冷藏運輸單元過渡(Zetrus)
- 亞太地區和非洲新興經濟體冷鏈的快速發展
- 透過車隊數據分析實現預測性維護和提高運轉率。
- 受 ESG(環境、社會和治理)因素驅動的投資者壓力正在加速汽車的現代化。
- 市場限制因素
- 電動/混合動力儲能裝置與柴油儲能裝置的初始成本差異
- 長途運輸路線沿線缺乏充電和陸上電力基礎設施。
- 長期司機短缺限制了冷藏運輸能力。
- 氫氟碳化合物逐步淘汰方法的多樣性造成了技術上的不確定性。
- 價值供應鏈分析
- 監理情勢
- 技術展望
- 波特五力模型
第5章 市場規模與成長預測
- 依產品類型(溫度等級)
- 冷凍食品拖車
- 冷藏食品拖車
- 拖車長度/負載容量
- 28 英尺或更短(幼犬和城市)
- 29-49 英尺(標準)
- 49 英尺或更長(長途運輸/53 英尺)
- 透過冷凍電源
- 柴油內燃機單元
- 柴油-電力混合動力
- 純電動/電池驅動裝置
- 低溫和替代燃料裝置
- 最終用戶
- 乳製品
- 水果和蔬菜
- 肉類和水產品
- 製藥和生命科學
- 麵包糖果甜點
- 其他最終用戶
- 按地區
- 北美洲
- 美國
- 加拿大
- 其他北美國家
- 南美洲
- 巴西
- 阿根廷
- 其他南美國家
- 歐洲
- 德國
- 英國
- 法國
- 義大利
- 西班牙
- 俄羅斯
- 其他歐洲國家
- 亞太地區
- 中國
- 印度
- 日本
- 韓國
- 澳洲和紐西蘭
- 其他亞太國家
- 中東和非洲
- 阿拉伯聯合大公國
- 沙烏地阿拉伯
- 土耳其
- 埃及
- 南非
- 其他中東和非洲國家
- 北美洲
第6章 競爭情勢
- 市場集中度
- 策略趨勢
- 市佔率分析
- 公司簡介
- Wabash National Corporation
- Great Dane LLC
- Utility Trailer Manufacturing Company
- Schmitz Cargobull AG
- Kogel Trailer GmbH
- Lamberet SAS
- Fahrzeugwerk Bernard Krone GmbH
- Montracon Ltd
- Randon Implementos
- Gray & Adams Ltd
- Hyundai Translead
- CIMC Vehicles Group
- Chereau(The Reefer Group)
- Polar King International Inc.
- Wernicke Trailer
- Stoughton Trailers LLC
- Vanguard National Trailer Corp.
- THT New Cool(Heering)
- SOR Iberica
- MHI Thermal Transport
第7章 市場機會與未來展望
According to Mordor Intelligence, the refrigerated trailer market size was valued at USD 7.49 billion in 2025 and estimated to grow from USD 7.98 billion in 2026 to reach USD 10.96 billion by 2031, at a CAGR of 6.55% during the forecast period (2026-2031).
This report is Segmented by Product Type (Frozen Food Trailers and Chilled Food Trailers), Trailer Length (up To 28 Ft, 29-49 Ft, and Above 49 Ft), Refrigeration Power Source (Diesel ICE, Diesel-Electric Hybrids, and More), End User (Dairy, Fruits and Vegetables, Meat and Seafood, Pharmaceuticals, and More), and Geography. The Market Forecasts are Provided in Terms of Value (USD) and Volume (Units).
Global Refrigerated Trailer Market Trends and Insights
Growing Demand for E-Commerce-Driven Last-Mile Cold-Chain Deliveries
Online grocery services reshape delivery frequency and trailer design, prompting fleets to deploy shorter, agile units that navigate dense urban corridors with multi-temperature zones. Performance Food Group deployed more than 30 battery-electric refrigerated trailers in California to support zero-emission fulfillment centers, underscoring the commercial viability of electric systems . The versatility of up-to-28-foot units underpins their growth, while precise telematics such as Thermo King's TracKing platform maintain cargo integrity within +-0.9 °F during stop-and-go routes. Fleets investing in electric trailers also capitalize on municipal noise-reduction rules and overnight delivery windows unattainable for diesel units. As cities roll out congestion pricing and zero-emission zones, operators see electric refrigerated trailers as a hedge against future access restrictions. Therefore, the convergence of e-commerce growth and sustainability policies cements compact, battery-powered equipment as an essential node in next-generation cold chains.
Stricter Food-Safety Regulations Mandating Temperature Logging and Traceability
Implementing FSMA 204 in the United States forces shippers to document end-to-end temperature histories for high-risk foods. Non-compliance can trigger recalls and civil penalties that outweigh incremental equipment costs, driving adoption of telematics-enabled trailers capable of automatic data uploads. Great Dane now fits FleetPulse telematics as standard on new refrigerated models, offering real-time alerts that simplify audit readiness . Regulation (EC) 852/2004 in the EU underpins similar traceability requirements, encouraging fleets to retrofit legacy trailers with Bluetooth probes and cloud dashboards. The regulatory push benefits suppliers that bundle hardware, software, and compliance reporting into subscription packages. Over the long term, temperature-logging mandates will likely harmonize globally, creating a rising baseline specification for every refrigerated trailer market participant.
High Upfront Cost Premium of Electric / Hybrid TRUs Versus Diesel
Battery-electric TRUs can cost two to three times more than diesel units, stretching payback horizons beyond five years for fleets lacking subsidy access. Smaller carriers reliant on commercial loans face higher interest rates, making cash-flow alignment difficult. Wabash National counters the hurdle via Trailers-as-a-Service subscriptions that bundle hardware, maintenance, and telematics into monthly payments, shifting capex to opex . Training technicians to safely maintain high-voltage systems adds indirect costs, while regional electricity prices influence the total cost of ownership. Until battery prices fall or incentives broaden, diesel will persist where fuel taxation and emission penalties remain modest.
Other drivers and restraints analyzed in the detailed report include:
- Shift Toward Diesel-Free Hybrid and Fully Electric Transport Refrigeration Units
- Fleet Data Analytics Enabling Predictive Maintenance and Uptime Gains
- Limited Charging and Shore-Power Infrastructure Along Long-Haul Corridors
For complete list of drivers and restraints, kindly check the Table Of Contents.
Segment Analysis
Frozen trailers controlled 54.62% of the refrigerated trailer market size in 2025 thanks to meat, seafood, and ready-meal logistics that demand sub-zero integrity. Operators justify higher insulation and dual-compressor systems because cargo values routinely exceed USD 100,000 per load. Conversely, chilled trailers are forecast to post an 8.33% CAGR through 2031 as online grocery and pharmaceutical biologics require 36 °F to 46 °F stability, prompting fleets to invest in multi-zone liners and rapid-cool evaporators.
Technological convergence blurs boundaries: Great Dane's Everest platform allows operators to toggle between frozen and chilled modes via variable-speed compressors and movable bulkheads. CARB's low-GWP mandates favor refrigerants effective across a broad temperature envelope, nudging OEMs to design flexible systems. As fresh-produce lead times tighten, carriers increasingly seek trailers that pivot between strawberries today and ice cream tomorrow without risking thermal leakage
Trailers exceeding 49 feet held 52.05% of 2025 revenue, reflecting economies of scale on interstate lanes where dock doors and cross-docks standardize around 53-foot assets. The segment's endurance owes much to predictable cube utilization and reduced trips per ton-mile. Meanwhile, trailers up to 28 feet log the fastest 8.05% CAGR as city logistics mount congestion rules that penalize oversized rigs.
Municipal delivery windows prefer vehicles capable of tight-radius turns and curbside docking; smaller refrigerated bodies therefore capture e-grocery and meal-kit traffic in Chicago, Paris, and Singapore. Hybrid fleets mix 48-foot linehaul units feeding urban depots served by 28-foot satellites, echoing hub-and-spoke air-cargo logic. OEMs answer with modular refrigeration packages adaptable across chassis lengths, allowing fleet managers to consolidate parts inventories.
Complete Report Scope:
- By Product Type (Temperature Class)
- Frozen Food Trailers
- Chilled Food Trailers
- By Trailer Length / Capacity
- Up to 28 ft (Pup and City)
- 29 - 49 ft (Standard)
- Above 49 ft (Long-haul / 53 ft)
- By Refrigeration Power Source
- Diesel ICE Units
- Diesel-Electric Hybrids
- Full-Electric / Battery-Powered Units
- Cryogenic and Alt-Fuel Units
- By End User
- Dairy Products
- Fruits and Vegetables
- Meat and Seafood
- Pharmaceuticals and Life Sciences
- Bakery and Confectionery
- Other End Users
- By Geography
- North America
- United States
- Canada
- Rest of North America
- South America
- Brazil
- Argentina
- Rest of South America
- Europe
- Germany
- United Kingdom
- France
- Italy
- Spain
- Russia
- Rest of Europe
- Asia-Pacific
- China
- India
- Japan
- South Korea
- Australia & New Zealand
- Rest of Asia-Pacific
- Middle-East and Africa
- United Arab Emirates
- Saudi Arabia
- Turkey
- Egypt
- South Africa
- Rest of Middle-East and Africa
- North America
Geography Analysis
North America leads the refrigerated trailer market with a 39.15% revenue share in 2025, anchored by robust interstate highways, warehouse automation, and FSMA rules that obligate digital temperature logs. Core demand averages 44,000 units per year, with 2025 orders rebounding after a brief 2024 dip caused by chassis delays. Fleets adopt subscription models and electric TRUs to satisfy retailer ESG scorecards, while telematics penetration surpasses 70%, enabling predictive maintenance and route optimization.
Asia-Pacific records the fastest regional growth at a 8.92% CAGR, propelled by investments such as JBS's USD 100 million Vietnamese meat hub and rapid urbanization that elevates per-capita cold-chain spending. Local assembly lines reduce import duties, making compliant trailers more affordable for regional fleets. Government subsidies in China and India for agricultural cold storage indirectly stimulate trailer demand, and ride-hailing platforms experiment with shared-capacity cold vans, signaling potential modal convergence.
Europe maintains steady expansion as the revised F-Gas Regulation spurs replacement of high-GWP R404A systems with natural refrigerants like CO2 and propane, especially in Germany, France, and the Nordics. Total cost-of-ownership calculations favor fully electric trailers on dense distribution routes with ample shore power. Emerging markets in Latin America and Africa follow with infrastructure projects funded by development banks, though currency volatility tempers fleet investment pacing.
- Wabash National Corporation
- Great Dane LLC
- Utility Trailer Manufacturing Company
- Schmitz Cargobull AG
- Kogel Trailer GmbH
- Lamberet SAS
- Fahrzeugwerk Bernard Krone GmbH
- Montracon Ltd
- Randon Implementos
- Gray & Adams Ltd
- Hyundai Translead
- CIMC Vehicles Group
- Chereau (The Reefer Group)
- Polar King International Inc.
- Wernicke Trailer
- Stoughton Trailers LLC
- Vanguard National Trailer Corp.
- THT New Cool (Heering)
- SOR Iberica
- MHI Thermal Transport
Additional Benefits:
- The market estimate (ME) sheet in Excel format
- 3 months of analyst support
TABLE OF CONTENTS
1 Introduction
- 1.1 Study Assumptions & Market Definition
- 1.2 Scope of the Study
2 Research Methodology
3 Executive Summary
4 Market Landscape
- 4.1 Market Overview
- 4.2 Market Drivers
- 4.2.1 Growing Demand for E-Commerce-Driven Last-Mile Cold Chain Deliveries
- 4.2.2 Stricter Food-Safety Regulations Mandating Temperature Logging and Traceability
- 4.2.3 Shift Toward Diesel-Free Hybrid and Fully Electric Transport Refrigeration Units (Zetrus)
- 4.2.4 Rapid Cold-Chain Build-Out in Emerging Asia-Pacific and African Economies
- 4.2.5 Fleet Data Analytics Enabling Predictive Maintenance and Uptime Gains
- 4.2.6 ESG-Driven Investor Pressure Accelerating Fleet Modernization
- 4.3 Market Restraints
- 4.3.1 High Upfront Cost Premium of Electric / Hybrid TRUs Vs. Diesel
- 4.3.2 Limited Charging and Shore-Power Infrastructure Along Long-Haul Corridors
- 4.3.3 Chronic Driver Shortage Constraining Refrigerated Capacity
- 4.3.4 Volatile HFC Phase-Down Legislation Creating Technology Uncertainty
- 4.4 Value / Supply-Chain Analysis
- 4.5 Regulatory Landscape
- 4.6 Technological Outlook
- 4.7 Porter's Five Forces
- 4.7.1 Threat of New Entrants
- 4.7.2 Bargaining Power of Buyers
- 4.7.3 Bargaining Power of Suppliers
- 4.7.4 Threat of Substitutes
- 4.7.5 Intensity of Competitive Rivalry
5 Market Size & Growth Forecasts (Value (USD) and Volume (Units))
- 5.1 By Product Type (Temperature Class)
- 5.1.1 Frozen Food Trailers
- 5.1.2 Chilled Food Trailers
- 5.2 By Trailer Length / Capacity
- 5.2.1 Up to 28 ft (Pup and City)
- 5.2.2 29 - 49 ft (Standard)
- 5.2.3 Above 49 ft (Long-haul / 53 ft)
- 5.3 By Refrigeration Power Source
- 5.3.1 Diesel ICE Units
- 5.3.2 Diesel-Electric Hybrids
- 5.3.3 Full-Electric / Battery-Powered Units
- 5.3.4 Cryogenic and Alt-Fuel Units
- 5.4 By End User
- 5.4.1 Dairy Products
- 5.4.2 Fruits and Vegetables
- 5.4.3 Meat and Seafood
- 5.4.4 Pharmaceuticals and Life Sciences
- 5.4.5 Bakery and Confectionery
- 5.4.6 Other End Users
- 5.5 By Geography
- 5.5.1 North America
- 5.5.1.1 United States
- 5.5.1.2 Canada
- 5.5.1.3 Rest of North America
- 5.5.2 South America
- 5.5.2.1 Brazil
- 5.5.2.2 Argentina
- 5.5.2.3 Rest of South America
- 5.5.3 Europe
- 5.5.3.1 Germany
- 5.5.3.2 United Kingdom
- 5.5.3.3 France
- 5.5.3.4 Italy
- 5.5.3.5 Spain
- 5.5.3.6 Russia
- 5.5.3.7 Rest of Europe
- 5.5.4 Asia-Pacific
- 5.5.4.1 China
- 5.5.4.2 India
- 5.5.4.3 Japan
- 5.5.4.4 South Korea
- 5.5.4.5 Australia & New Zealand
- 5.5.4.6 Rest of Asia-Pacific
- 5.5.5 Middle-East and Africa
- 5.5.5.1 United Arab Emirates
- 5.5.5.2 Saudi Arabia
- 5.5.5.3 Turkey
- 5.5.5.4 Egypt
- 5.5.5.5 South Africa
- 5.5.5.6 Rest of Middle-East and Africa
- 5.5.1 North America
6 Competitive Landscape
- 6.1 Market Concentration
- 6.2 Strategic Moves
- 6.3 Market Share Analysis
- 6.4 Company Profiles (Includes Global level Overview, Market level overview, Core Segments, Financials as available, Strategic Information, Market Rank/Share for key companies, Products & Services, and Recent Developments)
- 6.4.1 Wabash National Corporation
- 6.4.2 Great Dane LLC
- 6.4.3 Utility Trailer Manufacturing Company
- 6.4.4 Schmitz Cargobull AG
- 6.4.5 Kogel Trailer GmbH
- 6.4.6 Lamberet SAS
- 6.4.7 Fahrzeugwerk Bernard Krone GmbH
- 6.4.8 Montracon Ltd
- 6.4.9 Randon Implementos
- 6.4.10 Gray & Adams Ltd
- 6.4.11 Hyundai Translead
- 6.4.12 CIMC Vehicles Group
- 6.4.13 Chereau (The Reefer Group)
- 6.4.14 Polar King International Inc.
- 6.4.15 Wernicke Trailer
- 6.4.16 Stoughton Trailers LLC
- 6.4.17 Vanguard National Trailer Corp.
- 6.4.18 THT New Cool (Heering)
- 6.4.19 SOR Iberica
- 6.4.20 MHI Thermal Transport
7 Market Opportunities & Future Outlook

 冷藏拖車市場 - 全球預測,2026-2032年冷藏車市場:2026-2032年全球市場預測(依車輛類型、動力來源、溫度、隔熱材料及應用分類)
 冷藏拖車市場:依產品類型、最終用途產業和地區分類-市場規模、佔有率、前景和機會分析,2025-2032年
 2026年全球冷藏拖車市場報告2026年全球冷藏貨物運輸市場報告
 美國冷藏運輸:市場佔有率分析、行業趨勢和統計數據、成長預測(2026-2031 年)
 冷藏車市場 - 全球產業規模、佔有率、趨勢、機會及預測(按車輛類型、有效載荷、應用、地區和競爭格局分類,2021-2031年)
 日本冷藏車市場規模、佔有率、趨勢及預測(按類型、噸位、應用及地區分類),2026-2034年
 冷藏拖車市場規模、佔有率和成長分析(按拖車類型、軸型、動力來源、最終用途產業和地區分類)-2026-2033年產業預測
 全球冷藏拖車市場