


 |
市場調查報告書
商品編碼
2124714
虛擬活動:市場佔有率分析、產業趨勢與統計、成長預測(2026-2031)Virtual Events - Market Share Analysis, Industry Trends & Statistics, Growth Forecasts (2026 - 2031) |
||||||

※ 本網頁內容可能與最新版本有所差異。詳細情況請與我們聯繫。
根據 Mordor Intelligence 預測,虛擬活動市場規模預計將在 2026 年達到 166.1 億美元,到 2031 年達到 276.5 億美元,在預測期內以 10.72% 的複合年成長率成長。
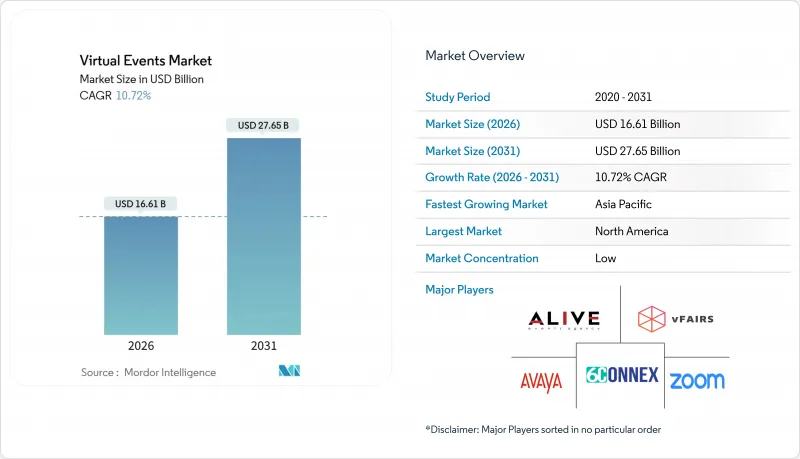
本報告按平台(網路平台、XR平台等)、服務類型(通訊服務、招募和人脈拓展等)、應用程式(會議和高峰會等)、活動類型(網路研討會等)、最終用戶產業(教育機構等)、收入來源(贊助等)和地區進行細分。市場預測以美元計價。
全球虛擬活動市場趨勢及洞察
整合通訊即服務 (UCaaS) 和基於雲端的協作平台的快速普及。
遷移到整合通訊即服務 (UCaaS) 套餐的企業越來越期望將活動交付功能作為標準配置,與語音、聊天和白板工具並列,從而減少了網路研討會的單獨許可費用,並縮短了評估週期。 Microsoft Teams、Zoom Workplace 和 Cisco Webex 的月有效用戶數均實現了三位數成長,這些用戶無需額外採購即可舉辦內部全體員工大會,而競爭優勢正轉向 API 的豐富性和與第三方工具的整合。雲端原生部署消除了伺服器容量瓶頸,使活動管理員能夠在數小時內擴展註冊入口網站。因此,邊際成本的降低正在加速頻繁的內部簡報和外部產品發布,數位化形式在更廣泛的業務活動中變得越來越普遍。這些趨勢正在擴大虛擬活動市場的潛在基本客群。
遠距和混合辦公模式的全球擴張
公部門勞動力數據顯示,遠程辦公已成為美國約四分之一員工的常態,跨洲調查也顯示,歐洲和亞太地區也出現了類似的趨勢。隨著員工分散辦公,時區差異日益加劇,碳排放報告責任範圍不斷擴大,基於瀏覽器的線上會議已成為季度啟動會和合作夥伴簡報的首選方案。主辦單位現在圍繞著非同步播放、模組化議程和點播庫來設計議程,顛覆了疫情前假定參與者同時線上做法。隨著企業將彈性的工作安排融入人才策略,虛擬活動市場的需求也持續成長。
大型線上活動中的資料安全和隱私問題
監管機構正加強對參與者資料的審查,強制要求對靜態資料進行加密、實施基於角色的存取控制,並建立詳細的稽核日誌。醫療保健、金融服務和政府機構在批准與平台簽訂合約前,要求其獲得 ISO 27001 或 SOC 2 認證,這延長了銷售週期。在延展實境 (XR) 環境中,透過眼動追蹤、空間運動和生物識別資訊洩露個人屬性的可能性,進一步增加了保密性,並催生了新的合規性查核點。小規模的組織由於無力負擔專職隱私負責人的費用,往往會延後虛擬部署,導致虛擬活動市場短期內出現萎縮。
細分市場分析
到2025年,基於Web的解決方案將佔據虛擬活動市場48.43%的佔有率,這表明HTML5和WebRTC即使在企業防火牆內也能實現無縫登入體驗。企業優先考慮免安裝存取、自動擴展和便捷的合規性審計。瀏覽器的普及性降低了進入門檻,便於頻繁的內部更新和外部網路研討會,從而擴大了整個虛擬活動市場。同時,在多廠商頭戴式設備標準的推動下,身臨其境型XR場館預計到2031年將以11.64%的複合年成長率成長,這些標準降低了整合門檻。空間沉浸帶來的增強體驗已在汽車設計演示、手術模擬和豪華房地產參觀等應用中得到驗證。雖然頭戴式設備的價格和用戶舒適度仍然是挑戰,但製造業、醫療保健和教育行業的早期採用者正在為更廣泛的應用鋪平道路。
瀏覽器與XR平台之間的互動是共生的。基於瀏覽器的虛擬大廳正日益引導高價值的會議用戶進入可選的頭戴式設備環境,從而兼顧了易用性和沈浸感。雲端協作使主辦單位能夠並行運行2D和3D串流,使他們能夠在探索高階互動性的同時,保持受眾覆蓋範圍。隨著對逼真虛擬化身、手勢姿態辨識和空間音訊等技術的創投激增,虛擬活動市場正在拓展其選擇範圍,而XR不再被視為非此即彼的選擇,而是作為一種補充層。
到2025年,通訊服務將佔總收入的38.64%,成為所有網路研討會、市政廳會議和培訓模組的基礎。將統一通訊即服務 (UCaaS) 合約捆綁銷售可以降低額外成本,而透過聊天、投票和問答收集的數據正被用於建立更廣泛的分析體系,從而提昇平台參與度。行銷和推廣服務預計將以11.98%的複合年成長率成長,這反映出市場正從傳統貿易展覽轉向贊助型虛擬展位,在虛擬展位上,點擊量和停留時間都可以進行量化衡量。隨著瀏覽器 Cookie 的逐步淘汰,透過註冊表單收集的第一方資料將變得更有價值,使品牌能夠建立自己的受眾群體並改善案源計分模型。增強型儀表板可即時顯示資源下載、展位訪問和會議請求等信息,從而提升贊助套餐的價值並擴大虛擬活動市場的整體規模。
目前,跨職能團隊正在協作設計整合了活動前電子郵件宣傳活動、平台內問答和活動後跟進環節的推廣宣傳活動,並將行銷自動化、客戶關係管理 (CRM) 和分析 API 連接起來。白牌客製化功能讓贊助商在大廳、幻燈片和會議回放中心展示其視覺形象,從而提升品牌知名度。數據驅動的洞察和可衡量的投資報酬率 (ROI) 形成的良性循環,正推動廣告主的預算持續流入數位樓層平面圖,加速虛擬活動市場的成長。
區域分析
北美擁有強大的寬頻環境、充足的軟體預算和蓬勃發展的供應商生態系統,預計到2025年將佔據虛擬活動市場40.12%的佔有率。美國企業正迅速將活動模組整合到協作套件中,而加拿大金融業則正在利用合規的雲端託管服務。在墨西哥,客服中心的擴張推動了培訓需求的成長。亞太地區正在崛起為第二大成長中心,擁有19億個5G連接,可實現低延遲串流媒體播放,預計年複合成長率將達到12.45%。從印度到韓國,各國政府都在資助數位服務藍圖,進而促進雲端技術的普及。多元化的語言環境以及中小企業數位化進程的推進,正在推動對人工智慧字幕和行動優先應用程式的需求,進而促進虛擬活動市場的擴張。
在受GDPR約束的歐洲法規環境下,加密和主權雲端選項正成為優先事項,企業越來越傾向於選擇擁有可靠資料保護記錄的平台。隨著多語種會議成為常態,人工智慧翻譯模組的重要性日益凸顯。德國和法國經常舉辦汽車和製藥業的高峰會,而英國的金融科技叢集也定期舉辦網路研討會。南美洲的發展雖然落後於其他地區,但正展現出強勁勢頭:巴西正在加速寬頻部署,阿根廷以出口為導向的科技中心也正吸引外國投資者在線上投資。開發銀行的各項計畫正在向虛擬公民論壇注入津貼,而這些計畫在公共部門的應用也日益成熟。
中東和非洲的情況依然喜憂參半。沙烏地阿拉伯和阿拉伯聯合大公國正根據其國家數位化策略投資建造超大規模資料中心,從而推動企業採用。儘管非洲市場面臨頻寬瓶頸,但隨著越來越多的用戶透過行動網際網路上的低位元率流接入,供應商正在最佳化轉碼器和離線同步應用程式。南非和奈及利亞分別在礦業和金融科技領域試行混合型展覽會展覽,顯示該地區的虛擬活動市場呈現上升趨勢。
其他好處:
- Excel格式的市場預測(ME)表
- 3個月的分析師支持
目錄
第1章:引言
- 研究假設和市場定義
- 調查範圍
第2章:調查方法
第3章執行摘要
第4章 市場狀況
- 市場概覽
- 產業供應鏈分析
- 市場促進因素
- 整合通訊即服務 (UCaaS) 和基於雲端的協作平台的快速普及。
- 遠距辦公和混合辦公模式在全球的擴展
- 降低成本並擴大覆蓋範圍:與現場活動的比較
- 身臨其境型VR 和 XR 體驗越來越受歡迎,這鼓勵了觀眾的參與。
- 將生成式人工智慧整合到即時翻譯和內容個人化中
- 強制性的碳中和活動正在推動財富 500 強企業在 ESG 策略中採用虛擬形式。
- 市場限制因素
- 大型線上活動中的資料安全和隱私問題
- 參與者參與度有限,對建立人脈關係缺乏熱情。
- 平台日益飽和,為企業帶來了供應商鎖定風險。
- 跨境虛擬活動的課稅和合規要求不一致。
- 宏觀經濟因素對市場的影響
- 監理情勢
- 技術展望
- 波特五力分析
第5章 市場規模與成長預測
- 按平台
- 網路為基礎的平台
- XR平台
- 雲端採用
- 本地部署
- 按服務類型
- 通訊服務
- 招募與人脈拓展
- 行銷與推廣
- 培訓和教育
- 透過使用
- 會議和高峰會
- 展覽/貿易展
- 新產品發布
- 其他用途
- 按事件類型
- 網路研討會
- 虛擬博覽會/展覽會/節慶活動
- 娛樂和節慶活動
- 公司會議
- 其他事件類型
- 按最終用戶行業分類
- 教育機構
- 公司
- 政府/公共部門
- 其他終端用戶產業
- 按收入來源
- 贊助
- 門票銷售
- 其他收入來源
- 按地區
- 北美洲
- 美國
- 加拿大
- 墨西哥
- 南美洲
- 巴西
- 阿根廷
- 其他南美國家
- 歐洲
- 德國
- 法國
- 英國
- 義大利
- 西班牙
- 其他歐洲國家
- 亞太地區
- 中國
- 日本
- 印度
- 韓國
- 澳洲
- 其他亞太國家
- 中東和非洲
- 中東
- 沙烏地阿拉伯
- 阿拉伯聯合大公國
- 土耳其
- 其他中東國家
- 非洲
- 南非
- 埃及
- 奈及利亞
- 其他非洲國家
- 中東
- 北美洲
第6章 競爭情勢
- 市場集中度
- 策略趨勢
- 市佔率分析
- 公司簡介
- 6Connex Inc.
- Alive Events Agency Pty Ltd
- Zoom Video Communications Inc.
- Avaya LLC
- vFairs LLC
- ALE International SAS
- NTT DATA Corporation
- Cisco Systems Inc.
- Cvent Holding Corp.
- EventX Limited
- George P. Johnson Experience Marketing Inc.
- Airmeet Inc.
- Microsoft Corporation
- ON24 Inc.
- Hopin Ltd.
- Accelevents Inc.
- BigMarker Holdings Inc.
- Stova Inc.
- Hubilo Technologies Inc.
- Bizzabo Ltd.
第7章 市場機會與未來展望
According to Mordor Intelligence, the virtual events market size stood at USD 16.61 billion in 2026 and is projected to reach USD 27.65 billion by 2031, advancing at a 10.72% CAGR during the forecast period.
This report is Segmented by Platform (Web-Based Platform, XR Platform, and More), Service Type (Communication Services, Recruitment and Networking, and More), Application (Conferences and Summits, and More), Event Type (Webinar, and More), End-User Industry (Educational Institutions, and More), Revenue Source (Sponsorship, and More), and Geography. The Market Forecasts are Provided in Terms of Value (USD).
Global Virtual Events Market Trends and Insights
Rapid Adoption of Unified Communications as a Service and Cloud-Based Collaboration Platforms
Enterprises migrating toward UCaaS bundles increasingly expect event-broadcast functions to sit beside voice, chat, and whiteboard tools, trimming separate webinar licenses and slashing evaluation cycles. Microsoft Teams, Zoom Workplace, and Cisco Webex each report triple-digit growth in monthly active users who launch company town halls without incremental procurement, refocusing competitive differentiation on API depth and third-party integrations. Cloud-native deployment removes server-capacity bottlenecks, letting event managers scale registration portals in hours. The resulting low marginal cost encourages frequent internal briefings and externally facing product showcases, normalizing digital formats for a broadening set of corporate rituals. These dynamics expand the addressable base for the virtual events market.
Expansion of Remote and Hybrid Work Models Globally
Public-sector labor data show telework stabilizing near one-quarter of the employed population in the United States, while cross-continent studies highlight similar persistence in Europe and Asia-Pacific. Distributed workforces multiply time-zone conflicts and widen carbon-reporting liabilities, making browser-based gatherings the default solution for quarterly kickoffs and partner briefings. Organizers now design agendas around asynchronous replay, modular tracks, and on-demand libraries, reversing pre-pandemic conventions that assumed uniform attendance windows. As companies integrate flexible work into talent strategies, consistent demand streams into the virtual events market.
Data Security and Privacy Concerns in Large-Scale Online Events
Regulators are sharpening scrutiny of attendee data, compelling encryption at rest, role-based access controls, and granular audit logs. Healthcare, financial services, and government agencies demand ISO 27001 or SOC 2 attestations before green-lighting platform contracts, stretching sales cycles. XR environments amplify sensitivity because eye-tracking, spatial movement, and biometric cues can reveal personal attributes, triggering new compliance checkpoints. Smaller associations lacking dedicated privacy officers often postpone virtual expansions, trimming near-term volumes in the virtual events market.
Other drivers and restraints analyzed in the detailed report include:
- Integration of Generative AI for Real-Time Translation and Content Personalization
- Carbon-Neutral Event Mandates Embedded in Fortune 500 ESG Strategies
- Limited Audience Engagement and Networking Fatigue
For complete list of drivers and restraints, kindly check the Table Of Contents.
Segment Analysis
Web-based solutions claimed 48.43% of the virtual events market share in 2025, underscoring how HTML5 and WebRTC deliver frictionless log-on experiences inside corporate firewalls. Enterprises value zero-install access, automatic scaling, and straightforward compliance audits. The dominance of browsers keeps entry costs low, inviting frequent internal updates and external webinars that expand the overall virtual events market size. Yet immersive XR venues are set to grow at an 11.64% CAGR to 2031, powered by multi-vendor headset standards that shrink integration hurdles. Automotive design walk-throughs, surgical simulations, and luxury real-estate tours already showcase the experiential lift of spatial presence. Although headset prices and user comfort remain hurdles, early adopters in manufacturing, healthcare, and education validate the pathway for broader adoption.
The interplay between browser and XR platforms is symbiotic. Browser-based lobbies increasingly route high-value sessions to optional headset environments, melding accessibility with immersion. Cloud orchestration lets organizers spin up parallel 2D and 3D streams, preserving audience reach while experimenting with advanced interactivity. As venture investment pours into photorealistic avatars, gesture recognition, and spatial audio, the virtual events market gains optionality, positioning XR as an additive layer rather than a binary substitute.
Communication services accounted for 38.64% of revenue in 2025, serving as the backbone of every webinar, town hall, and training module. Bundling UCaaS contracts compresses incremental spend, while data gathered through chats, polls, and Q&A feeds broader analytics stacks, reinforcing platform stickiness. Marketing and promotion services are forecast to compound at 11.98% annually, mirroring a shift from traditional trade shows to sponsored virtual booths that quantify every click and dwell. First-party data captured through gated registration forms becomes even more valuable as browser cookies are phased out, enabling brands to build owned audiences and refine lead-scoring models. Enhanced dashboards visualize asset downloads, booth traffic, and meeting requests in real time, elevating sponsorship packages and boosting the overall size of the virtual events market.
Cross-functional teams now co-design campaigns that weave pre-event email journeys with in-platform quizzes and post-event nurture tracks, linking marketing automation, CRM, and analytics APIs. White-label customization lets sponsors overlay visual identities on lobbies, slide decks, and session replay hubs, amplifying brand recall. The virtuous loop of data-driven insights and measurable ROI keeps advertiser budgets flowing toward digital floor plans, accelerating growth inside the virtual events market.
Complete Report Scope:
- By Platform
- Web-Based Platform
- XR Platform
- Cloud Deployment
- On-Premise Deployment
- By Service Type
- Communication Services
- Recruitment and Networking
- Marketing and Promotion
- Training and Education
- By Application
- Conferences and Summits
- Exhibitions / Trade Shows
- Product Launches
- Other Applications
- By Event Type
- Webinar
- Virtual Expo / Fairs / Festivals
- Entertainment and Festivals
- Corporate Meetings
- Other Event Types
- By End-User Industry
- Educational Institutions
- Corporate Enterprises
- Government and Public Sector
- Other End-User Industries
- By Revenue Source
- Sponsorship
- Ticket Sale
- Other Revenue Sources
- By Geography
- North America
- United States
- Canada
- Mexico
- South America
- Brazil
- Argentina
- Rest of South America
- Europe
- Germany
- France
- United Kingdom
- Italy
- Spain
- Rest of Europe
- Asia-Pacific
- China
- Japan
- India
- South Korea
- Australia
- Rest of Asia-Pacific
- Middle East and Africa
- Middle East
- Saudi Arabia
- United Arab Emirates
- Turkey
- Rest of Middle East
- Africa
- South Africa
- Egypt
- Nigeria
- Rest of Africa
- Middle East
- North America
Geography Analysis
North America wielded 40.12% of virtual events market share in 2025, backed by robust broadband, high software budgets, and a dense vendor ecosystem. U.S. enterprises rapidly bundle event modules into collaboration suites, while Canada's financial sector leans on compliant cloud hosting. Mexico's call-center expansion fuels incremental training demand. A second growth pole emerges in Asia-Pacific, projected to compound at 12.45% annually as 1.9 billion 5G connections unlock low-latency streaming. Governments from India to South Korea bankroll digital-service roadmaps, reinforcing cloud uptake. Diverse language landscapes and rising SME digitalization drive demand for AI subtitles and mobile-first apps, widening the virtual events market.
Europe's regulatory environment, defined by GDPR, prioritizes encryption and sovereign-cloud options, steering procurement toward platforms with robust data-protection pedigrees. Multilingual conference norms elevate AI translation modules. Germany and France host frequent automotive and pharmaceutical summits, while the United Kingdom's fintech clusters generate steady webinar cadences. South America trails but shows momentum as Brazil accelerates broadband rollout and Argentina's export tech hubs court foreign investors online. Development-bank schemes channel grants into virtual civic forums, anchoring public-sector uptake.
The Middle East and Africa remain heterogeneous. Saudi Arabia and the United Arab Emirates fund hyperscale data centers under national digital blueprints, spurring enterprise adoption. African markets face bandwidth bottlenecks, yet mobile internet leads many users to engage via low-bitrate streams, prompting vendors to optimize codecs and offline-synced apps. South Africa and Nigeria pilot hybrid trade shows for mining and fintech, respectively, signaling an upward curve for the regional virtual events market.
- 6Connex Inc.
- Alive Events Agency Pty Ltd
- Zoom Video Communications Inc.
- Avaya LLC
- vFairs LLC
- ALE International SAS
- NTT DATA Corporation
- Cisco Systems Inc.
- Cvent Holding Corp.
- EventX Limited
- George P. Johnson Experience Marketing Inc.
- Airmeet Inc.
- Microsoft Corporation
- ON24 Inc.
- Hopin Ltd.
- Accelevents Inc.
- BigMarker Holdings Inc.
- Stova Inc.
- Hubilo Technologies Inc.
- Bizzabo Ltd.
Additional Benefits:
- The market estimate (ME) sheet in Excel format
- 3 months of analyst support
TABLE OF CONTENTS
1 INTRODUCTION
- 1.1 Study Assumptions and Market Definition
- 1.2 Scope of the Study
2 RESEARCH METHODOLOGY
3 EXECUTIVE SUMMARY
4 MARKET LANDSCAPE
- 4.1 Market Overview
- 4.2 Industry Supply-Chain Analysis
- 4.3 Market Drivers
- 4.3.1 Rapid Adoption of Unified Communications as a Service (UCaaS) and Cloud-Based Collaboration Platforms
- 4.3.2 Expansion of Remote and Hybrid Work Models Globally
- 4.3.3 Cost Savings and Extended Reach Versus Physical Events
- 4.3.4 Growing Acceptance of Immersive VR and XR Experiences for Audience Engagement
- 4.3.5 Integration of Generative AI for Real-Time Translation and Content Personalization
- 4.3.6 Carbon-Neutral Event Mandates Driving Virtual Format Adoption in Fortune 500 ESG Strategies
- 4.4 Market Restraints
- 4.4.1 Data Security and Privacy Concerns in Large-Scale Online Events
- 4.4.2 Limited Audience Engagement and Networking Fatigue
- 4.4.3 Rising Platform Saturation Leading to Vendor Lock-In Risk for Enterprises
- 4.4.4 Inconsistent Cross-Border Virtual Event Taxation and Compliance Requirements
- 4.5 Impact of Macroeconomic Factors on the Market
- 4.6 Regulatory Landscape
- 4.7 Technological Outlook
- 4.8 Porter's Five Forces Analysis
- 4.8.1 Bargaining Power of Suppliers
- 4.8.2 Bargaining Power of Consumers
- 4.8.3 Threat of New Entrants
- 4.8.4 Threat of Substitute Products
- 4.8.5 Intensity of Competitive Rivalry
5 MARKET SIZE AND GROWTH FORECASTS (VALUE)
- 5.1 By Platform
- 5.1.1 Web-Based Platform
- 5.1.2 XR Platform
- 5.1.3 Cloud Deployment
- 5.1.4 On-Premise Deployment
- 5.2 By Service Type
- 5.2.1 Communication Services
- 5.2.2 Recruitment and Networking
- 5.2.3 Marketing and Promotion
- 5.2.4 Training and Education
- 5.3 By Application
- 5.3.1 Conferences and Summits
- 5.3.2 Exhibitions / Trade Shows
- 5.3.3 Product Launches
- 5.3.4 Other Applications
- 5.4 By Event Type
- 5.4.1 Webinar
- 5.4.2 Virtual Expo / Fairs / Festivals
- 5.4.3 Entertainment and Festivals
- 5.4.4 Corporate Meetings
- 5.4.5 Other Event Types
- 5.5 By End-User Industry
- 5.5.1 Educational Institutions
- 5.5.2 Corporate Enterprises
- 5.5.3 Government and Public Sector
- 5.5.4 Other End-User Industries
- 5.6 By Revenue Source
- 5.6.1 Sponsorship
- 5.6.2 Ticket Sale
- 5.6.3 Other Revenue Sources
- 5.7 By Geography
- 5.7.1 North America
- 5.7.1.1 United States
- 5.7.1.2 Canada
- 5.7.1.3 Mexico
- 5.7.2 South America
- 5.7.2.1 Brazil
- 5.7.2.2 Argentina
- 5.7.2.3 Rest of South America
- 5.7.3 Europe
- 5.7.3.1 Germany
- 5.7.3.2 France
- 5.7.3.3 United Kingdom
- 5.7.3.4 Italy
- 5.7.3.5 Spain
- 5.7.3.6 Rest of Europe
- 5.7.4 Asia-Pacific
- 5.7.4.1 China
- 5.7.4.2 Japan
- 5.7.4.3 India
- 5.7.4.4 South Korea
- 5.7.4.5 Australia
- 5.7.4.6 Rest of Asia-Pacific
- 5.7.5 Middle East and Africa
- 5.7.5.1 Middle East
- 5.7.5.1.1 Saudi Arabia
- 5.7.5.1.2 United Arab Emirates
- 5.7.5.1.3 Turkey
- 5.7.5.1.4 Rest of Middle East
- 5.7.5.2 Africa
- 5.7.5.2.1 South Africa
- 5.7.5.2.2 Egypt
- 5.7.5.2.3 Nigeria
- 5.7.5.2.4 Rest of Africa
- 5.7.5.1 Middle East
- 5.7.1 North America
6 COMPETITIVE LANDSCAPE
- 6.1 Market Concentration
- 6.2 Strategic Moves
- 6.3 Market Share Analysis
- 6.4 Company Profiles (includes Global level Overview, Market level overview, Core Segments, Financials as available, Strategic Information, Market Rank/Share for key companies, Products and Services, and Recent Developments)
- 6.4.1 6Connex Inc.
- 6.4.2 Alive Events Agency Pty Ltd
- 6.4.3 Zoom Video Communications Inc.
- 6.4.4 Avaya LLC
- 6.4.5 vFairs LLC
- 6.4.6 ALE International SAS
- 6.4.7 NTT DATA Corporation
- 6.4.8 Cisco Systems Inc.
- 6.4.9 Cvent Holding Corp.
- 6.4.10 EventX Limited
- 6.4.11 George P. Johnson Experience Marketing Inc.
- 6.4.12 Airmeet Inc.
- 6.4.13 Microsoft Corporation
- 6.4.14 ON24 Inc.
- 6.4.15 Hopin Ltd.
- 6.4.16 Accelevents Inc.
- 6.4.17 BigMarker Holdings Inc.
- 6.4.18 Stova Inc.
- 6.4.19 Hubilo Technologies Inc.
- 6.4.20 Bizzabo Ltd.
7 MARKET OPPORTUNITIES AND FUTURE OUTLOOK
- 7.1 White-Space and Unmet-Need Assessment

 虛擬活動平台市場-2026-2032年全球市場預測
 虛擬活動平台市場 - 全球產業規模、佔有率、趨勢、機會、預測:按組件、組織規模、最終用戶、地區和競爭對手分類,2021-2031 年
 虛擬活動產業市場分析及預測(至2035年):類型、產品類型、服務、技術、組件、應用、部署模式、最終用戶、解決方案、實現方式
 2026年全球虛擬活動市場報告2026年全球虛擬活動平台市場報告2026年全球線上直播網路研討會軟體市場報告2026年全球虛擬演唱會平台市場報告虛擬活動市場分析及預測(至2035年):按類型、產品、服務、技術、組件、應用、格式、部署、最終用戶及解決方案分類虛擬活動平台市場分析及預測(至2035年):按類型、產品、服務、技術、組件、應用、部署、最終用戶、功能及解決方案分類
 全球虛擬活動市場規模、佔有率、趨勢和成長分析報告(2026-2034)