


 |
市場調查報告書
商品編碼
2124632
美國校車:市場佔有率分析、行業趨勢和統計數據以及成長預測(2026-2031 年)United States School Bus - Market Share Analysis, Industry Trends & Statistics, Growth Forecasts (2026 - 2031) |
||||||

※ 本網頁內容可能與最新版本有所差異。詳細情況請與我們聯繫。
據 Mordor Intelligence 稱,2025 年美國校車市場價值 58.3 億美元,預計到 2031 年將從 2026 年的 62.5 億美元成長到 88.2 億美元,預測期(2026-2031 年)的複合年成長率為 7.13%。
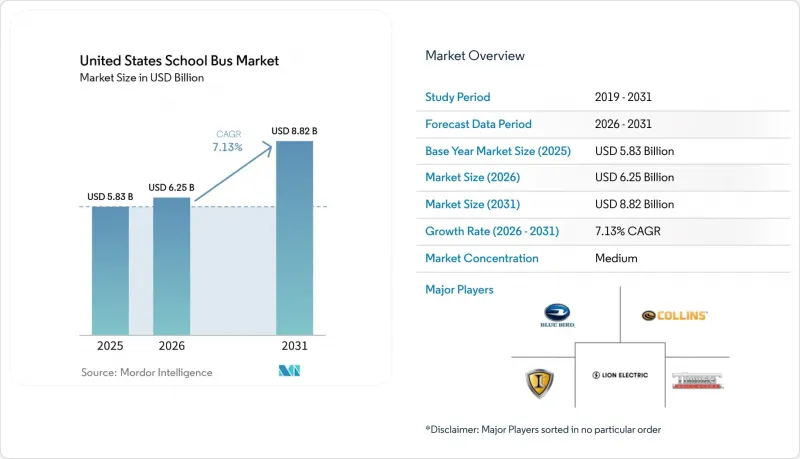
本報告按設計類型(A型(剖面圖)、B型及其他)、動力傳動系統類型(內燃機、混合動力和電動)、所有權類型(學區車輛和承包商車輛)以及座位數(少於30座、30-60座和30座及以上)進行細分。市場預測以貨幣價值(美元)和銷售(輛)兩種形式呈現。
美國校車市場趨勢與洞察
美國環保署的「清潔校車計畫」帶來了聯邦資金的激增。
國會撥款50億美元,分五年(2022-2026財政年度)用於加速車輛電氣化。 2024年9月,第三筆撥款提供了9.65億美元的補貼,用於彌補從柴油車轉向電動車所帶來的大部分價格差額。這項獎勵計畫主要針對零排放車輛,鼓勵學區將傳統的10年更換週期縮短至3-5年。公平條款確保大部分補貼分配給特別需要支持的農村和原住民社區,從而擴大製造商的基本客群。目前,原始設備製造商(OEM)的訂單積壓已達24個月,顯示2027年需求將持續強勁。這項資金的快速到位也為金融合作夥伴提供了長期前景,並促進了一種新的「車輛停放即服務」(Depot-as-a-Service)模式的建立,以支持美國校車市場。
家用老舊車輛(車齡11年或以上)正在更換需求。
到2024年,美國相當一部分校車車齡將超過11年。這是2008年至2012年景氣衰退期間支出延遲的結果。維護這些老舊校車的成本不斷上升,許多相關人員正在考慮提前報廢。鏽蝕、柴油顆粒過濾器故障和車架疲勞等問題導致校車迫在眉睫地報廢,尤其是在俄亥俄州、密西根州和賓夕法尼亞州。二手校車市場蓬勃發展,其轉售價值有可能抵消向電池動力車型過渡所帶來的大部分額外成本。這種需求的激增起到了緩衝作用,保護美國校車市場免受學生人數波動的影響。
農村地區充電基礎設施不足
在許多非都市區縣,由於缺乏距離合理的直流快速充電站,當地學區不得不投資購買大型電池組。嚴寒的冬季會進一步加劇這種情況,大幅縮短校車的續航里程。此外,當地變電站的供電量通常不足所有校車所在車庫所需的一半。雖然聯邦國家電氣化計劃(NEVI)的資金主要用於高速公路建設,但「最後一公里」的供電需求卻被嚴重忽視。升級電網成本高昂,阻礙了農村地區的電氣化進程,並減緩了美國校車市場的成長前景,尤其是在都市區和郊區以外的地區。
細分市場分析
2025年,傳統C型公車的交付量佔比高達79.12%,預計到2031年將以9.02%的複合年成長率成長,成長率高於美國校車市場整體水準。 C型公車載客量為54至84人,操控性優異,採用前置引擎設計,使其非常適合郊區常見的客流密度不同的線路。 C型底盤易於改裝為電動車,所需電池組容量更小,且與後置引擎的D型車型相比,在寒冷氣候下性能更佳。
D型校車市場佔有率雖小,但在客流量大的都市區線路(每條線路超過80名乘客)上佔據主導地位。然而,較高的價格溢價和車庫空間的限制限制了其廣泛應用。 A型小型校車(座位數少於30個)滿足了農村地區和有特殊需求的細分市場,預計將以顯著的複合年成長率成長。 A型校車採用商用廂型車底盤,提高了燃油效率並降低了維護成本,使其成為小規模學區轉型為替代能源時的理想選擇。因此,設計多樣化是美國校車市場穩定成長的基礎。
預計到2031年,混合動力汽車和電動車的複合年成長率將達到36.45%,但截至2025年,內燃機仍佔據美國校車市場88.35%的佔有率。尤其是在加州和紐約州,聯邦補貼和州政府獎勵的結合正在縮小電動動力系統與燃油動力傳動系統的價格差距。雖然在設定了明確零排放期限的沿海州,電動公車的普及率正在提高,但由於燃油價格較低且充電基礎設施有限,柴油車在東南部和大平原地區仍然佔據主導地位。可再生柴油的兼容性和先進的排放氣體後處理技術正在延長傳統引擎的使用壽命,並為電網不已開發地區提供了過渡策略。
為了獲得「購買美國貨」的獎勵,電動巴士製造商正將生產集中在中西部地區;電池供應商也紛紛遷至該地區,以最大限度地降低物流成本。 Lion Electric位於喬利埃特的工廠計劃大幅提高年產量,規模經濟效應表明,到2028年,其採購成本有望降低。同時,柴油車製造商正在推出針對運作循環最佳化的引擎,從而大幅減少顆粒物排放,並實現與氫化植物油的兼容。此外,隨著學區直接轉向零排放技術,混合動力汽車正逐漸被邊緣化。這種轉變不僅最大限度地提高了採購獎勵,還推動了對電池平台的投資,從而增強了美國校車市場的整體發展勢頭。
其他好處:
- Excel格式的市場預測(ME)表
- 3個月的分析師支持
目錄
第1章:引言
- 研究假設和市場定義
- 調查範圍
第2章:調查方法
第3章執行摘要
第4章 市場狀況
- 市場概覽
- 市場促進因素
- 美國環保署「清潔校車計畫」的聯邦資金大幅增加
- 國內車輛老化(車齡超過 11 年)正在推動車輛更換需求。
- 嚴格的車內安全法規正在加速車輛的更替。
- 在不符合標準的地區,對低氮氧化物「其他燃料」的需求不斷成長。
- 學區車輛到電網(V2G)的獲利能力
- 將倉庫微電網與太陽能發電結合,可降低電力總擁有成本 (TCO)。
- 市場限制因素
- 農村地區充電基礎設施不足
- 儘管有獎勵,但電動公車的初始成本相對較高。
- 高壓維修技術人員短缺
- 中型底盤供應瓶頸
- 價值供應鏈分析
- 監理情勢和資金籌措趨勢
- 技術展望
- 波特五力模型
第5章 市場規模與成長預測
- 依設計類型
- A型(剖面圖)
- B型
- C型(常規型)
- D 型(Transit Style)
- 依動力傳動系統類型
- 內燃機(內燃機)
- 混合動力和電動車
- 依所有權類型
- 地方政府擁有的車輛
- 承包商擁有的車輛
- 按座位數
- 不到30個座位
- 30-60個座位
- 超過60個座位
第6章 競爭情勢
- 市場集中度
- 策略舉措和夥伴關係
- 市佔率分析
- 公司簡介
- Blue Bird Corporation
- Daimler Truck North America LLC(Thomas Built)
- Navistar Inc.(IC Bus)
- Collins Bus Corporation
- Lion Electric Company
- GreenPower Motor Company Inc.
- Micro Bird Inc.(Girardin)
- BYD Motors USA
- Van-Con, Inc.
- Starcraft Bus
- Trans Tech Bus
第7章 市場機會與未來展望
According to Mordor Intelligence, the United States school bus market size was valued at USD 5.83 billion in 2025 and estimated to grow from USD 6.25 billion in 2026 to reach USD 8.82 billion by 2031, at a CAGR of 7.13% during the forecast period (2026-2031).
This report is Segmented by Design Type (Type A (Cut-Away), Type B, and More), Powertrain Type (Internal Combustion Engine and Hybrid and Electric), Ownership Model (District-Owned Fleets and Contractor-Owned Fleets), and Seating Capacity (Less Than 30 Seats, 30-60 Seats, and More). The Market Forecasts are Provided in Terms of Value (USD) and Volume (Units).
United States School Bus Market Trends and Insights
Federal Funding Surge via EPA Clean School Bus Program
Congress allocated USD 5 billion over five years (FY 2022-2026) to accelerate fleet electrification, and the third funding round in September 2024 awarded USD 965 million in rebates that cover a notable share of the diesel-to-electric price gap . The incentive structure is heavily skewed toward zero-emission vehicles, prompting districts to compress traditional 10-year replacement cycles into 3-to-5-year windows. Equity provisions direct a disproportionate share of rebates to high-need rural and tribal communities, broadening the customer base for manufacturers. OEM order books now stretch up to 24 months, signalling sustained demand momentum through 2027. The funding cadence also gives financing partners long-term visibility, spurring new depot-as-a-service offerings that anchor the United States school bus market.
Aging National Fleet (Above 11 yrs) Pushing Replacement Demand
By 2024, a significant portion of the United States school buses surpassed the 11-year mark, a consequence of deferred spending following the 2008-2012 recession. Maintenance on these aging buses has become increasingly costly, prompting many to consider accelerated scrappage. Issues like rust-belt corrosion, diesel particulate filter failures, and frame fatigue are leading to emergency retirements, especially in states like Ohio, Michigan, and Pennsylvania. A thriving market for used buses has emerged, with resale values potentially offsetting a substantial portion of the added costs for districts transitioning to battery models. This demographic surge provides a buffer, shielding the United States school bus market from fluctuations in enrollment.
Sparse Rural Charging Infrastructure
Rural districts are compelled to invest in oversized battery packs, as many non-metropolitan counties find themselves without a DC fast-charging station within a reasonable distance. The situation is exacerbated by sub-zero winters, which can significantly diminish the bus range. Moreover, local substations frequently provide less than half of the power required for a depot servicing a full fleet of buses. While federal NEVI funds focus on highway corridors, they largely overlook funding for last-mile depot access. Upgrading the grid can involve substantial costs, hindering rural electrification efforts and dampening growth prospects for the United States school bus market, especially in areas beyond urban and suburban locales.
Other drivers and restraints analyzed in the detailed report include:
- Stringent On-board Safety Mandates Accelerating Fleet Renewal
- Low-NOx "Other Fuels" Demand in Non-attainment Counties
- High Upfront Cost of E-Buses Despite Incentives
For complete list of drivers and restraints, kindly check the Table Of Contents.
Segment Analysis
Type C conventional buses accounted for 79.12% of 2025 deliveries and are projected to expand faster than the wider United States school bus market at a 9.02% CAGR through 2031. Their 54-84 passenger capacity, maneuverability, and front-engine design suit the mixed-density routes common in suburban districts. Electric conversions are easier on Type C frames, requiring smaller battery packs and offering better cold-weather performance than rear-engine Type D models.
Type D transit buses hold a nominal share and dominate dense urban corridors where routes exceed 80 passengers. The steep price premium and depot space limitations constrain broader uptake. Type A cutaways, with under-30-seat layouts, fill rural and special-needs niches and will grow at a notable CAGR. Their commercial van chassis improves fuel economy and lowers maintenance costs, providing an attractive entry point for small districts transitioning to alternative energy. Design diversification, therefore, underpins steady growth within the United States school bus market.
Hybrid and electric units are forecast to grow at a 36.45% CAGR through 2031, although internal-combustion engines retained 88.35% of the United States school bus market share in 2025. The premium price tag on electric powertrains is narrowing as federal rebates stack with state incentives, especially in California and New York. Electric deployments increased in coastal states that have firm zero-emission deadlines, while diesel remains entrenched in the Southeast and Great Plains due to cheaper fuel and limited charging infrastructure. Renewable diesel compatibility and advanced emissions after-treatment are extending the runway for traditional engines, offering a bridge strategy where grid readiness lags.
Electric bus makers are clustering production in the Midwest to capture Buy America credits, and battery suppliers are co-locating to minimize logistics costs. Lion Electric's Joliet plant aims for significant annual output, hinting at potential scale efficiencies that might reduce acquisition costs by 2028. In response, diesel offerings have introduced duty-cycle-optimized engines, achieving a notable reduction in particulate emissions and compatibility with hydrotreated vegetable oil. Meanwhile, hybrids are becoming less relevant as districts leap directly to zero-emission technologies. This shift not only maximizes incentive capture but also channels investments into battery platforms, bolstering the overall momentum of the United States school bus market.
Complete Report Scope:
- By Design Type
- Type A (Cut-away)
- Type B
- Type C (Conventional)
- Type D (Transit-Style)
- By Powertrain Type
- Internal Combustion Engine (IC Engine)
- Hybrid and Electric
- By Ownership Model
- District-Owned Fleets
- Contractor-Owned Fleets
- By Seating Capacity
- Less than 30 Seats
- 30-60 Seats
- Above 60 Seats
List of Companies Covered in this Report:
- Blue Bird Corporation
- Daimler Truck North America LLC (Thomas Built)
- Navistar Inc. (IC Bus)
- Collins Bus Corporation
- Lion Electric Company
- GreenPower Motor Company Inc.
- Micro Bird Inc. (Girardin)
- BYD Motors USA
- Van-Con, Inc.
- Starcraft Bus
- Trans Tech Bus
Additional Benefits:
- The market estimate (ME) sheet in Excel format
- 3 months of analyst support
TABLE OF CONTENTS
1 Introduction
- 1.1 Study Assumptions & Market Definition
- 1.2 Scope of the Study
2 Research Methodology
3 Executive Summary
4 Market Landscape
- 4.1 Market Overview
- 4.2 Market Drivers
- 4.2.1 Federal Funding Surge via EPA Clean School Bus Program
- 4.2.2 Aging National Fleet (Above 11 yrs) Pushing Replacement Demand
- 4.2.3 Stringent On-board Safety Mandates Accelerating Fleet Renewal
- 4.2.4 Low-NOx "Other Fuels" Demand in Non-attainment Counties
- 4.2.5 Vehicle-to-Grid (V2G) Revenue Potential for School Districts
- 4.2.6 Depot Micro-grid and Solar Pairing Lowers Electric TCO
- 4.3 Market Restraints
- 4.3.1 Sparse Rural Charging Infrastructure
- 4.3.2 High Upfront Cost of E-Buses Despite Incentives
- 4.3.3 Scarcity of High-Voltage Maintenance Technicians
- 4.3.4 Medium-Duty Chassis Supply Bottlenecks
- 4.4 Value / Supply-Chain Analysis
- 4.5 Regulatory & Funding Landscape
- 4.6 Technological Outlook
- 4.7 Porter's Five Forces
- 4.7.1 Bargaining Power of Suppliers
- 4.7.2 Bargaining Power of Buyers
- 4.7.3 Threat of New Entrants
- 4.7.4 Threat of Substitutes
- 4.7.5 Competitive Rivalry
5 Market Size & Growth Forecasts (Value (USD) and Volume (Units))
- 5.1 By Design Type
- 5.1.1 Type A (Cut-away)
- 5.1.2 Type B
- 5.1.3 Type C (Conventional)
- 5.1.4 Type D (Transit-Style)
- 5.2 By Powertrain Type
- 5.2.1 Internal Combustion Engine (IC Engine)
- 5.2.2 Hybrid and Electric
- 5.3 By Ownership Model
- 5.3.1 District-Owned Fleets
- 5.3.2 Contractor-Owned Fleets
- 5.4 By Seating Capacity
- 5.4.1 Less than 30 Seats
- 5.4.2 30-60 Seats
- 5.4.3 Above 60 Seats
6 Competitive Landscape
- 6.1 Market Concentration
- 6.2 Strategic Moves & Partnerships
- 6.3 Market Share Analysis
- 6.4 Company Profiles (includes Global Level Overview, Market Level Overview, Core Segments, Financials as Available, Strategic Information, Market Rank/Share for Key Companies, Products and Services, SWOT Analysis, and Recent Developments)
- 6.4.1 Blue Bird Corporation
- 6.4.2 Daimler Truck North America LLC (Thomas Built)
- 6.4.3 Navistar Inc. (IC Bus)
- 6.4.4 Collins Bus Corporation
- 6.4.5 Lion Electric Company
- 6.4.6 GreenPower Motor Company Inc.
- 6.4.7 Micro Bird Inc. (Girardin)
- 6.4.8 BYD Motors USA
- 6.4.9 Van-Con, Inc.
- 6.4.10 Starcraft Bus
- 6.4.11 Trans Tech Bus
7 Market Opportunities & Future Outlook
- 7.1 White-Space & Unmet-Need Assessment

 校車市場規模、佔有率、成長、全球產業分析、區域趨勢及2026年至2034年預測
 校車:市佔率分析、產業趨勢與統計、成長預測(2026-2031)全球校車市場,2025-2035年全球校車市場規模、佔有率、趨勢和成長分析報告(2026-2034年)
 2026年全球校車市場報告
 小型校車市場 - 全球產業規模、佔有率、趨勢、機會、預測:按動力方式、等級、地區和競爭格局分類,2021-2031年
 校車市場規模、佔有率和成長分析(按動力類型、等級、應用、座位數、驅動系統、安全特性和地區分類)-2026-2033年產業預測Frost Radar:北美校車製造商,2025 年
 全球中型校車市場
 2025-2029 年全球校車市場