


 |
市場調查報告書
商品編碼
2114429
校車:市佔率分析、產業趨勢與統計、成長預測(2026-2031)School Bus - Market Share Analysis, Industry Trends & Statistics, Growth Forecasts (2026 - 2031) |
||||||

※ 本網頁內容可能與最新版本有所差異。詳細情況請與我們聯繫。
據 Mordor Intelligence 稱,2025 年校車市值為 506.3 億美元,預計到 2031 年將達到 700.6 億美元,而 2026 年為 534.4 億美元,預測期(2026-2031 年)的複合年成長率為 5.57%。
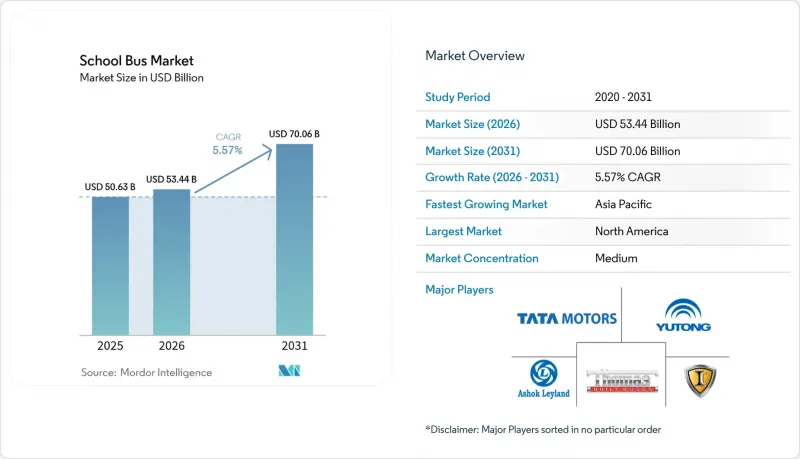
本報告依動力傳動系統(內燃機等)、座位數(30座及以下及30座以上)、巴士類型(A型、B型等)、最終用戶(公立學區等)及地區進行細分。市場預測以貨幣價值(美元)和銷售(輛)兩種形式呈現。
全球校車市場趨勢及洞察
政府的排放氣體法規正在加速車輛電氣化進程。
加州的「先進清潔車隊規則」規定,到2035年,所有新購車輛必須實現零排放。美國其他幾個州也採納了這項標準,目前該標準正在影響歐洲各市的競標。該合規框架包含可交易的碳權額度,允許學區將減排收入再投資,以進一步實現車隊現代化。歐盟VII顆粒物排放標準將於2025年生效,屆時傳統柴油動力系統將逐步淘汰。這將迫使歐洲營運商探索零排放替代方案。未能達到這些標準將導致路線限制和服務柔軟性降低,使電氣化更成為一種營運要求,而非僅僅是環境考量。
聯邦和州政府為零排放校車設立了專款池
美國《基礎設施投資與就業法案》撥出巨額資金專門用於津貼購買清潔校車,使其成為該領域歷史上規模最大的單一經濟獎勵策略。資金分配優先考慮經濟低度開發地區,加速了這些地區因預算限制而長期阻礙現代化進程的技術普及。各州政府的補貼,例如加州的「高價值車輛補貼計畫」(HVIP),進一步增強了這一優勢,使得每輛校車都能獲得可觀的補貼,有效抵消了與柴油車相比的所有額外資本成本。許多此類獎勵中都包含有利於本地組裝進行採購決策的國內採購規則,從而影響了全球籌資策略。
電動和燃料電池公車的初始成本很高。
由於電池組成本高成本,佔車輛總成本的很大一部分,電動公車的價格遠高於柴油公車。原物料價格(尤其是鋰和鎳)的波動造成了預算的不確定性,並進一步增加了採購決策的複雜性。燃料電池平台的高成本,主要原因是車載儲氫裝置、高壓管道和燃料電池堆的成本,而這些零件的製造成本仍然很高。在農村和低收入地區,由於難以獲得傳統債券和綠色金融工具,資金籌措挑戰尤其突出。因此,即使在補貼覆蓋範圍廣的地區,不同地區的普及率也存在差異。
細分市場分析
到2025年,內燃機將佔校車市場82.74%的佔有率。這主要是由於融資拮据的學區對柴油引擎的需求強勁,而這又得益於現有的維護基礎設施以及對柴油採購的熟悉程度。純電動校車是成長最快的細分市場,預計到2031年將以5.61%的複合年成長率成長。這是因為營運商正在利用聯邦津貼和電池價格下降的因素來證明轉型在經濟上的合理性。燃料電池校車仍然是一個小眾市場,主要集中在有政策支持和完善的氫氣供應網路的地區。再生煞車和更少的活動部件使電動校車的維護成本降低了60%至70%,從而降低了整體生命週期成本。
目前的電池能量密度可使車輛單次充電行駛 150-200 英里,足以滿足大多數日常路線的需求,而無需在白天充電。雖然燃料電池系統可以快速加氫,但由於加氫站網路稀疏,其應用僅限於示範車輛。總體而言,動力傳動系統的轉變正在重塑與供應商的契約,電池組的採購已成為校車市場的關鍵瓶頸。
至2025年,31至60座的校車將佔校車市佔率的47.29%。這代表著在滿足平均交通需求的同時,避免車輛數量過度增加的最佳平衡點。預計到2031年,30人座及以下的校車將以5.63%的複合年成長率成長,這將有利於那些根據年級、特殊需求學生和課後活動等因素細分路線的學區。
座位數超過60座的車型主要用於人口密集的線路,但其成長受到轉彎半徑和路緣長度等基礎設施限制的限制。小型車輛的普及與家庭規模縮小和學校選擇多樣化等人口趨勢相吻合,而這兩者都在推動線路多樣化。學區也在透過將小型校車重新部署用於校外活動和體育活動來最大限度地利用資產。這種車輛尺寸重組的趨勢表明,未來的生產線可能會從單一的大規模生產模式轉向多產品生產,這將重塑校車市場生產力計畫的計算方式。
區域分析
預計到2025年,北美將佔據校車市場38.22%的佔有率,這反映了其在資金籌措、製造和電網整合方面的累積優勢。各州與公共產業之間的夥伴關係正在支持V2G(車輛到電網)試點項目,這些項目將閒置的車輛轉化為分散式能源,從而抵消高昂的採集費用。加拿大透過其綠色基礎設施基金和減排目標正獲得進一步發展動力,而墨西哥在美墨加協定(USMCA)中的作用正在簡化供應鏈,但目前部署仍集中在大都會圈區。
亞太地區在該領域展現出最強勁的成長勢頭,預計到2031年將維持5.64%的複合年成長率。這主要得益於中國將強制性電氣化目標與國內電池產能結合,有效降低了成本。印度的「國家電動巴士計畫」正在擴大目標市場,首次在二線城市引進專用校車。在日本和韓國,先進的ADAS(高級駕駛輔助系統)正在推廣應用,並提升了區域安全標準,其影響也逐漸滲透到國際標準層面。
在歐洲,隨著高硫柴油燃料在歐VII排放標準的逐步淘汰下被淘汰,以及各國利用經濟獎勵策略補貼替代驅動系統,新能源汽車市場維持穩定成長。德國正利用現有的燃料電池技術來探索氫燃料的應用,而英國則透過引進小型巴士來優先提升本地交通網路的連結性。由於財政限制,南歐國家在新能源車領域的進展更為謹慎,但地方政府徵收的壅塞收費正間接加速柴油車的淘汰。
其他好處:
- Excel格式的市場預測(ME)表
- 3個月的分析師支持
目錄
第1章:引言
- 研究假設和市場定義
- 調查範圍
第2章:調查方法
第3章執行摘要
第4章 市場狀況
- 市場概覽
- 市場促進因素
- 政府的排放氣體法規正在加速車輛電氣化進程。
- 聯邦和州政府設立了專門的資金池,用於零排放校車。
- 先進安全技術的應用正在逐步推進。
- 車輛到電網(V2G)在學區的收入潛力
- 基於訂閱的「車隊即服務」模式
- 利用人工智慧進行路線最佳化,降低營運成本
- 市場限制因素
- 電動車和燃料電池汽車的初始成本較高
- 充電環境/氫氣加註基礎設施的限制
- 由於電池供應波動,生產前置作業時間越來越長。
- 缺乏熟悉替代驅動系統的工程師
- 價值供應鏈分析
- 技術展望
- 監理情勢
- 波特五力模型
第5章 市場規模與成長預測
- 按動力傳動系統
- 內燃機(ICE)
- 電池式電動車
- 燃料電池電動車
- 按座位數
- 30個座位或更少
- 31-60個座位
- 超過60個座位
- 按公車類型
- A型
- B型
- C型
- D型
- 最終用戶
- 公立學區
- 私人和包機運營商
- 承包商和租賃公司
- 按地區
- 北美洲
- 美國
- 加拿大
- 其他北美國家
- 南美洲
- 巴西
- 阿根廷
- 其他南美國家
- 歐洲
- 德國
- 英國
- 法國
- 義大利
- 西班牙
- 俄羅斯
- 其他歐洲國家
- 亞太地區
- 中國
- 日本
- 印度
- 韓國
- 其他亞太國家
- 中東和非洲
- 沙烏地阿拉伯
- 阿拉伯聯合大公國
- 土耳其
- 南非
- 埃及
- 其他中東和非洲國家
- 北美洲
第6章 競爭情勢
- 市場集中度
- 策略趨勢
- 市佔率分析
- 公司簡介
- Blue Bird Corporation
- Thomas Built Buses Inc.
- IC Bus LLC(International Motors LLC)
- Collins Bus Corporation
- Lion Electric Company
- BYD Co. Ltd.
- GreenPower Motor Company
- Girardin Minibus Inc.
- Yutong Bus Co. Ltd.
- Micro Bird Inc.
- Proterra Inc.
- Zhengzhou Yutong Bus Co. Ltd.
- Zhongtong Bus Holding Co. Ltd.
- FAW Bus and Coach Co. Ltd.
- Tata Motors Ltd.
- Ashok Leyland Ltd.
- Alexander Dennis Ltd.
- NFI Group Inc.
- Dongfeng Motor Corporation
- Mahindra & Mahindra Ltd.
- JCBL Limited
第7章 市場機會與未來展望
According to Mordor Intelligence, the school bus market size was valued at USD 50.63 billion in 2025 and estimated to grow from USD 53.44 billion in 2026 to reach USD 70.06 billion by 2031, at a CAGR of 5.57% during the forecast period (2026-2031).
This report is Segmented by Powertrain (Internal-Combustion Engine and More), Seating Capacity (Less Than or Equal To 30 Seats and More), Bus Type (Type A, Type B, and More), End User (Public School Districts and More), and Geography. The Market Forecasts are Provided in Terms of Value (USD) and Volume (Units).
Global School Bus Market Trends and Insights
Government Emissions Standards Accelerating Fleet Electrification
California's Advanced Clean Fleets Rule requires all new purchases to be zero-emission by 2035, a standard mirrored by several U.S. states and now influencing European municipal tenders. Compliance frameworks include tradable carbon credits, enabling districts to monetize avoided emissions and reinvest those proceeds in further fleet modernization efforts. Euro VII particulate limits come into effect in 2025 and will effectively phase out legacy diesel powertrains, compelling European operators to identify zero-emission alternatives. Failure to comply results in route restrictions that reduce service flexibility, making electrification an operational imperative rather than an environmental preference .
Dedicated Federal & State Funding Pools for Zero-Emission School Buses
The United States Infrastructure Investment and Jobs Act allocated a massive amount exclusively to clean school bus acquisition grants, the most significant single stimulus in the sector's history. Disbursements prioritize disadvantaged communities, accelerating the diffusion of technology where budget gaps have historically hindered modernization. Complementary state vouchers, such as California's HVIP, add up to a substantial amount per bus, effectively eliminating virtually all incremental capital premiums relative to diesel. Domestic-content rules embedded in many of those incentives tilt purchasing decisions toward local assembly lines, shaping global sourcing strategies .
High Upfront Cost of Electric & Fuel-Cell Variants
Electric buses are significantly more expensive than their diesel counterparts due to the high cost of battery packs, which make up a substantial portion of the vehicle's overall cost. The volatility in raw material prices, particularly for lithium and nickel, creates budget uncertainties, further complicating procurement decisions. Fuel-cell platforms are even more costly, primarily because of the expenses associated with onboard hydrogen storage, high-pressure lines, and fuel-cell stacks, which remain expensive to produce. Financing challenges are most pronounced in rural and low-income districts, where access to traditional bonds or green financing tools is limited. This results in uneven adoption rates, even in regions where subsidies are widely available.
Other drivers and restraints analyzed in the detailed report include:
- Rising Adoption of Advanced Safety Technologies
- Vehicle-to-Grid Revenue Potential for School Districts
- Limited Charging or Hydrogen Refueling Infrastructure
For complete list of drivers and restraints, kindly check the Table Of Contents.
Segment Analysis
Internal combustion engines held 82.74% of the school bus market share in 2025, as existing maintenance infrastructure and familiarity with diesel procurement kept diesel engines steady among cash-strapped districts. Battery-electric buses are the fastest-growing subcategory, tracking a 5.61% CAGR through 2031, as operators leverage federal grants and declining battery prices to justify the transition's economics. Fuel-cell variants remain a niche market, concentrated in regions with policy mandates and accessible hydrogen supply lines. Regenerative braking and fewer moving parts enable 60-70% lower maintenance costs for electric buses, thereby reducing total lifecycle expenses.
Current battery densities enable single-charge ranges of 150-200 miles, which are sufficient to cover most daily routes without requiring midday charging. Fuel-cell systems offer quick refueling but rely on a sparse station network, which limits their adoption to demonstration fleets. Overall, the powertrain shift is re-architecting supplier contracts as battery pack sourcing becomes the critical bottleneck in the school bus market.
Buses with 31-60 seats accounted for 47.29% of the school bus market share in 2025, an optimal compromise that meets average route demand without oversizing fleets. Vehicles with <=30 seats are projected to chart a 5.63% CAGR through 2031, benefiting districts that increasingly segment routes by grade level, special needs, or after-school activities.
Models exceeding 60 seats fill high-density corridors but face infrastructure constraints, such as turning radius and curb length, that slow their growth. Smaller capacity aligns with demographic trends, including reduced household sizes and higher school-choice variability, both of which increase route diversity. Districts also redeploy smaller buses for field trips or athletic transport, maximizing asset utilization. This resizing trend suggests that future manufacturing lines may shift towards multiplicity rather than single, high-volume models, reshaping the capacity planning calculus in the school bus market.
Complete Report Scope:
- By Powertrain
- Internal-Combustion Engine (ICE)
- Battery-Electric
- Fuel-Cell Electric
- By Seating Capacity
- Less than or equal to 30 Seats
- 31-60 Seats
- More than 60 Seats
- By Bus Type
- Type A
- Type B
- Type C
- Type D
- By End User
- Public School Districts
- Private & Charter Operators
- Contractors & Leasing Companies
- By Geography
- North America
- United States
- Canada
- Rest of North America
- South America
- Brazil
- Argentina
- Rest of South America
- Europe
- Germany
- United Kingdom
- France
- Italy
- Spain
- Russia
- Rest of Europe
- Asia Pacific
- China
- Japan
- India
- South Korea
- Rest of Asia Pacific
- Middle East and Africa
- Saudi Arabia
- United Arab Emirates
- Turkey
- South Africa
- Egypt
- Rest of Middle East and Africa
- North America
Geography Analysis
North America secures 38.22% of the school bus market share in 2025, reflecting cumulative advantages in funding, manufacturing, and grid integration. State-utility partnerships support V2G pilots that transform parked fleets into distributed energy resources, offsetting higher acquisition expense. Canada contributes additional momentum via green infrastructure funds and emissions-reduction targets, while Mexico's role in USMCA streamlines supply chains but leaves adoption centered in metropolitan corridors.
The Asia Pacific registers the sector's highest forward momentum, tracking a 5.64% CAGR through 2031, as China couples compulsory electrification targets with domestic battery capacity, which compresses cost curves. India's National Electric Bus Program widens the addressable base, with tier-two cities procuring purpose-built school buses for the first time. Japan and South Korea embed advanced ADAS, elevating regional safety benchmarks that reverberate into international standards.
Europe maintains stable gains as Euro VII standards phase out high-sulfur diesel and national stimulus funds subsidize alternative drivetrains. Germany explores hydrogen routes, leveraging existing fuel-cell competencies, while the United Kingdom emphasizes rural service connectivity through smaller bus footprints. Southern European economies progress more cautiously due to fiscal headroom constraints, yet municipal congestion-charging schemes indirectly hasten diesel replacement.
- Blue Bird Corporation
- Thomas Built Buses Inc.
- IC Bus LLC (International Motors LLC)
- Collins Bus Corporation
- Lion Electric Company
- BYD Co. Ltd.
- GreenPower Motor Company
- Girardin Minibus Inc.
- Yutong Bus Co. Ltd.
- Micro Bird Inc.
- Proterra Inc.
- Zhengzhou Yutong Bus Co. Ltd.
- Zhongtong Bus Holding Co. Ltd.
- FAW Bus and Coach Co. Ltd.
- Tata Motors Ltd.
- Ashok Leyland Ltd.
- Alexander Dennis Ltd.
- NFI Group Inc.
- Dongfeng Motor Corporation
- Mahindra & Mahindra Ltd.
- JCBL Limited
Additional Benefits:
- The market estimate (ME) sheet in Excel format
- 3 months of analyst support
TABLE OF CONTENTS
1 Introduction
- 1.1 Study Assumptions & Market Definition
- 1.2 Scope of the Study
2 Research Methodology
3 Executive Summary
4 Market Landscape
- 4.1 Market Overview
- 4.2 Market Drivers
- 4.2.1 Government Emissions Standards Accelerating Fleet Electrification
- 4.2.2 Dedicated Federal & State Funding Pools For Zero-Emission School Buses
- 4.2.3 Rising Adoption Of Advanced Safety Technologies
- 4.2.4 Vehicle-To-Grid (V2G) Revenue Potential For School Districts
- 4.2.5 Subscription-Based Fleet-As-A-Service Models
- 4.2.6 AI-Driven Route Optimisation Lowering OPEX
- 4.3 Market Restraints
- 4.3.1 High Upfront Cost Of Electric & Fuel-Cell Variants
- 4.3.2 Limited Charging / Hydrogen Refuelling Infrastructure
- 4.3.3 Battery-Supply Volatility Extending Production Lead-Times
- 4.3.4 Shortage Of Technicians Skilled In Alternative Drivetrains
- 4.4 Value / Supply-Chain Analysis
- 4.5 Technological Outlook
- 4.6 Regulatory Landscape
- 4.7 Porter's Five Forces
- 4.7.1 Bargaining Power of Suppliers
- 4.7.2 Bargaining Power of Buyers
- 4.7.3 Threat of New Entrants
- 4.7.4 Threat of Substitutes
- 4.7.5 Competitive Rivalry
5 Market Size & Growth Forecasts (Value (USD) and Volume (Units))
- 5.1 By Powertrain
- 5.1.1 Internal-Combustion Engine (ICE)
- 5.1.2 Battery-Electric
- 5.1.3 Fuel-Cell Electric
- 5.2 By Seating Capacity
- 5.2.1 Less than or equal to 30 Seats
- 5.2.2 31-60 Seats
- 5.2.3 More than 60 Seats
- 5.3 By Bus Type
- 5.3.1 Type A
- 5.3.2 Type B
- 5.3.3 Type C
- 5.3.4 Type D
- 5.4 By End User
- 5.4.1 Public School Districts
- 5.4.2 Private & Charter Operators
- 5.4.3 Contractors & Leasing Companies
- 5.5 By Geography
- 5.5.1 North America
- 5.5.1.1 United States
- 5.5.1.2 Canada
- 5.5.1.3 Rest of North America
- 5.5.2 South America
- 5.5.2.1 Brazil
- 5.5.2.2 Argentina
- 5.5.2.3 Rest of South America
- 5.5.3 Europe
- 5.5.3.1 Germany
- 5.5.3.2 United Kingdom
- 5.5.3.3 France
- 5.5.3.4 Italy
- 5.5.3.5 Spain
- 5.5.3.6 Russia
- 5.5.3.7 Rest of Europe
- 5.5.4 Asia Pacific
- 5.5.4.1 China
- 5.5.4.2 Japan
- 5.5.4.3 India
- 5.5.4.4 South Korea
- 5.5.4.5 Rest of Asia Pacific
- 5.5.5 Middle East and Africa
- 5.5.5.1 Saudi Arabia
- 5.5.5.2 United Arab Emirates
- 5.5.5.3 Turkey
- 5.5.5.4 South Africa
- 5.5.5.5 Egypt
- 5.5.5.6 Rest of Middle East and Africa
- 5.5.1 North America
6 Competitive Landscape
- 6.1 Market Concentration
- 6.2 Strategic Moves
- 6.3 Market Share Analysis
- 6.4 Company Profiles (Includes Global Level Overview, Market Level Overview, Core Segments, Financials as Available, Strategic Information, Market Rank/Share for Key Companies, Products and Services, SWOT Analysis, and Recent Developments)
- 6.4.1 Blue Bird Corporation
- 6.4.2 Thomas Built Buses Inc.
- 6.4.3 IC Bus LLC (International Motors LLC)
- 6.4.4 Collins Bus Corporation
- 6.4.5 Lion Electric Company
- 6.4.6 BYD Co. Ltd.
- 6.4.7 GreenPower Motor Company
- 6.4.8 Girardin Minibus Inc.
- 6.4.9 Yutong Bus Co. Ltd.
- 6.4.10 Micro Bird Inc.
- 6.4.11 Proterra Inc.
- 6.4.12 Zhengzhou Yutong Bus Co. Ltd.
- 6.4.13 Zhongtong Bus Holding Co. Ltd.
- 6.4.14 FAW Bus and Coach Co. Ltd.
- 6.4.15 Tata Motors Ltd.
- 6.4.16 Ashok Leyland Ltd.
- 6.4.17 Alexander Dennis Ltd.
- 6.4.18 NFI Group Inc.
- 6.4.19 Dongfeng Motor Corporation
- 6.4.20 Mahindra & Mahindra Ltd.
- 6.4.21 JCBL Limited
7 Market Opportunities & Future Outlook
- 7.1 White-space & Unmet-need Assessment

 美國校車:市場佔有率分析、行業趨勢和統計數據以及成長預測(2026-2031 年)
 校車市場規模、佔有率、成長、全球產業分析、區域趨勢及2026年至2034年預測全球校車市場,2025-2035年全球校車市場規模、佔有率、趨勢和成長分析報告(2026-2034年)
 2026年全球校車市場報告
 小型校車市場 - 全球產業規模、佔有率、趨勢、機會、預測:按動力方式、等級、地區和競爭格局分類,2021-2031年
 校車市場規模、佔有率和成長分析(按動力類型、等級、應用、座位數、驅動系統、安全特性和地區分類)-2026-2033年產業預測Frost Radar:北美校車製造商,2025 年
 全球中型校車市場
 2025-2029 年全球校車市場