


 |
市場調查報告書
商品編碼
2124631
流量計:市場佔有率分析、產業趨勢與統計、成長預測(2026-2031)Flow Meters - Market Share Analysis, Industry Trends & Statistics, Growth Forecasts (2026 - 2031) |
||||||

※ 本網頁內容可能與最新版本有所差異。詳細情況請與我們聯繫。
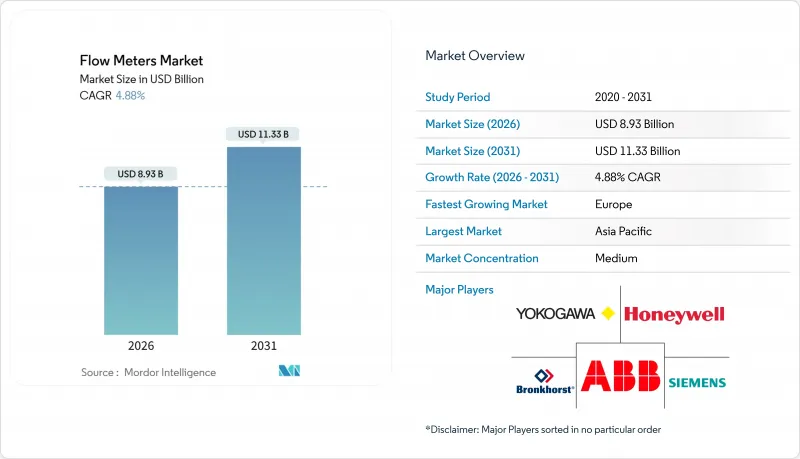
據 Mordor Intelligence 稱,2026 年流量計市值為 89.3 億美元,預計到 2031 年將達到 113.3 億美元。
這意味著在預測期內複合年成長率為 4.88%。
本報告按技術(容積式、品質式)、安裝方式(直列式、夾裝式、插入式)、流體類型(液體、氣體、蒸氣)、終端用戶行業(石油天然氣、水和用水和污水、化工、電力、食品飲料、製藥)以及地區(北美、南美、歐洲、亞太、中東和非洲)進行細分。市場預測以美元計價。
全球流量計市場趨勢與洞察
物聯網賦能的流程自動化實現即時流量分析
在工業領域,流量計正升級為邊緣運算節點,每個設備以一秒的間隔提供資料流。例如,橫河馬達的OpreX平台可以分析漂移和空化現象,並自動調節控制閥,以將設定值維持在±0.5%以內。在製藥業,連續生產線也利用類似的回饋迴路,以確保符合美國食品藥物管理局(FDA)的製程分析技術指南。西門子宣布,其超音波流量計內建的預測分析功能,到2025年可將化工廠的非計畫停機時間減少22%。即時視覺化功能還可以與企業軟體整合;一家歐洲飲料製造商將電磁流量計與SAP S/4HANA整合,從而減少了14%的原料損失。
對全球水務和污水處理基礎設施的投資
由於漏損,供水事業損失了25%至40%的處理水,因此他們正用電池供電的超音波和電磁水錶取代機械水錶。中國已累計1,500億元人民幣(約210億美元),計畫在2025年於100個城市實現供水管網數位化。在印度,推行預付式水錶的「飲用水生命線計畫」(Jal Jeevan Mission)使齋浦爾的無收益水費在短短18個月內從42%降至28%。在美國,根據《兩黨基礎設施法案》,550億美元正被撥款用於部署能夠按小時收集數據的先進計量系統。一家歐洲顧問公司估計,透過智慧水錶消除未被發現的水損,每年可節省80億歐元。
先進的科氏流量計和超音波流量計需要大量的資金投入。
科氏水錶的購置價格是電磁式或渦流式水錶的三到十倍,這導致融資不佳的供水事業推遲更換。一台4吋的科氏水錶售價在12,000美元到18,000美元之間,而同等尺寸的電磁式水錶售價僅為2,500美元到4,000美元。由於需要特殊的安裝、減震和零點調整程序,安裝成本還會增加3,000美元到5,000美元。雖然從生命週期成本的角度來看,價格較高的水錶具有優勢,但採購團隊通常更關注初始成本。為了將資本支出轉化為營運成本並加快部署速度,基於訂閱的「水錶即服務」模式正在興起。
細分市場分析
預計到2025年,基於品質的檢測法將達到26億美元,複合年成長率(CAGR)為7.4%。流量計市場受益於氫氣摻混和二氧化碳捕集與儲存(CCS)過程中對不受密度變化影響的直接質量測量的需求。科氏流量計已成為液化二氧化碳交易量測量的標準選擇,挪威的北極光CCS計畫就是一個典型的例子。此專案在100巴壓力下運作,不確定度為±0.05%。超音波流量計正在天然氣供應領域取代渦輪流量計,因為即使氫氣體積比達到20%,超音波流量計也能維持±1.5%的精確度。
在城市供水管網中,以電磁流量計為支撐的容積式流量計技術預計將在2025年佔據28.9%的市場。差壓式孔板流量計(需要直徑10-20毫米的直管)在蒸氣管中仍然很常見。熱式容積式流量計在沼氣和壓縮空氣迴路中正迅速普及,因為在這些迴路中,低流量會降低渦輪流量計的性能。容積式流量計繼續應用於燃料加註和高黏度液體的批量處理。渦式流量計是電廠蒸氣的中等流量、低維護成本選擇。這些趨勢共同凸顯了流量計產業正在發生結構性轉變,朝著高精度、自我診斷設備的方向發展,這些設備能夠與數位孿生軟體無縫整合。
到2025年,管道內嵌式硬體將佔銷售額的48.2%,但其成長率僅為4.2%,因為在現有設施(棕地)中切割管道會導致停機損失。相較之下,夾裝式解決方案的成長率高達5.9%,且無需洩壓即可安裝。一家北美中游業者使用夾裝式超音波測量設備在八週內維修了120根管道,與管道內嵌式方案相比,成本降低了62%。插入式探頭無需更換管道部件,直接插入管道內,在大口徑供水幹管領域也找到了市場需求。
電池技術的創新已將現場使用壽命延長至10-15年,使流量計能夠作為無線物聯網節點運作。安全完整性等級2(SIL 2)的功能安全認證已將目標市場擴展至核能發電廠和製藥廠。然而,在交易量測量點,精度為±0.1%的線上流量計仍佔主導地位。目前,流量計市場不僅按機械結構細分,還按公差細分,最終用戶在選擇時會綜合考慮成本、精度和避免停機時間等因素。
區域分析
預計到2025年,亞太地區將佔全球銷售額的38.9%,這主要得益於中國1,500億元人民幣的智慧水務舉措和印度強制實施的洩漏檢測。日本正在化工和電子工廠中應用邊緣運算分析技術,而韓國則在其不斷擴建的半導體工廠中部署熱質量感測器。澳洲的大規模氫氣試點管道項目和馬來西亞不斷擴大的液化天然氣出口也為市場成長做出了貢獻。
歐洲預計將以5.3%的複合年成長率推動成長。德國的氫氣摻混法規正促使數百萬個電錶改用超音波技術,而丹麥的區域供熱網路正在安裝量熱計以符合歐盟的能源效率法規。英國將漏水率降低50%的目標也推動了智慧電錶的購買。此外,挪威的二氧化碳捕集與儲存(CCS)計畫和法國的加氫站正在加速對用於貿易交接計量的科氏流量計的需求。
北美市場呈現4.6%的成長率,主要得益於美國對水利基礎設施的550億美元投資以及中游石油公司對計量表的現代化改造。在中東,海水淡化領域正投入巨資,電磁計量表也被用來監測供水和濃縮液。在南美,巴西公共產業的私有化使得智慧水錶的資金籌措成為可能,從而改善了市場前景。同時,非洲不同地區也取得了進展,例如南非預付式安裝預付費水錶,以及奈及利亞試點部署大流量水錶。這些區域性項目共同支撐著全球流量計市場的廣泛基礎。
其他好處:
- Excel格式的市場預測(ME)表
- 3個月的分析師支持
目錄
第1章:引言
- 研究假設和市場定義
- 調查範圍
第2章:調查方法
第3章執行摘要
第4章 市場狀況
- 市場概覽
- 市場促進因素
- 物聯網賦能的流程自動化實現即時流量分析
- 全球對水和污水基礎設施的投資
- 能源領域安全和準確性的合規要求
- 現有設備(棕地)電池供電夾式改造的需求
- CCUS專案中多相流測量的需求
- 區域供熱製冷系統智慧電錶的引入
- 市場限制因素
- 先進的科氏流量計和超音波流量計需要高額的資金投入。
- 熟練的校對和維護人員短缺
- 無線智慧電錶的網路安全漏洞
- 超音波換能器用供不應求
- 產業價值鏈分析
- 監理情勢
- 技術展望
- 宏觀經濟因素的影響
- 波特五力分析
第5章 市場規模與成長預測
- 透過技術
- 體積公式
- 壓力差
- 電磁學
- 超音波
- 渦輪
- 正位移
- 渦流
- 品質公式
- 科里奧利
- 熱品質
- 體積公式
- 透過安裝方法
- 排隊
- 夾式/外置式安裝
- 插入
- 按流體類型
- 液體
- 氣體
- 蒸氣
- 按最終用戶行業分類
- 石油和天然氣
- 水和污水處理
- 化工/石油化工
- 發電
- 食品/飲料
- 紙漿和造紙
- 製藥和生物技術
- 金屬和採礦
- 其他終端用戶產業
- 按地區
- 北美洲
- 美國
- 加拿大
- 墨西哥
- 南美洲
- 巴西
- 阿根廷
- 其他南美國家
- 歐洲
- 德國
- 英國
- 法國
- 義大利
- 西班牙
- 其他歐洲國家
- 亞太地區
- 中國
- 印度
- 日本
- 韓國
- 澳洲和紐西蘭
- 其他亞太國家
- 中東
- 沙烏地阿拉伯
- 阿拉伯聯合大公國
- 土耳其
- 其他中東國家
- 非洲
- 南非
- 奈及利亞
- 埃及
- 其他非洲國家
- 北美洲
第6章 競爭情勢
- 市場集中度
- 策略趨勢
- 市佔率分析
- 公司簡介
- Azbil Corporation
- Badger Meter Inc.
- Bronkhorst High-Tech BV
- Brooks Instrument(ITW)
- Christian Burkert GmbH and Co. KG
- Danfoss A/S
- Dwyer Instruments LLC
- Emerson Electric Co.
- Endress+Hauser AG
- Honeywell International Inc.
- Keyence Corporation
- KROHNE Messtechnik GmbH
- Schneider Electric SE
- Sensirion AG
- Siemens AG
- SICK AG
- TSI Incorporated
- Yokogawa Electric Corporation
- ABB Ltd
第7章 市場機會與未來展望
According to Mordor Intelligence, the flow meters market size is valued at USD 8.93 billion in 2026 and is projected to reach USD 11.33 billion by 2031, reflecting a 4.88% CAGR over the forecast period.
This report is Segmented by Technology (Volumetric, and Mass), Mounting (In-Line, Clamp-On, and Insertion), Fluid Type (Liquid, Gas, and Steam), End-User Industry (Oil and Gas, Water and Wastewater, Chemicals, Power, Food and Beverage, and Pharmaceuticals), and Geography (North America, South America, Europe, Asia-Pacific, Middle East, Africa). Market Forecasts are Provided in Value (USD).
Global Flow Meters Market Trends and Insights
IoT-Enabled Process Automation For Real-Time Flow Analytics
Industrial sites are upgrading meters so that each device becomes an edge-computing node delivering one-second interval data streams. Platforms such as Yokogawa OpreX analyze drift and cavitation, then automatically adjust control valves to maintain +-0.5% set-points. Pharmaceutical continuous-manufacturing lines rely on the same feedback loops to stay within U.S. Food and Drug Administration process analytical technology guidelines. Siemens disclosed that predictive analytics embedded in its ultrasonic meters cut unscheduled chemical-plant downtime by 22% in 2025. Real-time visibility also links with enterprise software; a European beverage producer tied electromagnetic meters to SAP S/4HANA and trimmed raw-material waste by 14%.
Global Water And Wastewater Infrastructure Investments
Utilities losing 25% to 40% of treated water to leaks are replacing mechanical meters with battery-powered ultrasonic and electromagnetic alternatives. China earmarked CNY 150 billion (USD 21 billion) in 2025 to digitize networks across 100 cities. India's Jal Jeevan Mission introduced prepaid meters that lowered non-revenue water from 42% to 28% in Jaipur within 18 months. In the United States, USD 55 billion from the Bipartisan Infrastructure Law channels funding toward hourly-data advanced metering installations. European consulting estimates show potential recovery of EUR 8 billion annually if smart meters eliminate undetected losses.
High CAPEX Of Advanced Coriolis And Ultrasonic Meters
Acquisition prices run three to ten times higher than electromagnetic or vortex alternatives, prompting cash-constrained utilities to delay upgrades. A 4-inch Coriolis meter can cost USD 12,000-18,000, compared with USD 2,500-4,000 for an electromagnetic counterpart. Specialized mounting, vibration-isolation, and zeroing steps add another USD 3,000-5,000 to commissioning. Lifecycle economics favor premium meters, but procurement teams often concentrate on upfront budgets. Subscription-based meter-as-a-service offerings are emerging to convert capital expense into operating expense and accelerate adoption.
Other drivers and restraints analyzed in the detailed report include:
- Energy-Sector Safety And Accuracy Compliance Mandates
- Brownfield Demand For Battery-Powered Clamp-On Retrofits
- Cyber-Security Exposure Of Wireless Smart Meters
For complete list of drivers and restraints, kindly check the Table Of Contents.
Segment Analysis
Mass-based methods accounted for USD 2.6 billion in 2025 and are advancing at a 7.4% CAGR. The flow meters market benefits as hydrogen blending and carbon-capture sequestration demand direct mass measurement immune to density shifts. Coriolis meters have become the default choice for liquefied CO2 custody transfer, illustrated by the Northern Lights CCS project in Norway, which operates at 100 bar with +-0.05% uncertainty. Ultrasonic designs are displacing turbines in gas distribution because they keep +-1.5% accuracy when hydrogen reaches 20% of volume.
Volumetric technologies still hold 28.9% of 2025 revenue, anchored by electromagnetic meters in municipal water networks. Differential-pressure orifice plates remain common in steam lines, though they require 10-20 diameters of straight pipe. Thermal mass sensors are flourishing in biogas and compressed-air loops, where low flow rates compromise turbine performance. Positive-displacement units persist in fuel-dispensing and viscous-liquid batching. Vortex meters offer a mid-price, low-maintenance option for power-plant steam. Collectively, these trends underscore a structural rotation inside the flow meters industry toward high-accuracy, self-diagnosing devices that integrate seamlessly with digital-twin software.
In-line hardware represented 48.2% of 2025 revenue but is growing at a slower 4.2% pace because brownfield sites face downtime penalties if pipes are cut. Clamp-on variants, by contrast, are expanding at 5.9% and permit installation without depressurization. A North American midstream operator retrofitted 120 lines in eight weeks using clamp-on ultrasonic devices at 62% lower cost than in-line alternatives. Insertion probes, which penetrate but do not replace pipe sections, are finding niches in large-diameter water mains.
Battery innovations extend field life to 10-15 years, letting meters act as wireless IoT nodes. Functional-safety certification for Safety Integrity Level 2 has widened the addressable market to nuclear and pharmaceutical plants. Still, custody-transfer points continue to rely on in-line meters that deliver +-0.1% certainty. The flow meters market now segments by tolerance as much as by mechanics, with end users balancing cost, accuracy and downtime avoidance.
Complete Report Scope:
- By Technology
- Volumetric
- Differential Pressure
- Electromagnetic
- Ultrasonic
- Turbine
- Positive Displacement
- Vortex
- Mass
- Coriolis
- Thermal Mass
- Volumetric
- By Mounting/Installation
- In-Line
- Clamp-On/External
- Insertion
- By Fluid Type
- Liquid
- Gas
- Steam
- By End-User Industry
- Oil and Gas
- Water and Wastewater
- Chemical and Petrochemical
- Power Generation
- Food and Beverage
- Pulp and Paper
- Pharmaceuticals and Biotechnology
- Metals and Mining
- Other End-User Industries
- By Geography
- North America
- United States
- Canada
- Mexico
- South America
- Brazil
- Argentina
- Rest of South America
- Europe
- Germany
- United Kingdom
- France
- Italy
- Spain
- Rest of Europe
- Asia-Pacific
- China
- India
- Japan
- South Korea
- Australia and New Zealand
- Rest of Asia-Pacific
- Middle East
- Saudi Arabia
- United Arab Emirates
- Turkey
- Rest of Middle East
- Africa
- South Africa
- Nigeria
- Egypt
- Rest of Africa
- North America
Geography Analysis
Asia-Pacific accounted for 38.9% of 2025 revenue, powered by China's CNY 150 billion smart-water initiative and India's leak-detection mandates. Japan leverages edge-computing analytics in chemical and electronics plants, while South Korea fits thermal mass sensors in expanding semiconductor fabs. Growth also reflects large-scale hydrogen pilot pipelines in Australia and LNG export expansion in Malaysia.
Europe is forecast to lead growth at a 5.3% CAGR. Germany's hydrogen-blend rule moves millions of meters to ultrasonic technology, Denmark's district-heating networks install heat meters to comply with European Union energy-efficiency regulations, and the United Kingdom pursues a 50% leakage-reduction goal that stimulates smart-meter procurement. Additionally, Norway's CCS projects and France's hydrogen stations accelerate demand for custody-transfer Coriolis devices.
North America grows at 4.6% as the United States directs USD 55 billion to water infrastructure and midstream oil operators modernize custody meters. The Middle East invests heavily in desalination, using electromagnetic devices to monitor feedwater and brine. South America's prospects improve after Brazilian utility privatizations unlock smart-meter funding, while Africa shows selective progress with prepaid municipal installations in South Africa and pilot bulk-supply meters in Nigeria. Collectively, these regional programs underpin a broad global baseline for the flow meters market.
- Azbil Corporation
- Badger Meter Inc.
- Bronkhorst High-Tech BV
- Brooks Instrument (ITW)
- Christian Burkert GmbH and Co. KG
- Danfoss A/S
- Dwyer Instruments LLC
- Emerson Electric Co.
- Endress+Hauser AG
- Honeywell International Inc.
- Keyence Corporation
- KROHNE Messtechnik GmbH
- Schneider Electric SE
- Sensirion AG
- Siemens AG
- SICK AG
- TSI Incorporated
- Yokogawa Electric Corporation
- ABB Ltd
Additional Benefits:
- The market estimate (ME) sheet in Excel format
- 3 months of analyst support
TABLE OF CONTENTS
1 INTRODUCTION
- 1.1 Study Assumptions and Market Definition
- 1.2 Scope of the Study
2 RESEARCH METHODOLOGY
3 EXECUTIVE SUMMARY
4 MARKET LANDSCAPE
- 4.1 Market Overview
- 4.2 Market Drivers
- 4.2.1 IoT-enabled Process Automation for Real-Time Flow Analytics
- 4.2.2 Global Water and Wastewater Infrastructure Investments
- 4.2.3 Energy-Sector Safety and Accuracy Compliance Mandates
- 4.2.4 Brownfield Demand for Battery-Powered Clamp-On Retrofits
- 4.2.5 Multiphase-Flow Metering Needs in CCUS Projects
- 4.2.6 District Heating/Cooling Smart-Meter Roll-Outs
- 4.3 Market Restraints
- 4.3.1 High CAPEX of Advanced Coriolis and Ultrasonic Meters
- 4.3.2 Skilled-Calibration and Maintenance Talent Shortage
- 4.3.3 Cyber-Security Exposure of Wireless Smart Meters
- 4.3.4 Semiconductor Shortages for Ultrasonic Transducers
- 4.4 Industry Value Chain Analysis
- 4.5 Regulatory Landscape
- 4.6 Technological Outlook
- 4.7 Impact of Macroeconomic Factors
- 4.8 Porter's Five Forces Analysis
- 4.8.1 Threat of New Entrants
- 4.8.2 Bargaining Power of Suppliers
- 4.8.3 Bargaining Power of Buyers
- 4.8.4 Threat of Substitutes
- 4.8.5 Competitive Rivalry
5 MARKET SIZE AND GROWTH FORECASTS (VALUE)
- 5.1 By Technology
- 5.1.1 Volumetric
- 5.1.1.1 Differential Pressure
- 5.1.1.2 Electromagnetic
- 5.1.1.3 Ultrasonic
- 5.1.1.4 Turbine
- 5.1.1.5 Positive Displacement
- 5.1.1.6 Vortex
- 5.1.2 Mass
- 5.1.2.1 Coriolis
- 5.1.2.2 Thermal Mass
- 5.1.1 Volumetric
- 5.2 By Mounting/Installation
- 5.2.1 In-Line
- 5.2.2 Clamp-On/External
- 5.2.3 Insertion
- 5.3 By Fluid Type
- 5.3.1 Liquid
- 5.3.2 Gas
- 5.3.3 Steam
- 5.4 By End-User Industry
- 5.4.1 Oil and Gas
- 5.4.2 Water and Wastewater
- 5.4.3 Chemical and Petrochemical
- 5.4.4 Power Generation
- 5.4.5 Food and Beverage
- 5.4.6 Pulp and Paper
- 5.4.7 Pharmaceuticals and Biotechnology
- 5.4.8 Metals and Mining
- 5.4.9 Other End-User Industries
- 5.5 By Geography
- 5.5.1 North America
- 5.5.1.1 United States
- 5.5.1.2 Canada
- 5.5.1.3 Mexico
- 5.5.2 South America
- 5.5.2.1 Brazil
- 5.5.2.2 Argentina
- 5.5.2.3 Rest of South America
- 5.5.3 Europe
- 5.5.3.1 Germany
- 5.5.3.2 United Kingdom
- 5.5.3.3 France
- 5.5.3.4 Italy
- 5.5.3.5 Spain
- 5.5.3.6 Rest of Europe
- 5.5.4 Asia-Pacific
- 5.5.4.1 China
- 5.5.4.2 India
- 5.5.4.3 Japan
- 5.5.4.4 South Korea
- 5.5.4.5 Australia and New Zealand
- 5.5.4.6 Rest of Asia-Pacific
- 5.5.5 Middle East
- 5.5.5.1 Saudi Arabia
- 5.5.5.2 United Arab Emirates
- 5.5.5.3 Turkey
- 5.5.5.4 Rest of Middle East
- 5.5.6 Africa
- 5.5.6.1 South Africa
- 5.5.6.2 Nigeria
- 5.5.6.3 Egypt
- 5.5.6.4 Rest of Africa
- 5.5.1 North America
6 COMPETITIVE LANDSCAPE
- 6.1 Market Concentration
- 6.2 Strategic Moves
- 6.3 Market Share Analysis
- 6.4 Company Profiles (includes Global level Overview, Market level overview, Core Segments, Financials as available, Strategic Information, Market Rank/Share for key companies, Products and Services, and Recent Developments)
- 6.4.1 Azbil Corporation
- 6.4.2 Badger Meter Inc.
- 6.4.3 Bronkhorst High-Tech BV
- 6.4.4 Brooks Instrument (ITW)
- 6.4.5 Christian Burkert GmbH and Co. KG
- 6.4.6 Danfoss A/S
- 6.4.7 Dwyer Instruments LLC
- 6.4.8 Emerson Electric Co.
- 6.4.9 Endress+Hauser AG
- 6.4.10 Honeywell International Inc.
- 6.4.11 Keyence Corporation
- 6.4.12 KROHNE Messtechnik GmbH
- 6.4.13 Schneider Electric SE
- 6.4.14 Sensirion AG
- 6.4.15 Siemens AG
- 6.4.16 SICK AG
- 6.4.17 TSI Incorporated
- 6.4.18 Yokogawa Electric Corporation
- 6.4.19 ABB Ltd
7 MARKET OPPORTUNITIES AND FUTURE OUTLOOK
- 7.1 White-Space and Unmet-Need Assessment

 流量計市場:依產品類型、測量方法、被測物質、最終用途產業和地區分類。
 2026年全球壓縮空氣流量計市場報告
 全球流量計市場規模、佔有率、趨勢和成長分析報告(2026-2034年)
 嵌入式流量計市場規模、佔有率和成長分析:按流量計類型、安裝方式、應用、最終用戶、輸出類型和地區分類-2026-2033年產業預測
 氮氣流量計市場規模、佔有率和成長分析:按產品類型、顯示類型、應用、最終用戶、便攜性和地區分類-2026-2033年產業預測
 流式黏度計市場規模、佔有率和成長分析:按流式黏度計規格、材料、應用、最終用戶、測量範圍和地區分類-產業預測,2026-2033年
 流量計市場-2026-2032年全球市場預測
 燃油流量計:市場佔有率分析、產業趨勢與統計、成長預測(2026-2031)
 槳輪式流量計市場 - 全球產業規模、佔有率、趨勢、機會、預測:按流體類型、機構、銷售管道、應用、地區和競爭格局分類,2021-2031年
 液體流量計- 全球市佔率與排名,2026-2032年總銷售額和需求預測