


 |
市場調查報告書
商品編碼
2124544
歐洲火力發電市場:市場佔有率分析、產業趨勢與統計、成長預測(2026-2031年)Europe Thermal Power - Market Share Analysis, Industry Trends & Statistics, Growth Forecasts (2026 - 2031) |
||||||

※ 本網頁內容可能與最新版本有所差異。詳細情況請與我們聯繫。
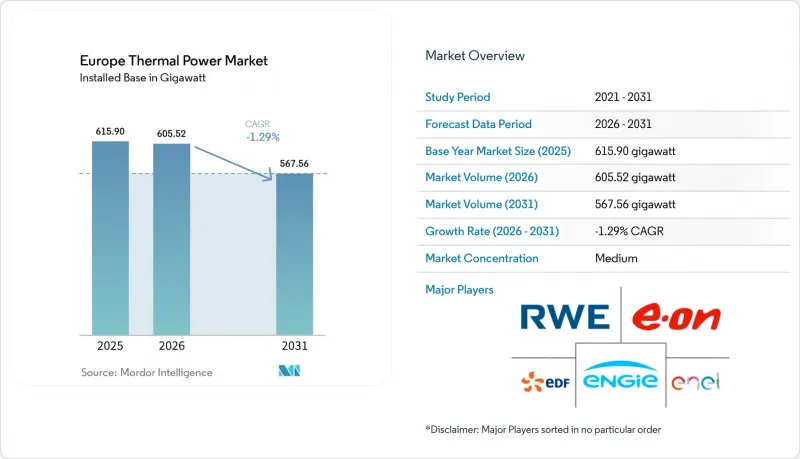
據 Mordor Intelligence 稱,歐洲火力發電市場規模(按裝置容量計算)預計將從 2025 年的 615.90 吉瓦縮減至 2026 年的 605.52 吉瓦,到 2031 年將進一步下降至 567.56 吉瓦,2026 年吉瓦,2026 年至 203% -2031 年的複合成長率 -203%。
本報告按燃料類型(煤炭、天然氣、石油、核能及其他)、技術(蒸氣渦輪、燃氣聯合循環機組、內燃機、熱電聯產機組及其他)、發電量(小於100兆瓦、100-500兆瓦、500-1000兆瓦及大於1000兆瓦)、應用領域(公用事業規模、工業自用、分散式和調峰電廠)以及地區(英國、德國、法國、俄羅斯及其他歐洲國家)進行細分。市場預測以容量(吉瓦)為單位。
歐洲火力發電市場的趨勢與洞察
以燃氣渦輪機聯合循環發電廠(CCGT)取代老舊的燃煤發電廠。
燃煤發電廠的退役正在加速歐洲火力發電市場對高效能取代能源發電能力的需求。根據歐洲輸電系統營運商協會(ENTSO-E)的報告,2024-2025-2026年冬季,硬煤和褐煤發電能力減少了12吉瓦,而天然氣發電能力增加了4吉瓦。 2026年1月,德國與歐盟委員會就一項框架協議達成協議,計畫在2031年運作12吉瓦可控且與氫能相容的發電能力。該計劃將有利於已併網的開發商,因為現有設施的替換項目比新建項目進展更快。 2025年11月,GE Vernova公司從Enea集團獲得訂單,將在科傑尼采(Kozienice)安裝兩台9HA.01型聯合循環發電機組。蒸氣渦輪將在波蘭埃爾布隆格(Elblog)製造。本地化設備生產不僅縮短了採購時間,也支持了波蘭從煤炭轉型為天然氣這一工業目標。
資料中心和電氣化導致電力需求增加。
資料中心需求的不斷成長提升了歐洲火力發電市場已承諾容量的價值。根據歐洲輸電系統營運商協會 (ENTSO-E) 的預測,到 2030 年,歐洲資料中心的電力消耗量預計將超過 134 太瓦時 (TWh),高於 2024 年的 87 太瓦時。即使在可再生能源發電量較低的情況下,需要 99.999%運轉率的設施也需要可靠的電力供應。在這種情況下,燃氣發電廠可以提供調節電力並支持電網穩定。都柏林、阿姆斯特丹、倫敦和法蘭克福等城市的負載集中度給區域輸電網路帶來了壓力,因此靠近需求中心的發電容量顯得格外重要。位於資料中心集群附近的分散式汽電共生設施和調峰電廠或許能夠獲得直接電力契約,從而減少對歐洲火電市場批發供需調整模式的依賴。
歐盟排放權交易體系(EU ETS)碳價格上漲
歐盟不斷上漲的碳價正在增加歐洲火力發電市場石化燃料發電廠的營運成本。根據歐洲證券及市場管理局(ESMA)的報告,歐盟排放權價格在2025年平均為每噸二氧化碳當量74歐元,並在2026年1月達到每噸90歐元。修訂後的歐盟排放交易體系(EU ETS)的目標是到2030年將目標排放量比2005年水準降低62%。燃煤發電廠由於排放強度較高,承擔最大的成本負擔。燃氣電廠的碳排放量較低,但如果電價無法抵銷燃料成本和排放權成本,其利潤率可能會下降。一些運轉率較低的老舊開式循環發電機組可能被迫提前關閉,而無需正式的退役指令。
細分市場分析
2025年,以能源類型分類,天然氣將佔51.9%的市場佔有率,預計到2031年將以1.1%的複合年成長率成長。這一地位反映了德國、波蘭、希臘和烏克蘭新建天然氣發電設施的增加,儘管整體裝置容量有所下降。煤炭因退役政策和碳排放成本導致其經濟效益下降,持續呈現結構性衰退。德國和波蘭仍然擁有大規模燃煤發電廠,但未來的發電容量規劃將越來越依賴替代能源。核能發電在更廣泛的火力發電分類中仍然佔據重要地位,因為它利用蒸氣循環進行發電。石油和地熱發電雖然在該地區總發電容量中所佔比例較小,但在偏遠電網和工業區發揮著尤為重要的作用。
俄羅斯擁有相當可觀的天然氣發電裝置容量,這使得天然氣在俄羅斯的能源結構中扮演著與西歐截然不同的角色。俄羅斯天然氣工業股份公司(Gazprom)及其子公司莫斯科能源公司(Mosenergo)聲稱,該公司擁有大規模的電力和熱力供給能力能力。在俄羅斯,天然氣仍然是穩定電力和熱力供應的主要來源。在歐盟許多地區,隨著可變可再生能源發電裝置容量的擴張,天然氣的使用量也不斷增加,以確保能源供應的柔軟性。這種差異導致歐洲熱電市場既包含以基本負載為導向的天然氣發電廠,也包含高度柔軟性的天然氣發電廠,後者能夠根據可再生能源的發電量波動進行調整。因此,儘管天然氣仍是核心燃料,但其運作模式導致各國的發電結構差異巨大。
截至2025年,聯合循環燃氣發電(CCGT)將佔據33.2%的市場佔有率,成為成長最快的技術。預計到2031年,歐洲CCGT熱電市場將以2.6%的複合年成長率成長。聯合循環電廠比傳統的蒸氣循環電廠效率更高,也更符合氫能相容的設計要求。蒸氣渦輪電廠的裝機大規模,尤其是在燃煤電廠和老舊中央電廠集中的地區。內燃機(ICE)電廠適用於分散式發電和獨立電網應用,在這些應用中,小規模和模組化安裝至關重要。汽電共生(CHP)系統在斯堪的斯堪地那維亞、波羅的海國家和中歐的工業設施和區域供熱網路中繼續發揮重要作用。
德國新的可控發電容量框架正在推動對氫能聯合循環燃氣渦輪機(CCGT)的投資。 Uniper公司於2026年4月獲得初步批准,將在Tau)建造一座890兆瓦的氫能機組。 Larissa Thermoelectric公司於2026年8月選擇AVAX公司,在希臘建造一座採用三菱電力技術、裝置容量為794兆瓦的CCGT計畫。 DTEK公司也正與GE Vernova公司合作,推動位於伯斯廷(Burstin)的一座650兆瓦CCGT計畫。這些項目表明,歐洲熱電產業正將其發展重點從傳統的蒸氣技術轉向聯合循環發電設備。
其他好處:
- Excel格式的市場預測(ME)表
- 3個月的分析師支持
目錄
第1章:引言
- 研究假設和市場定義
- 調查範圍
第2章:調查方法
第3章執行摘要
第4章 市場狀況
- 市場概覽
- 市場促進因素
- 以聯合循環燃氣渦輪機(CCGT)取代老舊的燃煤發電廠。
- 資料中心和電氣化導致電力需求增加。
- 政府支持天然氣「過渡」供給能力
- 豐富的液化天然氣和天然氣進口基礎設施
- 小型模組化高溫核子反應爐器許可證核准熱潮
- 將燃煤電廠升級為生質電廠,以滿足容量市場支付要求。
- 市場限制因素
- 歐盟排放交易體系(EU ETS)下碳價格飆漲
- 太陽能和風能的平準化度電成本快速下降
- 對簡易爆炸裝置大氣排放物施加更嚴格的限制
- 沿海地區冷卻水短缺和授權障礙
- 供應鏈分析
- 監理政策前景
- 技術展望
- 波特五力分析
- PESTLE分析
- 投資分析
- 全球地緣政治緊張局勢對市場的影響
第5章 市場規模與成長預測
- 按資訊來源類型分類
- 煤炭
- 天然氣
- 油
- 核能
- 其他(地熱能等)
- 透過技術
- 蒸氣渦輪發電廠
- 聯合循環燃氣渦輪機(CCGT)
- 內燃機(ICE)發電廠
- 熱電汽電共生/熱電聯產(CHP)電廠
- 其他(CSP、開式循環等)
- 按產能
- 小於100兆瓦
- 100~500 MW
- 500~1000 MW
- 1000兆瓦或以上
- 透過使用
- 大型火力發電廠
- 工業私營發電廠
- 分散式火力發電廠
- 尖峰發電廠
- 按地區
- 英國
- 德國
- 法國
- 俄羅斯
- 其他歐洲國家
第6章 競爭情勢
- 市場集中度
- 策略趨勢
- 市佔率分析
- 主要國際公司的企業簡介
- Engie SA
- Electricite de France SA
- Enel SpA
- RWE AG
- E.ON SE
- Rosatom State Atomic Energy Corp.
- Siemens Energy AG
- Iberdrola SA
- Endesa SA
- Uniper SE
- Vattenfall AB
- Fortum Oyj
- CEZ Group
- Verbund AG
- PGE Polska Grupa Energetyczna
- SSE plc
- Statkraft AS
- Drax Group plc
- Orsted A/S
- Gazprom Energoholding
第7章 市場機會與未來展望
According to Mordor Intelligence, the Europe thermal power market size in terms of installed base is expected to decrease from 615.90 gigawatt in 2025 to 605.52 gigawatt in 2026 and decline to 567.56 gigawatt by 2031, declining at a CAGR of -1.29% over 2026-2031.
This report is Segmented by Source Type (Coal, Natural Gas, Oil, Nuclear, Others), Technology (Steam Turbine, CCGT, ICE, CHP, Others), Capacity (Below 100 MW, 100-500 MW, 500-1000 MW, Above 1000 MW), Application (Utility-Scale, Industrial Captive, Distributed, Peaker Plants), and Geography (United Kingdom, Germany, France, Russia, Rest of Europe). The Market Forecasts are Provided in Terms of Volume (GW).
Europe Thermal Power Market Trends and Insights
Ageing Coal Fleet Replacement with CCGT
Coal retirement plans are accelerating demand for efficient replacement capacity in the Europe thermal power market. ENTSO-E reported that hard coal and lignite capacity fell by 12 GW between 2024 and the winter of 2025-2026, while gas capacity rose by 4 GW. Germany agreed a framework with the European Commission in January 2026 for 12 GW of controllable, hydrogen-ready capacity that is intended to operate by 2031. The program gives developers with existing grid connections an advantage because replacement projects can move faster than new sites. GE Vernova received an order from Enea Group in November 2025 for two 9HA.01 combined-cycle blocks at Kozienice, with steam turbines to be made in Elblag, Poland. Local equipment production can shorten procurement timelines and support national industrial objectives during coal-to-gas replacement.
Rising Electricity Demand from Data Centers and Electrification
Data center demand is increasing the value of firm capacity in the Europe thermal power market. ENTSO-E expects European data center electricity consumption to exceed 134 TWh by 2030, compared with 87 TWh in 2024. Facilities requiring 99.999% uptime need a dependable electricity supply when renewable output is low. Gas-fired generation can provide balancing power and support grid stability in these conditions. Load concentration in Dublin, Amsterdam, London, and Frankfurt adds pressure to regional networks and favors capacity close to demand centers. Distributed CHP units and peaking plants near data campuses may secure direct power contracts that are less dependent on wholesale dispatch patterns in the Europe thermal power market.
Escalating EU ETS Carbon Prices
EU carbon prices are raising operating costs for fossil-fired plants in the Europe thermal power market. ESMA reported that EU allowance prices averaged EUR 74 per tonne of carbon dioxide equivalent in 2025 and reached EUR 90 per tonne in January 2026. The revised EU ETS targets a 62% reduction in covered emissions by 2030 from 2005 levels. The cost burden is greatest for coal plants because of their higher emissions intensity. Gas plants emit less carbon, but their margins can also weaken when electricity prices do not offset fuel and allowance costs. Older open-cycle units with low utilization may face earlier closure without a formal retirement order in the Europe thermal power market.
Other drivers and restraints analyzed in the detailed report include:
- Government Backing for Natural-Gas Bridge Capacity
- Abundant New LNG/Gas Import Infrastructure
- Rapid Fall in Solar and Wind Power LCOE
For complete list of drivers and restraints, kindly check the Table Of Contents.
Segment Analysis
Natural gas held 51.9% of the market share by source type in 2025 and is forecast to grow at a 1.1% CAGR through 2031. Its position reflects new gas additions in Germany, Poland, Greece, and Ukraine, even as the overall installed base declines. Coal remains in structural decline as retirement policies and carbon costs weaken its economics. Germany and Poland continue to have major coal fleets, but their future capacity plans rely increasingly on replacement generation. Nuclear power remains relevant within the broader thermal classification because it uses a steam cycle for electricity generation. Oil and geothermal capacity represent a smaller part of the regional fleet and are most relevant in island systems and remote industrial locations.
Russia anchors a large share of gas-fired capacity and gives the source type a different role than in Western Europe. Gazprom states that its generation assets include large electric and thermal capacity through subsidiaries such as Mosenergo. In Russia, gas remains a major source of regular power and heat supply. In much of the EU, gas is increasingly used for flexibility as variable renewable capacity grows. This difference means that the Europe thermal power market contains both baseload-oriented gas fleets and flexible gas plants that operate around renewable output. The result is a source mix in which natural gas remains the core fuel, but its operating patterns vary substantially by country.
CCGT held 33.2% of the market share in 2025 and is the fastest-growing technology, with the Europe thermal power market size for CCGT forecast to expand at a 2.6% CAGR through 2031. Combined-cycle plants offer higher efficiency than older steam-cycle units and are better suited to hydrogen-ready design requirements. Steam turbine plants remain a large installed base, especially where coal generation and older central power stations are concentrated. ICE plants serve distributed generation and island-grid applications where smaller scale and modular installation are important. CHP systems remain relevant in industrial facilities and district heating networks across Scandinavia, the Baltics, and Central Europe.
Germany's framework for new controllable capacity supports hydrogen-ready CCGT investment. Uniper received preliminary approval in April 2026 for an 890 MW hydrogen-ready unit at Staudinger. Larissa Thermoelectric selected AVAX in August 2026 for a 794 MW CCGT project in Greece that will use Mitsubishi Power technology. DTEK is advancing a 650 MW CCGT project at Burshtyn with GE Vernova. DTEK. These projects show that the Europe thermal power industry is directing development activity toward combined-cycle capacity rather than legacy steam technology.
Complete Report Scope:
- By Source Type
- Coal
- Natural Gas
- Oil
- Nuclear
- Others (geothermal, etc.)
- By Technology
- Steam turbine Power Plant
- Combined Cycle Gas Turbine (CCGT)
- Internal Combustion Engine (ICE) Power Plants
- Cogeneration / Combined Heat and Power (CHP) Plants
- Others (CSP, Open Cycle, etc.)
- By Capacity
- Below 100 MW
- 100-500 MW
- 500-1000 MW
- Above 1000 MW
- By Application
- Utility-Scale Thermal Plants
- Industrial Captive Power Plants
- Distributed Thermal Plants
- Peaker Plants
- By Geography
- United Kingdom
- Germany
- France
- Russia
- Rest of Europe
List of Companies Covered in this Report:
- Engie SA
- Electricite de France SA
- Enel S.p.A.
- RWE AG
- E.ON SE
- Rosatom State Atomic Energy Corp.
- Siemens Energy AG
- Iberdrola SA
- Endesa SA
- Uniper SE
- Vattenfall AB
- Fortum Oyj
- CEZ Group
- Verbund AG
- PGE Polska Grupa Energetyczna
- SSE plc
- Statkraft AS
- Drax Group plc
- Orsted A/S
- Gazprom Energoholding
Additional Benefits:
- The market estimate (ME) sheet in Excel format
- 3 months of analyst support
TABLE OF CONTENTS
1 INTRODUCTION
- 1.1 Study Assumptions and Market Definition
- 1.2 Scope of the Study
2 RESEARCH METHODOLOGY
3 EXECUTIVE SUMMARY
4 MARKET LANDSCAPE
- 4.1 Market Overview
- 4.2 Market Drivers
- 4.2.1 Ageing coal fleet replacement with CCGT
- 4.2.2 Rising electricity demand from data centres & electrification
- 4.2.3 Government backing for natural-gas 'bridge' capacity
- 4.2.4 Abundant new LNG/gas import infrastructure
- 4.2.5 Licensing wave of small modular high-temperature reactors
- 4.2.6 Coal-to-biomass repowering for capacity-market payments
- 4.3 Market Restraints
- 4.3.1 Escalating EU ETS carbon prices
- 4.3.2 Rapid fall in solar- & wind-power LCOE
- 4.3.3 Stricter IED air-emission ceilings
- 4.3.4 Cooling-water scarcity & coastal permitting hurdles
- 4.4 Supply-Chain Analysis
- 4.5 Regulatory Policy Outlook
- 4.6 Technological Outlook
- 4.7 Porter's Five Forces Analysis
- 4.7.1 Threat of New Entrants
- 4.7.2 Bargaining Power of Buyers
- 4.7.3 Bargaining Power of Suppliers
- 4.7.4 Threat of Substitutes
- 4.7.5 Competitive Rivalry
- 4.8 PESTLE Analysis
- 4.9 Investment Analysis
- 4.10 Impacts of Global Geopolitical Tensions on the Market
5 MARKET SIZE AND GROWTH FORECASTS
- 5.1 By Source Type
- 5.1.1 Coal
- 5.1.2 Natural Gas
- 5.1.3 Oil
- 5.1.4 Nuclear
- 5.1.5 Others (geothermal, etc.)
- 5.2 By Technology
- 5.2.1 Steam turbine Power Plant
- 5.2.2 Combined Cycle Gas Turbine (CCGT)
- 5.2.3 Internal Combustion Engine (ICE) Power Plants
- 5.2.4 Cogeneration / Combined Heat and Power (CHP) Plants
- 5.2.5 Others (CSP, Open Cycle, etc.)
- 5.3 By Capacity
- 5.3.1 Below 100 MW
- 5.3.2 100-500 MW
- 5.3.3 500-1000 MW
- 5.3.4 Above 1000 MW
- 5.4 By Application
- 5.4.1 Utility-Scale Thermal Plants
- 5.4.2 Industrial Captive Power Plants
- 5.4.3 Distributed Thermal Plants
- 5.4.4 Peaker Plants
- 5.5 By Geography
- 5.5.1 United Kingdom
- 5.5.2 Germany
- 5.5.3 France
- 5.5.4 Russia
- 5.5.5 Rest of Europe
6 COMPETITIVE LANDSCAPE
- 6.1 Market Concentration
- 6.2 Strategic Moves
- 6.3 Market Share Analysis
- 6.4 Company Profiles of International Majors (Includes Market Level Overview, Core Segments, Financials as available, Strategic Information, Market Rank/Share for key companies, recent trends and developments, etc.)
- 6.4.1 Engie SA
- 6.4.2 Electricite de France SA
- 6.4.3 Enel S.p.A.
- 6.4.4 RWE AG
- 6.4.5 E.ON SE
- 6.4.6 Rosatom State Atomic Energy Corp.
- 6.4.7 Siemens Energy AG
- 6.4.8 Iberdrola SA
- 6.4.9 Endesa SA
- 6.4.10 Uniper SE
- 6.4.11 Vattenfall AB
- 6.4.12 Fortum Oyj
- 6.4.13 CEZ Group
- 6.4.14 Verbund AG
- 6.4.15 PGE Polska Grupa Energetyczna
- 6.4.16 SSE plc
- 6.4.17 Statkraft AS
- 6.4.18 Drax Group plc
- 6.4.19 Orsted A/S
- 6.4.20 Gazprom Energoholding
7 MARKET OPPORTUNITIES AND FUTURE OUTLOOK
- 7.1 White-Space and Unmet-Need Assessment

