


 |
市場調查報告書
商品編碼
2124508
通訊營運管理:市場佔有率分析、產業趨勢與統計、成長預測(2026-2031)Telecom Operations Management - Market Share Analysis, Industry Trends & Statistics, Growth Forecasts (2026 - 2031) |
||||||

※ 本網頁內容可能與最新版本有所差異。詳細情況請與我們聯繫。
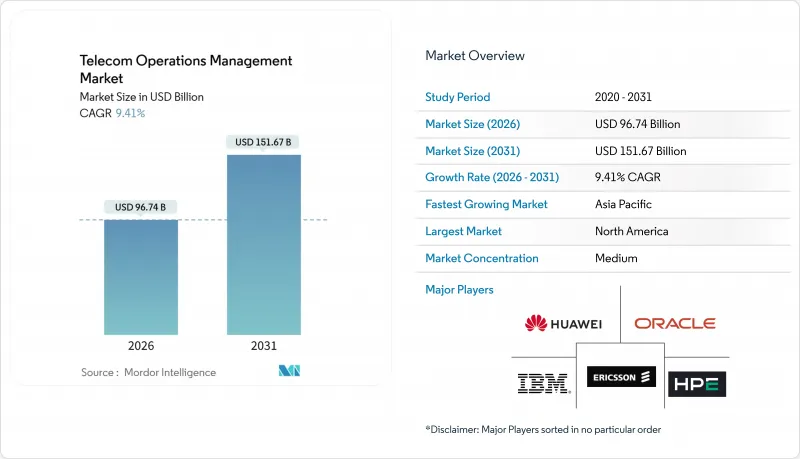
預計到 2026 年,通訊營運管理市場將達到 967.4 億美元,到 2031 年將達到 1,516.7 億美元,複合年成長率為 9.41%。
本報告按部署類型(本地部署、雲端部署)、解決方案類型(軟體、服務)、運營商類型(行動網路營運商、固網營運商、行動虛擬網路營運商 (MVNO) 和行動虛擬網路工程師 (MVNE)、OTT 和數位服務供應商商、最終用戶產業(電信服務供應商、IT 和科技業、政府機構、銀行、金融服務和數位服務供應商)、最終用戶產業(電信服務供應商、IT 和科技業、政府機構、銀行、金融服務及產業市場預測以美元 (USD) 為單位。
全球通訊營運管理市場趨勢與洞察
雲端原生OSS/BSS平台的快速普及
電信業者透過基於 Kubernetes 的技術堆疊提升了系統韌性,資本支出最多可降低 40%,服務推出更快,即使在流量高峰期也能實現 99.999% 的可用性。因此,儘管維護雙堆疊系統會增加短期營運成本 (OPEX),但各大業者仍撥出預算,將傳統的收費系統「遷移」到容器叢集。供應商生態系統提供承包收費、策略和風險敞口功能,簡化了邊緣應用的部署。這一趨勢正在形成良性循環:早期採用者展現了成本節約優勢,並鼓勵後續營運商採用類似的架構。然而,技能人才的持續短缺迫使許多業者依賴託管服務合約來完成遷移。
5G獨立組網部署正在推動網路自動化的投資。
獨立核心網路支援網路切片和超低延遲、超高可靠性 (URLLC) 功能,但只有自動化編配才能大規模管理這些功能。中國行動利用自動化平台,可在 10 分鐘內完成網路切片部署,並將工作流程縮短 90%。美國的新部署案例顯示,與運行傳統 OSS 協定堆疊的現有營運商相比,整體擁有成本 (TCO) 最多可降低 50%。標準組織預測,到 2027 年,獨立連線數將達到 12 億,預計 18% 至 22% 的基礎設施預算將用於軟體自動化。印度和中東的電信營運商很早就採用了自動化技術,以克服頻段複雜性並確保工業應用場景中的延遲。這些應用,加上隨著無線網路部署而不斷成長的軟體支出,正在重振整個通訊營運管理市場。
高效系統整合商短缺
精通大型主機 COBOL 和容器編排管理的架構師需求遠超供應,導致頂級顧問公司需要等待 18 個月甚至更久才能招募到合適的人才。拉丁美洲和東南亞的電信業者通常依賴缺乏本地監管專業知識的離岸團隊,這使得專案工期延長了 40% 到 60%。隨著大型 IT 公司優先考慮通訊業以外利潤更高的雲端遷移項目,資源短缺問題進一步加劇。儘管供應商正在透過提供藍圖和低程式碼配置器來實現快速部署,但複雜的資料映射仍然需要整合商。在人才短缺問題解決之前,電信營運管理市場將面臨營運瓶頸,其成長也將受到阻礙。
細分市場分析
到2025年,雲端採用率將佔通訊營運管理市場佔有率的66.89%,預計到2031年,隨著支出以9.89%的複合年成長率成長,這一佔有率還將繼續成長。將非關鍵性工作負載託管在公共雲端上,可實現彈性擴展和「按需收費」的經濟模式,使電信業者能夠在不佔用大量資金的情況下試行新服務。混合架構滿足了資料必須保留在本地的市場中的合規性要求,透過將本地收費系統與雲端託管分析整合,實現了資料主權和敏捷性。由於專用硬體老化和供應商支援減少導致整體擁有成本 (TCO) 上升,分配給本地系統的通訊營運管理市場規模持續萎縮。然而,由於回程傳輸線路不可靠以及無法確保雲端可用性,撒哈拉以南非洲和拉丁美洲的一些區域電信業者仍然傾向於使用本地部署。新參與企業已經證明,完全遷移到公共雲端可以降低 50% 的生命週期成本,這促使監管機構放寬限制並加快更廣泛的採用。
向雲端遷移的勢頭也影響著採購模式。電信業者要求供應商提供基於訂閱的授權、持續交付和開放API,以不可續約的SaaS協議取代長達十年的企業合約。超大規模資料中心業者服務商透過捆綁基礎設施額度和遷移服務來縮短價值實現時間。同時,對於處理高度敏感用戶資料或受銀行級嚴格安全法規約束的一級營運商而言,建置私有雲端仍然是至關重要的選擇。這種模式的多樣性確保了混合解決方案即使在雲端運算佔據主導地位的情況下,仍能在通訊營運管理市場中保持相當大的佔有率。
軟體仍將是收入支柱,預計到2025年將佔據59.11%的市場佔有率,但隨著多供應商環境日益複雜,服務板塊的複合年成長率(CAGR)更高,達到9.84%。系統整合目前佔業務收益的四分之一以上,因為微服務架構需要跨越數十個容器叢集編配。缺乏DevOps專業知識的二線和三線營運商對託管服務合約的需求旺盛,從而將風險和人員管理的負擔轉移給了供應商。這一趨勢正在擴大通訊營運管理市場規模,該市場主要面向與既定服務等級協定(SLA)掛鉤的訂閱式服務包。此外,隨著營運商探索5G獨立網路和API市場的商業化方案,諮詢服務的需求也不斷成長。
在軟體領域,網路管理套件仍然佔據主導地位,但即時收費解決方案是成長最快的細分市場。電信業者需要對基於網路切片的連接和邊緣運算工作負載按交易收費,為了應對2028年使用量激增的情況,系統升級工作正在進行中。客戶和產品管理模組正在進行改造,以支援連接、內容和雲端的動態商品搭售,這凸顯了客戶體驗優先事項如何重塑後勤部門工具。這些變化共同鞏固了服務作為成長驅動力的地位,而軟體則繼續在通訊營運管理市場中發揮基礎性作用。
區域分析
到2025年,北美將佔全球支出的36.73%,這主要得益於三大營運商在OSS/BSS現代化方面投入的150億美元,以及有線電視營運商為升級到DOCSIS 4.0而進行的同步投資。隨著法律規範允許用戶資料託管在營運商設施之外(前提是加密和稽核管理符合聯邦準則),公共雲端的採用率正在不斷提高。 Dish Networks的新平台展示了一種可以將總成本降低50%的方案,這鼓勵了現有營運商與超大規模資料中心業者雲端服務供應商協商雲端信用額度。此外,與營運主機直接協作以保護網路免受供應鏈風險影響的自動化威脅偵測模組也得到了越來越廣泛的應用。
在歐洲,由於各成員國對《數位市場法案》和《網路與資訊安全指令2》的合規要求各不相同,合規工作也存在差異。大型跨國集團在2024年至2025年間投資100億歐元(113億美元),用於建立跨區域的雲端原生核心網路,同時遵守區域資料居住要求。儘管存在監管摩擦,但這仍然擴大了電信營運管理市場。英國脫歐後的監管差異迫使在英國和歐洲大陸運營的電信營運商應對雙重合規挑戰,增加了專案成本。俄羅斯嚴格的在地化法律限制了公共雲端的市場佔有率,而本地部署市場仍保持著相當大的規模。
亞太地區以10.44%的複合年成長率領先。中國電信業者營運超過360萬個5G基地台,並透過配置自動化大幅降低傳輸成本,以超過其他任何地區的速度拓展電信營運管理市場。印度領先的電信業者已投資80億美元用於現代化改造,為全國範圍內的5G部署做準備。與此同時,日本和韓國的成熟電信業者正在試行人工智慧輔助駕駛系統,以將事件解決時間縮短一半。在澳大利亞,對偏遠地區固定無線服務的投資正在穩步推進,這表明區域因素如何影響架構選擇。在中東,受「2030願景」和國家數位化計畫的推動,專用網路的自動化正在加速發展。同時,由於缺乏整合商,非洲的進展仍然謹慎,但突破性的雲端原生BSS合約預示著未來的成長潛力。在南美洲,由於優先發展 4G 覆蓋範圍,成長速度較為緩慢,但預計從 2026 年開始成長,這主要得益於 2024 年巴西舉行的頻率競標。
其他好處:
- Excel格式的市場預測(ME)表
- 3個月的分析師支持
目錄
第1章:引言
- 研究假設和市場定義
- 調查範圍
第2章:調查方法
第3章執行摘要
第4章 市場狀況
- 市場概覽
- 市場促進因素
- 提升客戶體驗的需求日益成長
- 營運成本和複雜性增加
- 雲端原生OSS/BSS平台的快速普及
- 5G獨立組網部署正在推動網路自動化的投資。
- 將人工智慧副駕駛工具整合到網路營運中心
- 通訊 API 的貨幣化正在推動 OSS/BSS 的升級週期。
- 市場限制因素
- 缺乏合格的系統整合商
- 遷移舊有系統需要較高的初始成本。
- 關於多租戶開源軟體 (OSS) SaaS 協議中安全責任的擔憂。
- Open RAN 工具鏈的碎片化正在減緩整合操作的速度。
- 產業價值鏈分析
- 監理情勢
- 技術展望
- 波特五力分析
- 宏觀經濟因素對市場的影響
- 產業應用案例
第5章 市場規模與成長預測
- 不同的發展
- 現場
- 雲
- 公共雲端
- 私有雲端
- 混合雲端
- 按解決方案類型
- 軟體
- 網管
- 客戶和產品管理
- 收益管理
- 庫存管理和其他軟體
- 服務
- 規劃與諮詢
- 運作/維護
- 系統整合
- 託管服務
- 軟體
- 按業務類型分類
- 行動通訊業者
- 固定線路電信業者
- 行動虛擬網路營運商 (MVNO) 和行動虛擬網路工程師 (MVNE)
- OTT和數位服務供應商
- 按最終用途行業分類
- 電信服務供應商
- IT和科技公司
- 政府/公共部門
- 銀行和金融服務
- 製造業和汽車業
- 消費品和零售
- 衛生保健
- 其他終端用戶產業
- 按地區
- 北美洲
- 美國
- 加拿大
- 墨西哥
- 歐洲
- 德國
- 英國
- 法國
- 俄羅斯
- 其他歐洲國家
- 亞太地區
- 中國
- 日本
- 印度
- 韓國
- 澳洲
- 其他亞太國家
- 中東和非洲
- 中東
- 沙烏地阿拉伯
- 阿拉伯聯合大公國
- 其他中東國家
- 非洲
- 南非
- 埃及
- 其他非洲國家
- 中東
- 南美洲
- 巴西
- 阿根廷
- 其他南美國家
- 北美洲
第6章 競爭情勢
- 市場集中度
- 策略趨勢
- 市佔率分析
- 公司簡介
- IBM Corporation
- Telefonaktiebolaget LM Ericsson
- Oracle Corporation
- Hewlett Packard Enterprise Development LP
- Nokia Corporation
- Amdocs Inc.
- Huawei Technologies Co., Ltd.
- Cisco Systems Inc.
- Accenture plc
- SAP SE
- NEC Corporation
- Comarch SA
- ZTE Corporation
- ServiceNow Inc.
- Tata Consultancy Services Limited
- Netcracker Technology Corporation
- CSG Systems International Inc.
- Tech Mahindra Ltd.
- Mavenir Systems Inc.
- Subex Ltd.
- Infosys Ltd.
第7章 市場機會與未來展望
According to Mordor Intelligence, the telecom operations management market size stands at USD 96.74 billion in 2026 and is projected to reach USD 151.67 billion by 2031, advancing at a 9.41% CAGR.
This report is Segmented by Deployment (On-Premise, Cloud), Solution Type (Software, Services), Operator Type (Mobile Network Operators, Fixed-Line Operators, Mvnos and MVNEs, OTT and Digital Service Providers), End-Use Industry (Telecom Service Providers, IT and Technology, Government, BFSI, Manufacturing, Healthcare, Other), and Geography. Market Forecasts are Provided in Terms of Value (USD).
Global Telecom Operations Management Market Trends and Insights
Rapid Adoption of Cloud-Native OSS/BSS Platforms
Operators gaining elasticity from Kubernetes-based stacks cut capital outlays by up to 40%, accelerate service launches, and achieve five-nines availability during traffic spikes. Major carriers, therefore, commit budgets to lift-and-shift legacy billing into container clusters even though dual-stack maintenance inflates short-term opex. Vendor ecosystems provide turnkey charging, policy, and exposure functions that simplify onboarding for edge applications. These moves create a virtuous cycle in which early adopters showcase cost savings, compelling followers to emulate architectures. Ongoing skills shortages, however, force many operators to rely on managed service contracts to complete migrations.
5G Standalone Rollouts Driving Network Automation Spend
Standalone cores unlock slicing and URLLC capabilities that only automated orchestration can manage at scale. China Mobile provisions slices in under 10 minutes using automation platforms, achieving a 90% reduction in workflow. Greenfield U.S. implementations report up to 50% lower total cost of ownership than incumbents running legacy OSS stacks. Standards bodies forecast 1.2 billion standalone connections by 2027, with 18%-22% of infrastructure budgets earmarked for software automation. Operators in India and the Middle East embed automation early to tame spectrum complexity and guarantee latency for industrial use cases. These deployments collectively lift the telecom operations management market as software spend shadow-tracks radio rollouts.
Shortage of Efficient System Integrators
Demand for architects skilled in both mainframe COBOL and container orchestration outstrips supply, pushing wait times for Tier-1 consultancies to more than 18 months. Latin American and Southeast Asian operators often rely on offshore teams that lack local regulatory insight, adding 40%-60% to project timelines. Large IT firms prioritize higher-margin cloud migrations outside telecom, further tightening capacity. Vendors respond by launching rapid-deployment blueprints and low-code configurators, but still need integrators for complex data mapping. Until the talent gap narrows, the telecom operations management market encounters execution bottlenecks that temper growth.
Other drivers and restraints analyzed in the detailed report include:
- Integration of AI Copilot Tools into Network Operations Centers
- Increasing Operational Costs and Complexity
- High Upfront Cost of Migrating Legacy Systems
For complete list of drivers and restraints, kindly check the Table Of Contents.
Segment Analysis
Cloud implementations captured 66.89% of the telecom operations management market share in 2025, and this share is poised to widen as spending grows at a 9.89% CAGR through 2031. Public-cloud hosting of noncritical workloads delivers elastic scaling and pay-as-you-grow economics, letting operators trial new services without capital lock-in. Hybrid architectures address compliance needs in markets where data must remain on soil, blending on-premises billing with cloud-hosted analytics to reconcile sovereignty with agility. The telecom operations management market size allocated to on-premise systems continues to shrink because the total cost of ownership rises when proprietary hardware ages and vendor support winds down. Yet some rural carriers in Sub-Saharan Africa and Latin America still favor on-premise because unreliable backhaul links challenge cloud availability. Greenfield entrants demonstrate that full public-cloud deployments can achieve 50% lower lifetime costs, prompting regulators to ease restrictions and accelerate broader adoption.
Momentum toward cloud also shapes procurement patterns. Operators demand subscription licensing, continuous delivery, and open-API exposure from vendors, replacing decade-long enterprise contracts with evergreen SaaS agreements. Hyperscalers bundle infrastructure credits with migration services, compressing time-to-value. Meanwhile, private-cloud builds remain relevant for Tier-1 carriers handling highly sensitive subscriber data or operating under stringent banking-grade security rules. These divergent models ensure that, as cloud rules, hybrid options maintain a sizeable share of the telecom operations management market.
Software remained the revenue backbone with a 59.11% share in 2025, but escalating multi-vendor complexity is propelling services to a faster 9.84% CAGR. Systems integration now accounts for more than one-quarter of service revenue because microservice architectures require orchestration across dozens of container clusters. Managed-service contracts flourish among Tier-2 and Tier-3 players lacking DevOps expertise, shifting risk and staffing overhead to vendors. This trend increases the size of the telecom operations management market allocated to subscription-style service bundles tied to defined service-level agreements. Consulting demand also rises as carriers seek blueprints for monetizing 5G standalone and API marketplaces.
In software, network management suites still dominate, yet real-time charging solutions are the fastest-growing subsegment. Operators need per-transaction accounting for slice-based connectivity and edge compute workloads, driving upgrades ahead of 2028 volume inflection points. Customer and product management modules undergo a makeover to support dynamic bundling of connectivity, content, and cloud, underscoring how consumer experience priorities reshape back-office tooling. Collectively, these shifts cement services as the growth engine while software remains the foundational layer that anchors the telecom operations management market.
Complete Report Scope:
- By Deployment
- On-premise
- Cloud
- Public Cloud
- Private Cloud
- Hybrid Cloud
- By Solution Type
- Software
- Network Management
- Customer and Product Management
- Revenue Management
- Inventory Management and Other Software
- Services
- Planning and Consulting
- Operations and Maintenance
- System Integration
- Managed Services
- Software
- By Operator Type
- Mobile Network Operators
- Fixed-line Operators
- MVNOs and MVNEs
- OTT and Digital Service Providers
- By End-Use Industry
- Telecom Service Providers
- IT and Technology Enterprises
- Government and Public Sector
- Banking and Financial Services
- Manufacturing and Automotive
- Consumer Goods and Retail
- Healthcare
- Other End-Use Industries
- By Geography
- North America
- United States
- Canada
- Mexico
- Europe
- Germany
- United Kingdom
- France
- Russia
- Rest of Europe
- Asia-Pacific
- China
- Japan
- India
- South Korea
- Australia
- Rest of Asia-Pacific
- Middle East and Africa
- Middle East
- Saudi Arabia
- United Arab Emirates
- Rest of Middle East
- Africa
- South Africa
- Egypt
- Rest of Africa
- Middle East
- South America
- Brazil
- Argentina
- Rest of South America
- North America
Geography Analysis
North America retained 36.73% of spending in 2025, underpinned by USD 15 billion in OSS/BSS modernization across the three largest carriers and parallel investments by cable operators upgrading to DOCSIS 4.0. Public-cloud deployments proliferate because regulatory frameworks permit hosting subscriber data outside carrier premises, provided encryption and audit controls meet federal guidelines. Dish Network's greenfield platform validated 50% lower total cost scenarios, encouraging incumbents to negotiate cloud credits with hyperscalers. Securing networks against supply-chain risks also drives uptake of automated threat-detection modules that integrate directly with operations consoles.
Europe follows a patchwork path because the Digital Markets Act and the Network and Information Security Directive 2 impose divergent compliance burdens across member states. Major multi-country groups invested EUR 10 billion (USD 11.3 billion) in 2024-2025 to create pan-regional cloud-native cores that still respect local data residency, nudging the telecom operations management market size higher despite regulatory friction. Post-Brexit divergence forces dual compliance tracks for operators straddling the United Kingdom and continental Europe, inflating project overhead. Russia's strict localization laws keep public cloud share low, sustaining a residual on-premises segment.
Asia Pacific delivers the fastest CAGR of 10.44%. Chinese carriers operate more than 3.6 million 5G base stations and are automating provisioning to slash transport costs, expanding the telecom operations management market faster than any other territory. India's leading operators invested USD 8 billion in modernization ahead of nationwide 5G rollouts, while Japanese and South Korean incumbents pilot AI copilots to halve incident resolution times. Australia channels spending toward fixed-wireless services in remote areas, illustrating how geography dictates architecture choices. Middle East commitments tied to Vision 2030 and national digitization agendas accelerate private-network automation, whereas Africa advances cautiously amid integrator shortages, though landmark cloud-native BSS deals signal future growth. South America moderates due to 4G coverage priorities, yet Brazil's 2024 spectrum auctions set the stage for upticks from 2026 onward.
- IBM Corporation
- Telefonaktiebolaget LM Ericsson
- Oracle Corporation
- Hewlett Packard Enterprise Development LP
- Nokia Corporation
- Amdocs Inc.
- Huawei Technologies Co., Ltd.
- Cisco Systems Inc.
- Accenture plc
- SAP SE
- NEC Corporation
- Comarch SA
- ZTE Corporation
- ServiceNow Inc.
- Tata Consultancy Services Limited
- Netcracker Technology Corporation
- CSG Systems International Inc.
- Tech Mahindra Ltd.
- Mavenir Systems Inc.
- Subex Ltd.
- Infosys Ltd.
Additional Benefits:
- The market estimate (ME) sheet in Excel format
- 3 months of analyst support
TABLE OF CONTENTS
1 INTRODUCTION
- 1.1 Study Assumptions and Market Definition
- 1.2 Scope of the Study
2 RESEARCH METHODOLOGY
3 EXECUTIVE SUMMARY
4 MARKET LANDSCAPE
- 4.1 Market Overview
- 4.2 Market Drivers
- 4.2.1 Rising Demand for Enhanced Customer Experience
- 4.2.2 Increasing Operational Costs and Complexity
- 4.2.3 Rapid Adoption of Cloud-Native OSS/BSS Platforms
- 4.2.4 5G Standalone Rollouts Driving Network Automation Spend
- 4.2.5 Integration of AI Copilot Tools into Network Operations Centers
- 4.2.6 Telecom API Monetization Push Creating OSS/BSS Upgrade Cycles
- 4.3 Market Restraints
- 4.3.1 Shortage of Efficient System Integrators
- 4.3.2 High Upfront Cost of Migrating Legacy Systems
- 4.3.3 Security Liability Concerns in Multi-Tenant OSS SaaS Contracts
- 4.3.4 Fragmentation of Open RAN Toolchains Slowing Integrated Operations
- 4.4 Industry Value Chain Analysis
- 4.5 Regulatory Landscape
- 4.6 Technological Outlook
- 4.7 Porter's Five Forces Analysis
- 4.7.1 Bargaining Power of Suppliers
- 4.7.2 Bargaining Power of Consumers
- 4.7.3 Threat of New Entrants
- 4.7.4 Intensity of Competitive Rivalry
- 4.7.5 Threat of Substitute Products
- 4.8 Impact of Macroeconomic Factors on the Market
- 4.9 Industry Use Cases
5 MARKET SIZE AND GROWTH FORECASTS (VALUE)
- 5.1 By Deployment
- 5.1.1 On-premise
- 5.1.2 Cloud
- 5.1.2.1 Public Cloud
- 5.1.2.2 Private Cloud
- 5.1.2.3 Hybrid Cloud
- 5.2 By Solution Type
- 5.2.1 Software
- 5.2.1.1 Network Management
- 5.2.1.2 Customer and Product Management
- 5.2.1.3 Revenue Management
- 5.2.1.4 Inventory Management and Other Software
- 5.2.2 Services
- 5.2.2.1 Planning and Consulting
- 5.2.2.2 Operations and Maintenance
- 5.2.2.3 System Integration
- 5.2.2.4 Managed Services
- 5.2.1 Software
- 5.3 By Operator Type
- 5.3.1 Mobile Network Operators
- 5.3.2 Fixed-line Operators
- 5.3.3 MVNOs and MVNEs
- 5.3.4 OTT and Digital Service Providers
- 5.4 By End-Use Industry
- 5.4.1 Telecom Service Providers
- 5.4.2 IT and Technology Enterprises
- 5.4.3 Government and Public Sector
- 5.4.4 Banking and Financial Services
- 5.4.5 Manufacturing and Automotive
- 5.4.6 Consumer Goods and Retail
- 5.4.7 Healthcare
- 5.4.8 Other End-Use Industries
- 5.5 By Geography
- 5.5.1 North America
- 5.5.1.1 United States
- 5.5.1.2 Canada
- 5.5.1.3 Mexico
- 5.5.2 Europe
- 5.5.2.1 Germany
- 5.5.2.2 United Kingdom
- 5.5.2.3 France
- 5.5.2.4 Russia
- 5.5.2.5 Rest of Europe
- 5.5.3 Asia-Pacific
- 5.5.3.1 China
- 5.5.3.2 Japan
- 5.5.3.3 India
- 5.5.3.4 South Korea
- 5.5.3.5 Australia
- 5.5.3.6 Rest of Asia-Pacific
- 5.5.4 Middle East and Africa
- 5.5.4.1 Middle East
- 5.5.4.1.1 Saudi Arabia
- 5.5.4.1.2 United Arab Emirates
- 5.5.4.1.3 Rest of Middle East
- 5.5.4.2 Africa
- 5.5.4.2.1 South Africa
- 5.5.4.2.2 Egypt
- 5.5.4.2.3 Rest of Africa
- 5.5.4.1 Middle East
- 5.5.5 South America
- 5.5.5.1 Brazil
- 5.5.5.2 Argentina
- 5.5.5.3 Rest of South America
- 5.5.1 North America
6 COMPETITIVE LANDSCAPE
- 6.1 Market Concentration
- 6.2 Strategic Moves
- 6.3 Market Share Analysis
- 6.4 Company Profiles {(includes Global level Overview, Market level overview, Core Segments, Financials as available, Strategic Information, Market Rank/Share for key companies, Products and Services, and Recent Developments)}
- 6.4.1 IBM Corporation
- 6.4.2 Telefonaktiebolaget LM Ericsson
- 6.4.3 Oracle Corporation
- 6.4.4 Hewlett Packard Enterprise Development LP
- 6.4.5 Nokia Corporation
- 6.4.6 Amdocs Inc.
- 6.4.7 Huawei Technologies Co., Ltd.
- 6.4.8 Cisco Systems Inc.
- 6.4.9 Accenture plc
- 6.4.10 SAP SE
- 6.4.11 NEC Corporation
- 6.4.12 Comarch SA
- 6.4.13 ZTE Corporation
- 6.4.14 ServiceNow Inc.
- 6.4.15 Tata Consultancy Services Limited
- 6.4.16 Netcracker Technology Corporation
- 6.4.17 CSG Systems International Inc.
- 6.4.18 Tech Mahindra Ltd.
- 6.4.19 Mavenir Systems Inc.
- 6.4.20 Subex Ltd.
- 6.4.21 Infosys Ltd.
7 MARKET OPPORTUNITIES AND FUTURE OUTLOOK
- 7.1 White-Space and Unmet-Need Assessment

 2026-2030年全球通訊營運管理市場
 通訊營運管理市場-2026-2032年全球市場預測
 通訊營運管理市場規模、佔有率、趨勢和預測:按軟體類型、服務、部署模式和地區分類,2026-2034 年
 通訊營運管理市場:按類型、部署方式、軟體和地區分類
 2026年全球電信營運管理市場報告
 通訊營運管理市場規模、佔有率和成長分析(按解決方案類型、部署方法、服務類型和地區):產業預測(2025-2032 年)
 電信營運管理市場 - 全球產業規模、佔有率、趨勢、機會和預測,按解決方案類型、服務類型、垂直產業、地區和競爭細分,2020-2030 年預測