


 |
市場調查報告書
商品編碼
2124502
媒體流:市場佔有率分析、產業趨勢與統計、成長預測(2026-2031)Media Streaming - Market Share Analysis, Industry Trends & Statistics, Growth Forecasts (2026 - 2031) |
||||||

※ 本網頁內容可能與最新版本有所差異。詳細情況請與我們聯繫。
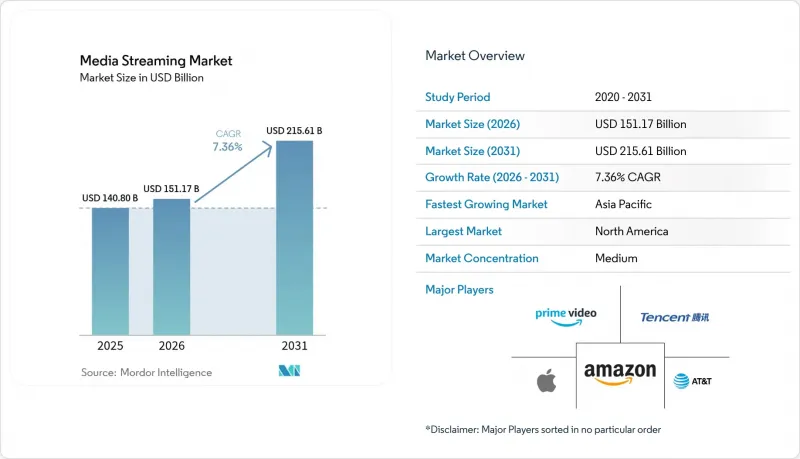
2025 年媒體串流市場價值 1,408 億美元,預計到 2031 年將達到 2,156.1 億美元,而 2026 年為 1,511.7 億美元,預測期(2026-2031 年)複合年成長率為 7.36%。
本報告按內容類型(影片串流媒體、音樂串流)、服務類型(直播、點播)、收入模式(訂閱、廣告)、串流媒體品質(標清、高清、4K/超高清、8K)和地區進行細分。市場預測以美元計價。
全球媒體流市場趨勢與洞察
低成本5G資料方案在亞太地區的普及
經濟實惠的 5G 網路部署徹底改變了消費模式,使用戶能夠透過行動連線流暢觀看高清和 4K 串流內容。隨著影片流量的成長,營運商正在補貼資料方案,從而實現其在高階網路投資的利潤。這形成了一個良性循環,既推動了基礎設施的擴展,也促進了內容的互動。更靠近用戶的邊緣節點進一步降低了延遲,並實現了個人化內容推薦的即時更新。因此,媒體串流市場正在經歷持續成長,尤其是在對價格敏感的新興經濟體中。
將SVOD平台擴展到北美和歐洲的二、三線城市
隨著主要大都會圈的市場趨於飽和,大型服務供應商正將目光轉向區域性城市,這些城市的發行成本因光纖部署和本地寬頻基礎設施的改善而降低。雖然本地製作預算與全球大片相比較為有限,但文化適應性強的劇集正在吸引先前服務不足的觀眾群體,並贏得更高的忠誠度。先進的建議演算法能夠考慮方言和觀看時間,在不增加內容支出的情況下維持用戶參與度,從而為串流媒體市場創造額外收入。
內容授權成本不斷上漲,給利潤率帶來了壓力。
Netflix計劃在2025年投資180億美元,這一事實凸顯了通貨膨脹的惡性循環,即使是規模領先的行業巨頭,其盈利也正面臨巨大壓力。對加值內容庫的激烈競標正在削弱差異化優勢,因為競爭對手只能將部分成本轉嫁給用戶。雖然內容共用協議或許能夠暫時緩解資金外流,但它們正在削弱用戶獲取的基礎——獨家內容,並威脅整個串流媒體市場的經濟生存能力。
細分市場分析
預計到2025年,影片服務仍將佔據77.35%的收入主導地位。這反映了用戶已養成的觀看習慣以及對獨家劇集的大量投入,而獨家劇集對於用戶留存至關重要。同時,音樂服務正以8.82%的複合年成長率快速成長,這得益於檔案體積小巧,即使在頻寬有限的網路上也能實現穩定的串流播放。隨著人工智慧驅動的播放清單提升了用戶的每日收聽頻率,以及廣告空間的擴大,音訊領域的媒體串流市場規模也不斷擴大。
音樂平台製作成本較低,且具有跨國吸引力,因此能夠迅速實現全球用戶群的盈利,而影片串流平台則面臨著製作長篇內容的預算不斷增加的困境。這種成本失衡正在推動跨格式捆綁銷售,預示著未來音訊和影片服務可能會整合到單一應用程式中,以保護市場佔有率。
儘管預計到2025年點播內容庫將佔總收入的86.76%,但直播9.44%的複合年成長率表明,人們對即時體驗的需求日益成長。體育賽事和熱門真人秀節目正在創造廣告商青睞的「必看」內容,從而推動每次直播的收入高於點播的平均水平。
技術複雜性增強了競爭優勢。邊緣運算和客製化協定能夠應對流量高峰,確保延遲低於2秒的心理閾值。掌握這些技術的平台在媒體串流市場高峰期擁有更有利的地位,可以進一步擴大其市場佔有率。
區域分析
北美地區在2025年佔總營收的34.48%,但該市場正步入成熟階段,營運商的策略重心也從獲取新用戶轉向提升用戶終身價值。正如Verizon的融合策略所示,將光纖和行動合約商品搭售,既能鎖定用戶群體,又能提高每用戶平均收入(ARPU),而無需投入巨額行銷成本。雖然體育賽事轉播權的競爭推高了節目製作成本,但成熟的廣告市場支撐了混合套餐的盈利。
亞太地區預計將以8.97%的複合年成長率成長,這得益於政府對本地內容製作的鼓勵以及5G網路覆蓋範圍的擴大。 Netflix在該地區推出具有文化特色的原創內容後,收視率激增20%,這表明本土故事能夠激發用戶的高度參與。各國政府正在為內容創作者提供資金支持(印度的十億美元舉措就是一個典型的例子),這不僅豐富了新鮮內容庫,也重振了串流媒體市場。然而,不同的一般資料保護規則本地化法規迫使基礎設施並行發展,提高了小型品牌的進入門檻。在歐洲,由於GDPR合規帶來的營運成本增加以及語言市場的片段化,成長並不均衡。 Netflix與TF1的合作等分銷協議體現了一種混合模式,串流媒體提供商和傳統廣播公司攜手合作,以滿足監管機構和觀眾的需求。拉丁美洲光纖普及率的不斷提高(巴西為77.2%,智利為70.9%)正推動高清串流媒體的使用量成長,進而創造新的收入來源。在非洲,行動端仍然佔據主導地位,針對低頻寬進行最佳化以及提供豐富的可下載內容對於刺激潛在需求至關重要。
其他好處:
- Excel格式的市場預測(ME)表
- 3個月的分析師支持
目錄
第1章:引言
- 研究假設和市場定義
- 調查範圍
第2章:調查方法
第3章執行摘要
第4章 市場狀況
- 市場概覽
- 市場促進因素
- 低成本5G資料方案在亞太地區的普及
- 將SVOD平台擴展到北美和歐洲的二、三線城市
- 爭奪獨家體育賽事轉播權的競爭推高了付費內容的價格。
- 整合雲端原生CDN和邊緣運算,實現超低延遲直播
- FAST(廣告支援型免費電視)頻道的興起正在擴大廣告空間。
- 將通訊和媒體服務捆綁在一起可以提高用戶留存率。
- 市場限制因素
- 內容授權成本不斷上漲,給利潤率帶來了壓力。
- 版權管理的片段化阻礙了全球發行計畫的推進。
- 新興市場仍存在「最後一公里」延誤問題。
- 加強對資料隱私和在地化的監管
- 監理展望
- 波特五力分析
第5章 市場規模與成長預測
- 按內容類型
- 影片串流
- 音樂串流媒體
- 按服務類型
- 直播
- 點播串流媒體
- 按收入模式
- 訂閱(SVOD/AVOD/混合模式)
- 廣告(AVOD/FAST)
- 視訊品質決定串流媒體質量
- SD
- HD
- 4K/UHD
- 8K
- 按地區
- 北美洲
- 美國
- 加拿大
- 墨西哥
- 南美洲
- 巴西
- 阿根廷
- 墨西哥
- 其他南美國家
- 歐洲
- 德國
- 英國
- 法國
- 義大利
- 西班牙
- 其他歐洲國家
- 亞太地區
- 中國
- 日本
- 韓國
- 印度
- 澳洲
- 紐西蘭
- 其他亞太國家
- 中東
- 阿拉伯聯合大公國
- 沙烏地阿拉伯
- 其他中東和非洲國家
- 非洲
- 南非
- 其他非洲國家
- 北美洲
第6章 競爭情勢
- Strategic Developments
- Vendor Positioning Analysis
- 公司簡介
- Netflix Inc.
- Spotify Technology SA
- Apple Inc.(Apple TV+, Apple Music)
- Amazon.com Inc.(Prime Video, Amazon Music)
- Alphabet Inc.(YouTube, YouTube Music)
- Tencent Holdings Ltd.(Tencent Video, QQ Music)
- The Walt Disney Company(Disney+, ESPN+)
- AT&T Inc.(Max/HBO, DirecTV Stream)
- Comcast Corp.(Peacock, NOW TV)
- Roku Inc.
- Deezer SA
- Baidu Inc.(iQIYI, Qian Qian Music)
- British Broadcasting Corporation(BBC iPlayer)
- Hulu LLC
- Pandora Media LLC
- ViacomCBS Inc.(Paramount+)
- Sony Group Corp.(Crunchyroll, Sony LIV)
- Naspers Ltd.(Showmax)
- FuboTV Inc.
- DAZN Group Ltd.
第7章 市場機會與未來展望
According to Mordor Intelligence, the media streaming market size was valued at USD 140.80 billion in 2025 and estimated to grow from USD 151.17 billion in 2026 to reach USD 215.61 billion by 2031, at a CAGR of 7.36% during the forecast period (2026-2031).
This report is Segmented by Content Type (Video Streaming, Music Streaming), Service Type (Live Streaming, On-Demand Streaming), Revenue Model (Subscription, Advertising), Streaming Quality (SD, HD, 4K/UHD, 8K), and Geography. The Market Forecasts are Provided in Terms of Value (USD).
Global Media Streaming Market Trends and Insights
Proliferation of Low-Cost 5G Data Plans Across Asia-Pacific
Deployment of affordable 5G networks has reshaped consumption patterns by supporting uninterrupted HD and 4K streams on mobile connections. Operators subsidize data packages because elevated video traffic monetizes premium network investments, creating a feedback loop that spurs both infrastructure build-out and content engagement. Edge nodes positioned close to viewers further trim latency, enabling personalized recommendations to refresh in real time. The result is sustained growth for the media streaming market in price-sensitive emerging economies.
SVOD Platform Expansion into Tier-II/III Cities in North America and Europe
Having saturated major metropolitan areas, leading services are targeting secondary cities where fiber rollout and improved rural broadband have lowered delivery cost. Localized production budgets are modest relative to global tent-pole titles, yet culturally tailored series drive higher loyalty among underserved audiences. Sophisticated recommendation algorithms that account for regional dialects and viewing times maintain engagement without raising content outlays, adding incremental revenue to the media streaming market.
Escalating Content-Licensing Costs Compressing Margins
Netflix's USD 18 billion outlay in 2025 underscores an inflationary spiral that squeezes profitability even for scale leaders. Fierce bidding for premium libraries diminishes differentiation because rival services can only pass a portion of costs to subscribers. Sharing agreements reduce immediate cash burn but blunt exclusivity advantages that underpin subscriber acquisition, challenging overall economics of the media streaming market.
Other drivers and restraints analyzed in the detailed report include:
- Exclusive Sports-Rights Wars Driving Premium Pricing
- Integration of Cloud-Native CDN and Edge Compute for Ultra-Low-Latency Live Streams
- Heightened Regulatory Scrutiny on Data Privacy and Localization
For complete list of drivers and restraints, kindly check the Table Of Contents.
Segment Analysis
Video maintained a commanding 77.35% revenue slice in 2025, reflecting entrenched viewing habits and heavy investment in exclusive series that anchor user retention. Music services, however, are expanding at an 8.82% CAGR aided by compact file sizes that stream reliably on constrained networks. The media streaming market size for audio is swelling as AI-driven playlists raise daily listening frequency and enlarge ad inventory.
Lower production costs and borderless appeal allow music platforms to monetize global audiences rapidly, while video players shoulder rising budgets for long-form content. This cost asymmetry encourages cross-format bundling, signalling a future where audio and video propositions converge within a single app to protect market share.
On-demand libraries accounted for 86.76% of 2025 revenue, yet live streaming's 9.44% CAGR illustrates growing appetite for real-time experiences. Sporting fixtures and tent-pole reality shows create appointment viewing that advertisers value, lifting revenue per stream above on-demand averages.
Technical complexity strengthens competitive moats: edge compute and custom protocols manage traffic spikes, ensuring latency below the two-second psychological threshold. Platforms mastering these capabilities are positioned to capture incremental media streaming market share during peak global events.
Complete Report Scope:
- By Content Type
- Video Streaming
- Music Streaming
- By Service Type
- Live Streaming
- On-Demand Streaming
- By Revenue Model
- Subscription (SVOD/AVOD/Hybrid)
- Advertising (AVOD/FAST)
- By Streaming Quality
- SD
- HD
- 4K / UHD
- 8K
- By Geography
- North America
- United States
- Canada
- Mexico
- South America
- Brazil
- Argentina
- Mexico
- Rest of South America
- Europe
- Germany
- United Kingdom
- France
- Italy
- Spain
- Rest of Europe
- Asia-Pacific
- China
- Japan
- South Korea
- India
- Australia
- New Zealand
- Rest of Asia-Pacific
- Middle East
- United Arab Emirates
- Saudi Arabia
- Rest of Middle East and Africa
- Africa
- South Africa
- Rest of Africa
- North America
Geography Analysis
North America generated 34.48% of 2025 revenue but is maturing, prompting operators to pivot from user acquisition toward higher lifetime value. Bundling with fiber and mobile contracts, as demonstrated by Verizon's convergence strategy, locks in households and widens ARPU without heavy marketing spend. Sports-rights competition inflates programming costs, yet the presence of established ad markets sustains hybrid-tier profitability.
Asia-Pacific is projected to expand at a 8.97% CAGR, buoyed by governmental encouragement of local content creation and accelerating 5G coverage. Netflix recorded a 20% regional viewing surge after debuting culturally tailored originals, confirming that local narratives unlock outsized engagement. Governments are offering creator funds-India's USD 1 billion initiative is emblematic-that feed fresh catalogs and stimulate the media streaming market. Nonetheless, diverse data-localization rules compel parallel infrastructure builds, raising entry barriers for smaller brands. Europe shows uneven growth as GDPR compliance and fragmented language markets inflate operational overheads. Carriage agreements such as Netflix's tie-up with TF1 illustrate a hybrid model where streaming and traditional broadcasters collaborate to satisfy regulators and audiences. Latin America's fiber penetration-77.2% in Brazil and 70.9% in Chile-has started translating into higher-resolution streaming uptake, creating fresh addressable revenue. Africa remains mobile-first; low-bandwidth optimizations and downloadable content options are crucial to unlock latent demand.
- Netflix Inc.
- Spotify Technology S.A.
- Apple Inc. (Apple TV+, Apple Music)
- Amazon.com Inc. (Prime Video, Amazon Music)
- Alphabet Inc. (YouTube, YouTube Music)
- Tencent Holdings Ltd. (Tencent Video, QQ Music)
- The Walt Disney Company (Disney+, ESPN+)
- AT&T Inc. (Max / HBO, DirecTV Stream)
- Comcast Corp. (Peacock, NOW TV)
- Roku Inc.
- Deezer S.A.
- Baidu Inc. (iQIYI, Qian Qian Music)
- British Broadcasting Corporation (BBC iPlayer)
- Hulu LLC
- Pandora Media LLC
- ViacomCBS Inc. (Paramount+)
- Sony Group Corp. (Crunchyroll, Sony LIV)
- Naspers Ltd. (Showmax)
- FuboTV Inc.
- DAZN Group Ltd.
Additional Benefits:
- The market estimate (ME) sheet in Excel format
- 3 months of analyst support
TABLE OF CONTENTS
1 INTRODUCTION
- 1.1 Study Assumptions and Market Definition
- 1.2 Scope of the Study
2 RESEARCH METHODOLOGY
3 EXECUTIVE SUMMARY
4 MARKET LANDSCAPE
- 4.1 Market Overview
- 4.2 Market Drivers
- 4.2.1 Proliferation of Low-Cost 5G Data Plans Across Asia-Pacific
- 4.2.2 SVOD Platform Expansion into Tier-II/III Cities in North America and Europe
- 4.2.3 Exclusive Sports-Rights Wars Driving Premium Pricing
- 4.2.4 Integration of Cloud-Native CDN andEdge Compute for Ultra-Low-Latency Live Streams
- 4.2.5 Rise of FAST (Free Ad-Supported TV) Channels Boosting Ad Inventory
- 4.2.6 Bundling of Telco andMedia Services Inducing Subscriber Stickiness
- 4.3 Market Restraints
- 4.3.1 Escalating Content-Licensing Costs Compressing Margins
- 4.3.2 Fragmented Rights Management Hindering Global Release Windows
- 4.3.3 Persistent Last-Mile Latency in Emerging Economies
- 4.3.4 Heightened Regulatory Scrutiny on Data Privacy andLocalization
- 4.4 Regulatory Outlook
- 4.5 Porters Five Forces Analysis
- 4.5.1 Bargaining Power of Suppliers
- 4.5.2 Bargaining Power of Buyers
- 4.5.3 Threat of New Entrants
- 4.5.4 Threat of Substitutes
- 4.5.5 Intensity of Competitive Rivalry
5 MARKET SIZE AND GROWTH FORECASTS (VALUE)
- 5.1 By Content Type
- 5.1.1 Video Streaming
- 5.1.2 Music Streaming
- 5.2 By Service Type
- 5.2.1 Live Streaming
- 5.2.2 On-Demand Streaming
- 5.3 By Revenue Model
- 5.3.1 Subscription (SVOD/AVOD/Hybrid)
- 5.3.2 Advertising (AVOD/FAST)
- 5.4 By Streaming Quality
- 5.4.1 SD
- 5.4.2 HD
- 5.4.3 4K / UHD
- 5.4.4 8K
- 5.5 By Geography
- 5.5.1 North America
- 5.5.1.1 United States
- 5.5.1.2 Canada
- 5.5.1.3 Mexico
- 5.5.2 South America
- 5.5.2.1 Brazil
- 5.5.2.2 Argentina
- 5.5.2.3 Mexico
- 5.5.2.4 Rest of South America
- 5.5.3 Europe
- 5.5.3.1 Germany
- 5.5.3.2 United Kingdom
- 5.5.3.3 France
- 5.5.3.4 Italy
- 5.5.3.5 Spain
- 5.5.3.6 Rest of Europe
- 5.5.4 Asia-Pacific
- 5.5.4.1 China
- 5.5.4.2 Japan
- 5.5.4.3 South Korea
- 5.5.4.4 India
- 5.5.4.5 Australia
- 5.5.4.6 New Zealand
- 5.5.4.7 Rest of Asia-Pacific
- 5.5.5 Middle East
- 5.5.5.1 United Arab Emirates
- 5.5.5.2 Saudi Arabia
- 5.5.5.3 Rest of Middle East and Africa
- 5.5.6 Africa
- 5.5.6.1 South Africa
- 5.5.6.2 Rest of Africa
- 5.5.1 North America
6 COMPETITIVE LANDSCAPE
- 6.1 Strategic Developments
- 6.2 Vendor Positioning Analysis
- 6.3 Company Profiles (includes Global level Overview, Market level overview, Core Segments, Financials as available, Strategic Information, Products andServices, and Recent Developments)
- 6.3.1 Netflix Inc.
- 6.3.2 Spotify Technology S.A.
- 6.3.3 Apple Inc. (Apple TV+, Apple Music)
- 6.3.4 Amazon.com Inc. (Prime Video, Amazon Music)
- 6.3.5 Alphabet Inc. (YouTube, YouTube Music)
- 6.3.6 Tencent Holdings Ltd. (Tencent Video, QQ Music)
- 6.3.7 The Walt Disney Company (Disney+, ESPN+)
- 6.3.8 AT&T Inc. (Max / HBO, DirecTV Stream)
- 6.3.9 Comcast Corp. (Peacock, NOW TV)
- 6.3.10 Roku Inc.
- 6.3.11 Deezer S.A.
- 6.3.12 Baidu Inc. (iQIYI, Qian Qian Music)
- 6.3.13 British Broadcasting Corporation (BBC iPlayer)
- 6.3.14 Hulu LLC
- 6.3.15 Pandora Media LLC
- 6.3.16 ViacomCBS Inc. (Paramount+)
- 6.3.17 Sony Group Corp. (Crunchyroll, Sony LIV)
- 6.3.18 Naspers Ltd. (Showmax)
- 6.3.19 FuboTV Inc.
- 6.3.20 DAZN Group Ltd.
7 MARKET OPPORTUNITIES AND FUTURE OUTLOOK
- 7.1 White-space and Unmet-Need Assessment

 企業串流媒體市場規模、佔有率和成長分析:按組件、部署模式、內容類型、應用、最終用戶產業和地區分類-2026-2033年產業預測
 串流媒體設備市場分析:按設備類型、應用、最終用途和地區分類(2026-2034 年)企業串流媒體市場報告:按解決方案、服務、部署類型、企業規模、應用、最終用途和地區分類(2026-2034 年)
 媒體串流市場:按組件、分銷管道、行業、收入模式和地區分類
 2026年全球企業串流媒體市場報告2026年全球媒體串流市場報告
 企業串流媒體市場:按部署類型、組件、內容類型、組織規模、行業和最終用戶設備分類 - 2026-2032 年全球預測2026年全球串流媒體設備市場報告2026年全球串流媒體設備市場報告
 全球企業串流媒體市場規模、佔有率、趨勢分析報告:2024 年至 2031 年按公司規模、類型、部署、應用、解決方案、行業垂直和地區分類的展望和預測