


 |
市場調查報告書
商品編碼
2124459
光波長服務:市場佔有率分析、產業趨勢與統計、成長預測(2026-2031)Optical Wavelength Services - Market Share Analysis, Industry Trends & Statistics, Growth Forecasts (2026 - 2031) |
||||||

※ 本網頁內容可能與最新版本有所差異。詳細情況請與我們聯繫。
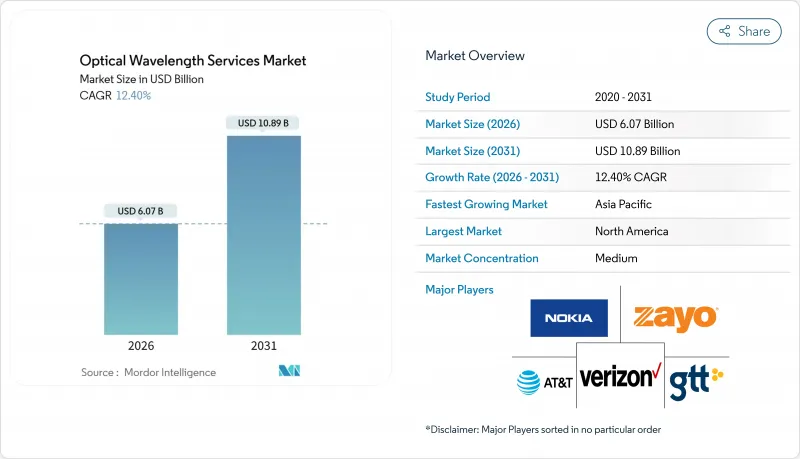
根據 Mordor Intelligence 預測,光波長服務的市場規模預計將在 2026 年達到 60.7 億美元,到 2031 年達到 108.9 億美元,在此期間的複合年成長率為 12.40%。
本報告按波長容量(10G、40G、100G 及其他)、服務類型(已分配波長、暗纖/頻譜及其他)、終端用戶行業(IT 和電信運營商、雲端和超大規模提供商、銀行、金融服務和保險 (BFSI)、醫療保健和生命科學 及其他)、應用(城域/接入、區域/長途 及其他)和地區進行細分。市場預測以美元 (USD) 為單位。
全球光波長服務市場趨勢與洞察
數據流量和頻寬需求增加
預計到2030年,全球IP流量將達到8.2Zetta位元組) ,高於2025年的4.8Zetta位元組,這將迫使電信業者向100G、400G和800G連貫光纖通訊轉型,從而顯著提高頻譜效率。影片串流、雲端遊戲和生成式人工智慧推理已佔消費者流量的82%,而企業複製工作負載在資料中心間頻寬保持著每年35%的成長。能夠保證亞毫秒延遲和99.99%運轉率的營運商,尤其是Lumen Technologies和Telia Carrier,正在紐約、倫敦和東京等地贏得金融服務合約。 Ciena WaveLogic 6 Extreme的部署實現了每個波長1.6 Tb/s的傳輸速度,在降低每位元成本40%的同時,增強了其在光波長服務市場的價值提案。預計到 2031 年,8K影片、VR 會議和自動駕駛汽車遙測技術的普及將進一步推動需求成長。
超大規模和雲端資料中心的數量正在迅速增加。
預計2025年,超大規模資料中心業者將運作128個資料中心,使全球整體達到1042個,共同佔據全球68%的裝置容量。每個資料中心都需要專用的400G-800G鏈路,用於可用區之間的資料複製和人工智慧訓練叢集,這將迫使AWS投資150億美元,微軟Azure投資120億美元,以及Google雲端大規模海底資產。雖然這種垂直整合給電信業者的利潤率帶來了壓力,但也加速了API驅動的按需波長平台的普及,光波長服務市場正透過高價值分析和混合託管套餐持續實現盈利。
建造長途網路線路需要大量資金投入
在已開發市場,1000公里陸路線路的建設成本為每公里8萬至12萬美元,在新興經濟體則為每公里5萬至9萬美元,而跨洋光纜的建設成本則超過3億美元。隨著加權平均資本成本從2023年的6.2%上升至2025年的8.7%,資金籌措難度日益增加,導致業者將重心轉向建設城際線路,並放緩了服務不足區域的擴張。例如,耗資10億美元的「2Africa」光纜預計要到2029年才能實現正現金流,凸顯了光波長服務市場面臨的資金籌措。超大規模資料中心業者的垂直整合進一步縮小了目標批發需求,而印度、巴西和奈及利亞監管政策的不確定性導致授權流程耗時長達24個月。
細分市場分析
截至2025年,100G頻段將佔據光波長服務市場佔有率的46.63%,反映出其已建立的部署基礎。同時,受海底光纜升級和以人工智慧為中心的資料中心互連(DCI)架構的推動,800G及以上頻段正以13.34%的年成長率成長。 400G埠的光波長服務市場規模在2025年將佔出貨量的18%,目前已成為5G傳輸的事實骨幹網路。另一方面,由於SONET和SDH系統的退役,10G和40G鏈路的市佔率持續以每年4-6%的速度下降。南方十字星NEXT計畫已證明,到2028年將實現1.6T光纖通訊的轉型,這意味著傳統平台的獲利能力將面臨進一步的壓力。小規模的電信業者正在權衡前期投資與 400G-800G 波長的批發租賃,並根據流量密度和資金籌措狀況調整他們的決策。
監管支援也是推動升級的因素之一。例如,美國聯邦通訊委員會 (FCC) 針對 2025 年電線杆安裝法規的改革降低了部署成本,加速了光纖的普及,並間接促進了下一代光學模組的採用。超大規模資料中心業者對人工智慧訓練頻寬的巨大需求改變了經濟獲利能力的標準。對於需要高容量的叢集,部署價格昂貴的連貫可插拔設備如今已是合理的,800G 正在成為光波長服務市場的新標準。
預計到2025年,可管理光波長將佔總收入的54.73%,但由於雲端巨頭專注於控制光纖系統,其市佔率正被暗纖和頻譜租賃蠶食,後兩者的年成長率高達13.76%。與乙太網路波段和光VPN服務相關的光波長服務市場規模保持穩定,滿足了需要二層柔軟性和硬體級加密的企業的需求。
電信基礎設施專案(TIP)推廣的開放式線路系統降低了供應商鎖定效應,使營運商能夠混合使用不同設備,並將資本支出(CAPEX)降低20-30%。 Zayo的「頻譜即服務」(頻譜 as a Service)和Lumen的捆綁式邊緣託管服務是現有營運商如何透過創新留住客戶的良好例證。由於營運複雜性,託管服務對擁有少於10個網點的客戶仍然具有吸引力,但超大規模超大規模資料中心業者和大型銀行正日益將暗纖視為戰略資產,從而加速了光波長服務市場的垂直整合。
區域分析
北美地區預計在2025年佔據38.73%的市場佔有率,這主要得益於高密度超大規模企業基地台的部署和5G的普及。 Verizon的15,000個C波段基地台消耗了約22%的城域網路容量,而AWS、Azure和Google Cloud在美國共同總合了超過80,000公里的光纖。 Charter和Comcast以兩位數的成長率擴展了企業光纖線路,墨西哥的近岸外包熱潮推動了2025年光光纖通訊市場9%的成長。美國聯邦通訊委員會(FCC)對電線杆桿監管規定的改革進一步促進了遍遠地區的部署,從而保持了光波長服務市場的穩健發展。
預計到2031年,亞太地區的複合年成長率將達到13.56%,該地區正受惠於中國電信1800億元人民幣(約250億美元)的400G-800G升級計畫和印度1200億印度盧比(約14.4億美元)的BharatNet三期建設項目。日本2,200億元人民幣(約16.3億美元)的都市區部署以及兩條SEA-H2X/Asia Link海底光纜的建設將使該地區的海底通訊容量翻倍。同時,在韓國,基於人工智慧的資料中心的激增正在推動資料中心互連(DCI)需求的成長。這些措施共同鞏固了亞太地區作為全球光波長服務成長最快市場的地位。
2025年,歐洲24%的市佔率取決於英國電信(BT)、Orange和Telia Carrier等業者為支援5G和雲端互聯而進行的都會區擴建。將於2025年6月生效的《Gigabit基礎設施法案》將透過簡化存取權流程和強制基礎設施共用,降低專案成本18%。 Colt和euNetworks已投資4.8億歐元(約5.424億美元)建造連接法蘭克福、阿姆斯特丹、倫敦和巴黎的線路,確保金融業客戶享受亞毫秒延遲。政策的協調統一和私人投資的共同作用,預計將推動該地區光波長服務市場的穩定成長。
儘管中東和非洲地區目前僅佔總銷售額的7%,但自2025年4月推出「2Africa」計畫以來,該地區已展現出顯著成長。沙烏地阿拉伯投資64億美元的全國性400G項目、阿拉伯聯合大公國投資28億美元(約7.56億美元)的5G回程傳輸網路,以及Liquid Intelligent Technologies公司2.2萬公里的網路擴建,均有助於提升網路容量並加速地面網路發展。南美洲6%的市佔率則主要歸功於巴西8,400公里的城域網路擴建以及阿根廷在布宜諾斯艾利斯投資4.2億美元的網路升級,這顯示整個南半球的需求都在擴大。
其他好處:
- Excel格式的市場預測(ME)表
- 3個月的分析師支持
目錄
第1章:引言
- 研究假設和市場定義
- 調查範圍
第2章:調查方法
第3章執行摘要
第4章 市場狀況
- 市場概覽
- 市場促進因素
- 數據流量和頻寬需求增加
- 超大規模和雲端資料中心面積的快速成長
- 高密度 5G回程傳輸與去程傳輸
- 利用人工智慧最佳化交通模式
- 擴展低延遲邊緣互連站點
- 海底電纜升級週期從 800G 到 1.6T 通道
- 市場限制因素
- 開發長程通訊線路需要大量資金投入
- 波長和速率的快速過時
- 主要城市都市中心輸電線路供不應求。
- 新興市場冗長的土地使用許可程序
- 產業價值鏈分析
- 監理情勢
- 技術展望
- 波特五力分析
第5章 市場規模與成長預測
- 按波長容量
- 10 G
- 40 G
- 100 G
- 200 G
- 400G 或以上
- 按服務類型
- 管理(點燃)波長
- 暗纖/頻譜
- Ethernet-over-Wave
- 光纖 VPN
- 按最終用戶行業分類
- IT和電信營運商
- 雲端和超大規模提供者
- BFSI
- 醫療保健和生命科學
- 政府/公共部門
- 媒體與娛樂
- 透過使用
- 地鐵/通道
- 按地區/長途
- 海底
- 邊緣/資料中心
- 按地區
- 北美洲
- 美國
- 加拿大
- 墨西哥
- 南美洲
- 巴西
- 阿根廷
- 其他南美國家
- 歐洲
- 德國
- 英國
- 法國
- 義大利
- 西班牙
- 其他歐洲國家
- 亞太地區
- 中國
- 日本
- 印度
- 韓國
- ASEAN
- 其他亞太國家
- 中東和非洲
- 中東
- 沙烏地阿拉伯
- 阿拉伯聯合大公國
- 其他中東國家
- 非洲
- 南非
- 奈及利亞
- 其他非洲國家
- 中東
- 北美洲
第6章 競爭情勢
- 市場集中度
- 策略趨勢
- 市佔率分析
- 公司簡介
- Nokia Corporation
- Zayo Group Holdings, Inc.
- Verizon Communications Inc.
- GTT Communications, Inc.
- AT&T Inc.
- Lumen Technologies Inc.
- T-Mobile US, Inc.
- Crown Castle Inc.
- Comcast Corporation
- Charter Communications, Inc.
- Windstream Holdings, Inc.
- Colt Technology Services Group Ltd.
- Cox Communications, Inc.
- Jaguar Network SAS(Iliad)
- CarrierBid Communications
- euNetworks Group Ltd.
- Telia Carrier AB
- Exa Infrastructure Ltd.
- Ciena Corporation
- Orange SA
- BT Group plc
- Tata Communications Ltd.
- China Telecom Global Ltd.
- Liquid Intelligent Technologies
第7章 市場機會與未來展望
According to Mordor Intelligence, the optical wavelength services market size stands at USD 6.07 billion in 2026 and is projected to reach USD 10.89 billion by 2031, registering a 12.40% CAGR over the period.
This report is Segmented by Wavelength Capacity (10G, 40G, 100G, and More), Service Type (Managed Lit Wavelength, Dark Fiber/Spectrum, and More), End-User Industry (IT and Telecom Carriers, Cloud and Hyperscale Providers, BFSI, Healthcare and Life Sciences, and More), Application (Metro/Access, Regional/Long-haul, and More), and Geography. The Market Forecasts are Provided in Terms of Value (USD).
Global Optical Wavelength Services Market Trends and Insights
Increasing Data Traffic and Bandwidth Demand
Global IP traffic jumped from 4.8 zettabytes in 2025 to a forecast 8.2 zettabytes by 2030, pushing operators to migrate from 100 G to 400 G and 800 G coherent optics that multiply spectral efficiency. Video streaming, cloud gaming, and generative-AI inference already constitute 82% of consumer traffic, while enterprise replication workloads maintain 35% annual inter-DC bandwidth growth. Operators that guarantee sub-5 ms latency and 99.99% uptime, notably Lumen Technologies and Telia Carrier, are winning financial-services contracts across New York, London, and Tokyo. Deployments of Ciena WaveLogic 6 Extreme enable 1.6 Tb/s per wavelength, slashing cost per bit by 40% and reinforcing the optical wavelength services market's value proposition. Looming 8K video, VR conferencing, and autonomous-vehicle telemetry will drive further uptake through 2031.
Surge in Hyperscale and Cloud DC Footprints
Hyperscalers commissioned 128 new data-center sites in 2025, raising the global count to 1,042 and jointly controlling 68% installed capacity. Each facility demands dedicated 400 G-800 G links for availability-zone replication and AI training clusters, compelling AWS to invest USD 15 billion, Microsoft Azure USD 12 billion, and Google Cloud in extensive subsea assets. Their vertical integration squeezes carrier margins and accelerates adoption of API-driven, on-demand wavelength platforms that the optical wavelength services market continues to monetize via value-added analytics and hybrid colocation bundles.
High CAPEX for Long-Haul Builds
A 1,000 km terrestrial route demands USD 80,000-120,000 per km in developed markets and USD 50,000-90,000 in emerging economies, while a transoceanic cable exceeds USD 300 million. Financing is becoming more challenging as the weighted average capital cost rose from 6.2% in 2023 to 8.7% in 2025, steering operators toward metro builds and slowing underserved corridor expansion. The USD 1 billion 2Africa cable, for instance, will not be cash-positive until 2029, highlighting the financing pressures in the optical wavelength services market. Vertical integration by hyperscalers further reduces addressable wholesale demand, and regulatory ambiguities in India, Brazil, and Nigeria extend permitting by up to 24 months.
Other drivers and restraints analyzed in the detailed report include:
- 5G Backhaul and Fronthaul Densification
- AI-Driven Traffic Pattern Optimization
- Rapid Wavelength-Rate Obsolescence
For complete list of drivers and restraints, kindly check the Table Of Contents.
Segment Analysis
The 100 G tier held 46.63% of optical wavelength services market share in 2025, reflecting its entrenched installed base. The 800 G and above cohort, however, is rising 13.34% annually, fueled by submarine upgrades and AI-centric DCI fabrics. The optical wavelength services market size, attributable to 400 G ports, captured 18% of shipments in 2025 and is now the de facto backbone for 5G transport. Meanwhile, 10 G and 40 G links continue a 4-6% annual decline as SONET and SDH systems are retired. The shift toward 1.6 T optics by 2028, already demonstrated on Southern Cross NEXT, suggests further suppression of legacy platform economics. Smaller operators weigh leasing wholesale 400 G-800 G wavelengths against upfront investment, tailoring decisions to traffic density and access to capital.
Upgrades are also aided by regulatory support, for instance, the FCC's 2025 pole-attachment reforms reduced deployment costs and expedited fiber strand additions, indirectly accelerating the adoption of next-gen optics. Hyperscalers' insatiable demand for AI training bandwidth has shifted the threshold of economic viability: capacity-hungry clusters can now justify premium coherent pluggables, solidifying 800 G as the new standard within the optical wavelength services market.
Managed lit wavelengths delivered 54.73% of revenue in 2025 but are losing share to dark fiber and spectrum leasing, which grow 13.76% annually as cloud giants favor control over optical line systems. The optical wavelength services market size tied to Ethernet-over-wave and optical VPN offerings remains stable, catering to enterprises needing Layer-2 flexibility and hardware-level encryption.
Open-line-system advocacy from the Telecom Infra Project reduces vendor lock-in, allowing carriers to mix equipment and shave CAPEX 20-30%. Zayo's spectrum-as-a-service and Lumen's bundled edge colocation exemplify how incumbents innovate to retain clientele. For customers with fewer than ten sites, operational complexity keeps managed services compelling, but hyperscalers and large banks increasingly view dark fiber as strategic, accelerating vertical integration within the optical wavelength services market.
Complete Report Scope:
- By Wavelength Capacity
- 10 G
- 40 G
- 100 G
- 200 G
- 400 G and above
- By Service Type
- Managed (Lit) Wavelength
- Dark Fiber / Spectrum
- Ethernet-over-Wave
- Optical VPN
- By End-user Industry
- IT and Telecom Carriers
- Cloud and Hyperscale Providers
- BFSI
- Healthcare and Life Sciences
- Government and Public Sector
- Media and Entertainment
- By Application
- Metro/Access
- Regional/Long-haul
- Sub-sea
- Edge/Inter-DC
- By Geography
- North America
- United States
- Canada
- Mexico
- South America
- Brazil
- Argentina
- Rest of South America
- Europe
- Germany
- United Kingdom
- France
- Italy
- Spain
- Rest of Europe
- Asia-Pacific
- China
- Japan
- India
- South Korea
- ASEAN
- Rest of Asia-Pacific
- Middle East and Africa
- Middle East
- Saudi Arabia
- United Arab Emirates
- Rest of Middle East
- Africa
- South Africa
- Nigeria
- Rest of Africa
- Middle East
- North America
Geography Analysis
North America's 38.73% revenue share in 2025 rests on dense hyperscale footprints and 5G deployment. Verizon's 15,000 C-band cell sites consumed around 22% of metro capacity, while AWS, Azure, and Google Cloud jointly leased more than 80,000 fiber-pair-kilometers across U.S. regions. Charter and Comcast expanded enterprise fiber routes by double digits, and Mexico's near-shoring boom drove 9% optical growth in 2025. FCC pole-attachment reforms further bolster rural rollouts, keeping the optical wavelength services market resilient.
Asia Pacific, forecast at a 13.56% CAGR through 2031, benefits from China Telecom's CNY 180 billion (USD 25 billion) 400 G-800 G upgrade plan and India's INR 120 billion (USD 1.44 billion) BharatNet Phase III builds. Japan's JPY 220 billion (USD 1.63 billion) urban deployments and twin SEA-H2X/Asia Link cables double regional subsea capacity, while South Korea's AI-anchored data-centers escalate intra-DCI demand. Collectively, these initiatives reinforce Asia Pacific as the fastest-growing optical wavelength services market globally.
Europe's 24% share in 2025 hinges on BT, Orange, and Telia Carrier's metro extensions to serve 5G and cloud interconnects. The Gigabit Infrastructure Act, effective June 2025, simplifies rights-of-way and mandates infrastructure sharing, slashing project costs 18%. Colt and euNetworks injected EUR 480 million (USD 542.4 million) into Frankfurt-Amsterdam-London-Paris routes, securing sub-5 ms latency for financial clients. Together, policy harmonization and private investments promise steady expansion for the region's optical wavelength services market.
Middle East and Africa represents 7% revenue but registers outsized momentum after 2Africa's April 2025 launch. Saudi Arabia's USD 6.4 billion national 400 G project, UAE's AED 2.8 billion (USD 756 million) 5G backhaul investment, and Liquid Intelligent Technologies' 22,000 km network extension collectively raise capacity and catalyze terrestrial build-outs. South America's 6% share stems from Brazil's 8,400 km metro expansions and Argentina's USD 420 million Buenos Aires upgrade, illustrating spreading demand across the Southern Hemisphere.
- Nokia Corporation
- Zayo Group Holdings, Inc.
- Verizon Communications Inc.
- GTT Communications, Inc.
- AT&T Inc.
- Lumen Technologies Inc.
- T-Mobile US, Inc.
- Crown Castle Inc.
- Comcast Corporation
- Charter Communications, Inc.
- Windstream Holdings, Inc.
- Colt Technology Services Group Ltd.
- Cox Communications, Inc.
- Jaguar Network SAS (Iliad)
- CarrierBid Communications
- euNetworks Group Ltd.
- Telia Carrier AB
- Exa Infrastructure Ltd.
- Ciena Corporation
- Orange S.A.
- BT Group plc
- Tata Communications Ltd.
- China Telecom Global Ltd.
- Liquid Intelligent Technologies
Additional Benefits:
- The market estimate (ME) sheet in Excel format
- 3 months of analyst support
TABLE OF CONTENTS
1 INTRODUCTION
- 1.1 Study Assumptions and Market Definition
- 1.2 Scope of the Study
2 RESEARCH METHODOLOGY
3 EXECUTIVE SUMMARY
4 MARKET LANDSCAPE
- 4.1 Market Overview
- 4.2 Market Drivers
- 4.2.1 Increasing Data Traffic and Bandwidth Demand
- 4.2.2 Surge in Hyperscale and Cloud DC Footprints
- 4.2.3 5G Backhaul and Fronthaul Densification
- 4.2.4 AI-Driven Traffic Pattern Optimisation
- 4.2.5 Growth of Low-Latency Edge Interconnect Sites
- 4.2.6 Sub-Sea Upgrade Cycles to 800G-1.6T Channels
- 4.3 Market Restraints
- 4.3.1 High CAPEX for Long-Haul Builds
- 4.3.2 Rapid Wavelength-Rate Obsolescence
- 4.3.3 Scarcity of Metro-Core Conduit in Tier-1 Cities
- 4.3.4 Lengthy Rights-of-Way Permitting in Emerging Markets
- 4.4 Industry Value Chain Analysis
- 4.5 Regulatory Landscape
- 4.6 Technological Outlook
- 4.7 Porter's Five Forces Analysis
- 4.7.1 Threat of New Entrants
- 4.7.2 Bargaining Power of Suppliers
- 4.7.3 Bargaining Power of Buyers
- 4.7.4 Threat of Substitutes
- 4.7.5 Competitive Rivalry
5 MARKET SIZE AND GROWTH FORECASTS (VALUE)
- 5.1 By Wavelength Capacity
- 5.1.1 10 G
- 5.1.2 40 G
- 5.1.3 100 G
- 5.1.4 200 G
- 5.1.5 400 G and above
- 5.2 By Service Type
- 5.2.1 Managed (Lit) Wavelength
- 5.2.2 Dark Fiber / Spectrum
- 5.2.3 Ethernet-over-Wave
- 5.2.4 Optical VPN
- 5.3 By End-user Industry
- 5.3.1 IT and Telecom Carriers
- 5.3.2 Cloud and Hyperscale Providers
- 5.3.3 BFSI
- 5.3.4 Healthcare and Life Sciences
- 5.3.5 Government and Public Sector
- 5.3.6 Media and Entertainment
- 5.4 By Application
- 5.4.1 Metro/Access
- 5.4.2 Regional/Long-haul
- 5.4.3 Sub-sea
- 5.4.4 Edge/Inter-DC
- 5.5 By Geography
- 5.5.1 North America
- 5.5.1.1 United States
- 5.5.1.2 Canada
- 5.5.1.3 Mexico
- 5.5.2 South America
- 5.5.2.1 Brazil
- 5.5.2.2 Argentina
- 5.5.2.3 Rest of South America
- 5.5.3 Europe
- 5.5.3.1 Germany
- 5.5.3.2 United Kingdom
- 5.5.3.3 France
- 5.5.3.4 Italy
- 5.5.3.5 Spain
- 5.5.3.6 Rest of Europe
- 5.5.4 Asia-Pacific
- 5.5.4.1 China
- 5.5.4.2 Japan
- 5.5.4.3 India
- 5.5.4.4 South Korea
- 5.5.4.5 ASEAN
- 5.5.4.6 Rest of Asia-Pacific
- 5.5.5 Middle East and Africa
- 5.5.5.1 Middle East
- 5.5.5.1.1 Saudi Arabia
- 5.5.5.1.2 United Arab Emirates
- 5.5.5.1.3 Rest of Middle East
- 5.5.5.2 Africa
- 5.5.5.2.1 South Africa
- 5.5.5.2.2 Nigeria
- 5.5.5.2.3 Rest of Africa
- 5.5.5.1 Middle East
- 5.5.1 North America
6 COMPETITIVE LANDSCAPE
- 6.1 Market Concentration
- 6.2 Strategic Moves
- 6.3 Market Share Analysis
- 6.4 Company Profiles (includes Global level Overview, Market level overview, Core Segments, Financials as available, Strategic Information, Market Rank/Share for key companies, Products and Services, and Recent Developments)
- 6.4.1 Nokia Corporation
- 6.4.2 Zayo Group Holdings, Inc.
- 6.4.3 Verizon Communications Inc.
- 6.4.4 GTT Communications, Inc.
- 6.4.5 AT&T Inc.
- 6.4.6 Lumen Technologies Inc.
- 6.4.7 T-Mobile US, Inc.
- 6.4.8 Crown Castle Inc.
- 6.4.9 Comcast Corporation
- 6.4.10 Charter Communications, Inc.
- 6.4.11 Windstream Holdings, Inc.
- 6.4.12 Colt Technology Services Group Ltd.
- 6.4.13 Cox Communications, Inc.
- 6.4.14 Jaguar Network SAS (Iliad)
- 6.4.15 CarrierBid Communications
- 6.4.16 euNetworks Group Ltd.
- 6.4.17 Telia Carrier AB
- 6.4.18 Exa Infrastructure Ltd.
- 6.4.19 Ciena Corporation
- 6.4.20 Orange S.A.
- 6.4.21 BT Group plc
- 6.4.22 Tata Communications Ltd.
- 6.4.23 China Telecom Global Ltd.
- 6.4.24 Liquid Intelligent Technologies
7 MARKET OPPORTUNITIES AND FUTURE OUTLOOK
- 7.1 White-space and Unmet-need Assessment

 光波長服務市場規模、佔有率、趨勢和預測:按頻寬、介面、組織規模、應用和地區分類,2026-2034 年
 2026年全球光波長服務市場報告
 光波長服務市場分析及預測(至2035年):依類型、產品、服務、技術、組件、應用、部署模式、最終用戶、功能及解決方案分類
 光波長服務市場規模、佔有率、成長及全球產業分析:按類型、應用和地區劃分的洞察與預測(2026-2034)Frost Radar:北美波長服務,2025 年
 光波長服務市場-全球產業規模、佔有率、趨勢、機會及預測(按傳輸速率、按配置類型、按行業、按地區、按競爭)2020-2030F