


 |
市場調查報告書
商品編碼
2124383
美國數位貨運:市場佔有率分析、產業趨勢與統計及成長預測(2026-2031 年)United States Digital Freight Forwarding - Market Share Analysis, Industry Trends & Statistics, Growth Forecasts (2026 - 2031) |
||||||

※ 本網頁內容可能與最新版本有所差異。詳細情況請與我們聯繫。
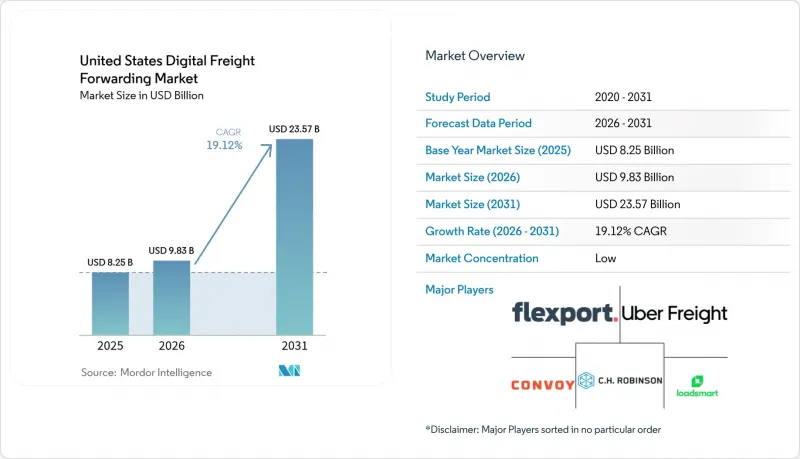
據 Mordor Intelligence 稱,2025 年美國數位貨運市場價值 82.5 億美元,預計到 2031 年將達到 235.7 億美元,而 2026 年為 98.3 億美元,預測期(2026-2031 年)的複合年成長率為 19.12%。
本報告按功能(運輸管理(陸運、海運、空運)、倉儲管理、附加價值服務)、最終用戶(零售和電子商務、製造業、醫療保健和製藥、汽車、其他)、部署模式(雲端、本地部署)、企業規模(中小企業、大型企業、政府機構)和地區進行細分。市場預測以美元計價。
美國數位貨運市場的趨勢與洞察
電子商務的快速發展正在推動小包裹進口量的成長。
2024年,美國電子商務市場規模達8,338億美元,佔零售總額的15.5%,其中跨境小包裹已佔5%。預計到2029年,小包裹量將達到290億件,年複合成長率達5%,這將給最後一公里配送網路帶來巨大壓力,並促使企業轉向更快捷、低價值的貨物配送管理模式。數位化貨運代理正在應用自動化海關演算法和人工智慧驅動的路線最佳化技術,以處理每天數千件86類入境貨物的清關。零售業對即時回應的需求正推動承運商提供低成本、兩日達的配送服務,這加大了傳統貨運代理數位轉型的壓力。缺乏這些能力的公司將面臨在美國數位貨運市場被原生技術競爭對手蠶食的風險,後者能夠大規模處理小小包裹數據。
對端到端貨物可視性和即時分析的需求
截至2024年,僅20%的貨運代理商擁有完善的物流視覺化系統,但托運人越來越重視可靠性而非單純的速度。物聯網感測器、雲端儀錶板和預測分析正在取代人工發送的狀態郵件,並實現主動異常管理。麥肯錫的數據顯示,90%的美國消費者仍然優先考慮成本,但準時送達仍然至關重要。 Uber Freight的生成式人工智慧平台就充分證明了這一點。該平台每年處理2400萬件貨物,並提供動態的預計到達時間(ETA)預測和替代路線提案。隨著托運人對數據驅動型服務的需求日益成長,這種能力正成為供應商之間越來越重要的差異化優勢。
航運承運商的去中心化正在延緩API的普及。
美國擁有超過8萬家貨運公司,但其中許多缺乏現代化的IT基礎設施,導致平台整合困難。數位貨運代理商的資源過度集中於混合工作流程(結合人工和數位化流程),減緩了網路擴張速度。簡化的入駐工具包和低程式碼API橋接器有所幫助,但區域差異依然存在,冗長的入駐時間限制了美國數位化貨運市場可實現的成長速度。
細分市場分析
預計到2025年,運輸管理將占美國數位貨運市場佔有率的45.72%,凸顯了托運人在路線選擇、承運商績效和路線規劃最佳化方面的首要關注點。目前,人工智慧演算法正在平衡陸運、海運和空運的組合,以減少空運距離和縮短停留時間。即時API連接司機、倉庫和報關行,使該平台能夠自動處理超過40萬名美國卡車司機的運輸請求。這種高效性使貨運代理商能夠在保證服務品質的同時,快速處理零售進口貨物。
隨著托運人對用於清關、保險和貿易合規分析的整合式儀錶板的需求日益成長,附加價值服務以10.94%的複合年成長率(CAGR)位居榜首。機器學習模型能夠讀取商業發票,識別關稅減免機會,並提案通則(Incoterms)。這種功能的融合正促使托運人傾向於選擇整合平台,從而提高單筆帳戶收入,並擴大美國數位貨運代理市場的規模。
受15.5%的線上零售滲透率和低價值小包裹進口激增的推動,零售和電子商務預計到2025年將占美國數位貨運代理市場規模的36.48%。全通路零售商正在將訂單管理系統與數位貨運代理API整合,以便透過單一介面協調門市補貨和消費者配送。逆向物流工作流程在服裝業也日益普及,該產業的平均退貨率高達16%。
預計醫療保健和製藥業將保持最高的成長率,到2031年複合年成長率將達到11.86%,反映出對嚴格溫度控制和可追溯性的需求。聯邦快遞推出永續航空燃料和人工智慧驅動的冷鏈分析,清楚地表明了對專業運輸路線的需求。數位化貨運代理商正在利用配備感測器的包裝材料和受監管的數據存儲庫,以確保生技藥品的運輸契約,因為準時性至關重要。
其他好處
- Excel格式的市場預測(ME)表
- 3個月的分析師支持
目錄
第1章:引言
- 研究假設和市場定義
- 調查範圍
第2章:調查方法
第3章執行摘要
第4章 市場狀況
- 市場概覽
- 市場促進因素
- 電子商務的快速發展正在推動小包裹進口量的成長。
- 對端到端交通運輸可視化和即時分析的需求
- ACE和USMCA對海關程序的數位化改造縮短了等待時間。
- 美國證券交易委員會關於網路安全事件的規定正在推動符合 SOC-2 標準的平台的發展。
- 將業務外包到墨西哥正在促進跨境數位走廊的發展。
- 降低網路保險保費將鼓勵中型企業採用此類保險。
- 市場限制因素
- 航運業的碎片化延緩了API的普及應用。
- 海運現貨運費價格波動劇烈,影響了即時報價的準確性。
- 勒索軟體事件正在擾亂物流技術平台的運作。
- 卡車保險費上漲推高了仲介手續費。
- 價值供應鏈分析
- 監理情勢
- 技術展望
- 波特五力模型
- 美國電子商務物流概覽
- 新冠疫情與地緣政治事件的影響
第5章 市場規模與成長預測
- 按功能
- 運輸管理
- 土地
- 海
- 航空
- 倉庫管理
- 附加價值服務
- 運輸管理
- 最終用戶
- 零售與電子商務
- 製造業
- 醫療保健和製藥
- 車
- 其他
- 部署模式
- 雲
- 現場
- 按公司規模
- 小型企業
- 大型企業和政府機構
- 美國地區登機
- 東北
- 中西部
- 南部
- 西
第6章 競爭情勢
- 市場集中度
- 策略趨勢
- 市佔率分析
- 公司簡介
- Flexport
- Uber Freight
- Convoy
- CH Robinson(Navisphere)
- Loadsmart
- Expeditors International
- Kuehne+Nagel(KN Freight Net)
- Twill
- Forto
- InstaFreight
- Transporteca
- Kontainers
- Turvo
- iContainers
- DHL Group(myDHLi)
- uShip
- Nuvocargo
- Zencargo
- Shipthis
- Transfix
第7章 市場機會與未來展望
According to Mordor Intelligence, the United States digital freight forwarding market size was valued at USD 8.25 billion in 2025 and estimated to grow from USD 9.83 billion in 2026 to reach USD 23.57 billion by 2031, at a CAGR of 19.12% during the forecast period (2026-2031).
This report is Segmented by Function (Transportation Management (Land, Sea, Air), Warehouse Management, Value-Added Services), End-Users (Retail & E-Commerce, Manufacturing, Healthcare & Pharma, Automotive, Others), Deployment Mode (Cloud, On-Premise), Firm Type (SMEs, Large Enterprises and Government Entities), and Geography. The Market Forecasts are Provided in Terms of Value (USD).
United States Digital Freight Forwarding Market Trends and Insights
E-commerce Boom Driving Small-Parcel Import Volumes
U.S. e-commerce reached USD 833.8 billion in 2024, representing 15.5% of total retail, and cross-border parcels already account for 5% of that value. Parcel volumes are projected to hit 29 billion by 2029 at a 5% CAGR, flooding last-mile networks and forcing a shift toward high-velocity, low-value shipment orchestration. Digital freight forwarders are embedding automated customs algorithms and AI route optimization to manage thousands of daily entries under Entry Type 86. Real-time retail expectations compel carriers to deliver low-cost two-day shipping, intensifying pressure on traditional forwarders to digitize. Companies lacking these capabilities risk losing share in the United States digital freight forwarding market to technology-native rivals capable of processing small-parcel data at scale.
Demand for End-to-End Shipment Visibility and Real-Time Analytics
Only 20% of forwarders had comprehensive visibility in place by 2024, yet shippers increasingly rank reliability above pure speed. IoT sensors, cloud dashboards, and predictive analytics are replacing manual status emails, enabling proactive exception management. McKinsey notes 90% of U.S. consumers still prioritize cost, but on-time delivery remains mandatory. Uber Freight's generative-AI platform illustrates the payoff: 24 million loads processed annually with dynamic ETA predictions and alternative routing suggestions. This capability increasingly differentiates providers as shippers demand data-rich service.
Fragmented Carrier Base Slows API Onboarding
The United States hosts more than 80,000 trucking carriers, many of which lack modern IT stacks, complicating platform integrations. Digital forwarders spend disproportionate resources on hybrid manual-digital workflows, delaying network scale-up. Although simplified onboarding kits and low-code API bridges help, regional disparities persist, and onboarding timelines lengthen, reducing the attainable growth rate for the United States digital freight forwarding market.
Other drivers and restraints analyzed in the detailed report include:
- Digitized Customs Clearance via ACE and USMCA Reduces Dwell Time
- Near-shoring to Mexico Spurs Cross-Border Digital Corridors
- Volatile Ocean Spot Rates Hamper Instant Quoting Accuracy
For complete list of drivers and restraints, kindly check the Table Of Contents.
Segment Analysis
Transportation Management accounted for a 45.72% United States digital freight forwarding market share in 2025, underscoring shippers' priority to optimize lane selection, carrier performance, and route planning. AI algorithms now balance freight mix across land, sea, and air to reduce empty miles and cut dwell time. Real-time APIs align drivers, warehouses, and customs brokers, enabling platforms to automate tendering across more than 400,000 U.S. truck drivers. This efficiency lets forwarders process high-velocity retail imports while sustaining service quality.
Value-added Services record the fastest 10.94% CAGR as shippers demand consolidated dashboards that blend customs brokerage, insurance, and trade-compliance analytics. Machine-learning models read commercial invoices, identify duty-savings opportunities, and suggest alternative Incoterms. The converging feature set encourages shippers to favor unified platforms, deepening revenue per account and amplifying scale within the United States digital freight forwarding market.
Retail & E-commerce captured 36.48% of the United States digital freight forwarding market size in 2025, fueled by 15.5% online retail penetration and the surge of low-value parcel imports. Omnichannel retailers integrate order-management systems with digital forwarder APIs to orchestrate store replenishment and consumer deliveries through a single interface. Reverse-logistics workflows also gain traction as return rates average 16% in apparel.
Healthcare & Pharma exhibit the highest 11.86% CAGR through 2031, reflecting strict temperature-control and traceability needs. FedEx's sustainable aviation-fuel rollout and AI-enabled cold-chain insights illustrate demand for specialized lanes. Digital forwarders leverage sensor-laden packaging and regulatory-compliant data vaults to win contracts for time-sensitive biologics shipments.
Complete Report Scope:
- By Function
- Transportation Management
- Land
- Sea
- Air
- Warehouse Management
- Value-added Services
- Transportation Management
- By End-users
- Retail and E-commerce
- Manufacturing
- Healthcare and Pharma
- Automotive
- Others
- By Deployment Mode
- Cloud
- On-premise
- By Firm Type
- SMEs
- Large Enterprises and Government Entities
- By US Region
- Northeast
- Midwest
- South
- West
List of Companies Covered in this Report:
- Flexport
- Uber Freight
- Convoy
- C.H. Robinson (Navisphere)
- Loadsmart
- Expeditors International
- Kuehne + Nagel (KN Freight Net)
- Twill
- Forto
- InstaFreight
- Transporteca
- Kontainers
- Turvo
- iContainers
- DHL Group (myDHLi)
- uShip
- Nuvocargo
- Zencargo
- Shipthis
- Transfix
Additional Benefits:
- The market estimate (ME) sheet in Excel format
- 3 months of analyst support
TABLE OF CONTENTS
1 Introduction
- 1.1 Study Assumptions and Market Definition
- 1.2 Scope of the Study
2 Research Methodology
3 Executive Summary
4 Market Landscape
- 4.1 Market Overview
- 4.2 Market Drivers
- 4.2.1 E-commerce boom driving small-parcel import volumes
- 4.2.2 Demand for end-to-end shipment visibility and real-time analytics
- 4.2.3 Digitized customs clearance via ACE and USMCA reduces dwell time
- 4.2.4 SEC cyber-incident rules push SOC-2-compliant platforms
- 4.2.5 Near-shoring to Mexico spurs cross-border digital corridors
- 4.2.6 Softening cyber-insurance rates unlock mid-market adoption
- 4.3 Market Restraints
- 4.3.1 Fragmented carrier base slows API onboarding
- 4.3.2 Volatile ocean spot rates hamper instant quoting accuracy
- 4.3.3 Ransomware incidents disrupt logistics tech platforms
- 4.3.4 Rising trucking insurance premiums inflate brokerage costs
- 4.4 Value / Supply-Chain Analysis
- 4.5 Regulatory Landscape
- 4.6 Technological Outlook
- 4.7 Porter's Five Forces
- 4.7.1 Bargaining Power of Suppliers
- 4.7.2 Bargaining Power of Buyers
- 4.7.3 Threat of New Entrants
- 4.7.4 Threat of Substitutes
- 4.7.5 Intensity of Competitive Rivalry
- 4.8 Overview of United States E-commerce Logistics
- 4.9 Impact of COVID-19 and Geo-Political Events
5 Market Size and Growth Forecasts (Value)
- 5.1 By Function
- 5.1.1 Transportation Management
- 5.1.1.1 Land
- 5.1.1.2 Sea
- 5.1.1.3 Air
- 5.1.2 Warehouse Management
- 5.1.3 Value-added Services
- 5.1.1 Transportation Management
- 5.2 By End-users
- 5.2.1 Retail and E-commerce
- 5.2.2 Manufacturing
- 5.2.3 Healthcare and Pharma
- 5.2.4 Automotive
- 5.2.5 Others
- 5.3 By Deployment Mode
- 5.3.1 Cloud
- 5.3.2 On-premise
- 5.4 By Firm Type
- 5.4.1 SMEs
- 5.4.2 Large Enterprises and Government Entities
- 5.5 By US Region
- 5.5.1 Northeast
- 5.5.2 Midwest
- 5.5.3 South
- 5.5.4 West
6 Competitive Landscape
- 6.1 Market Concentration
- 6.2 Strategic Moves
- 6.3 Market Share Analysis
- 6.4 Company Profiles (includes Global level Overview, Market level overview, Core Segments, Financials as available, Strategic Information, Market Rank/Share for key companies, Products and Services, Recent Developments)
- 6.4.1 Flexport
- 6.4.2 Uber Freight
- 6.4.3 Convoy
- 6.4.4 C.H. Robinson (Navisphere)
- 6.4.5 Loadsmart
- 6.4.6 Expeditors International
- 6.4.7 Kuehne + Nagel (KN Freight Net)
- 6.4.8 Twill
- 6.4.9 Forto
- 6.4.10 InstaFreight
- 6.4.11 Transporteca
- 6.4.12 Kontainers
- 6.4.13 Turvo
- 6.4.14 iContainers
- 6.4.15 DHL Group (myDHLi)
- 6.4.16 uShip
- 6.4.17 Nuvocargo
- 6.4.18 Zencargo
- 6.4.19 Shipthis
- 6.4.20 Transfix
7 Market Opportunities and Future Outlook
- 7.1 White-space and Unmet-Need Assessment

 2026年全球貨櫃運輸編配平台(從港口到目的地)市場報告
 數位貨運代理市場:依服務類型、最終用戶產業、貨物類型、貨物規模、部署模式和運輸方向分類-2026-2032年全球市場預測
 數位化貨運代理:市場佔有率分析、產業趨勢與統計、成長預測(2026-2031)
 數位貨運代理:全球市場佔有率和排名、總收入和需求預測(2025-2031 年)
 全球數位貨運代理市場
 數位貨運代理市場規模、佔有率及成長分析(按業務流程、服務類型、應用、資料類型、技術和地區)-產業預測,2025 年至 2032 年中國數位貨運:市場佔有率分析、產業趨勢與統計、成長預測(2025-2030)