


 |
市場調查報告書
商品編碼
2124333
路線最佳化軟體:市佔率分析、產業趨勢與統計、成長預測(2026-2031)Route Optimization Software - Market Share Analysis, Industry Trends & Statistics, Growth Forecasts (2026 - 2031) |
||||||

※ 本網頁內容可能與最新版本有所差異。詳細情況請與我們聯繫。
據 Mordor Intelligence 稱,2025 年路線最佳化軟體市場價值為 79.2 億美元,預計到 2031 年將達到 167.8 億美元,而 2026 年為 89.8 億美元,預測期(2026-2031 年)的複合年成長率為 13.32%。
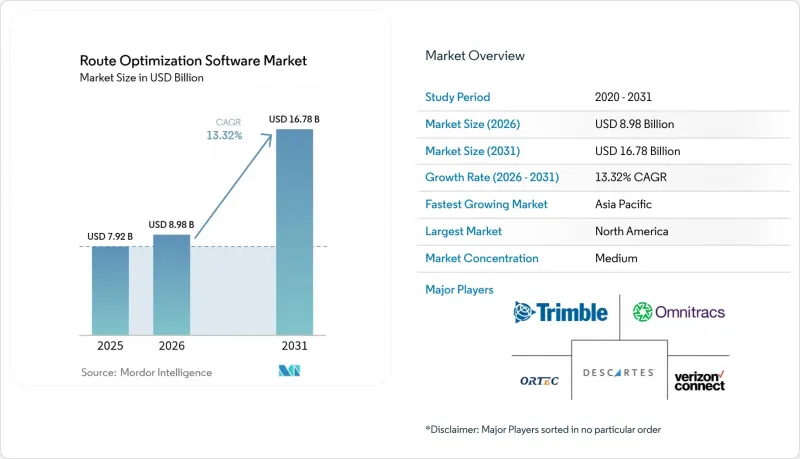
本報告按解決方案組件(軟體平台和服務)、最終用戶行業(按需食品配送、零售/快速消費品等)、組織規模(中小企業和大型企業)、部署類型(雲端和本地部署)以及地區進行細分。市場預測以價值(美元)表示。
全球路線最佳化軟體市場趨勢與洞察
電子商務小包裹量呈現爆炸性成長。
電子商務小包裹數量已飆升至每年數十億件,崩壞了傳統的中心輻射式配送模式,迫使軟體供應商在有限的時限內處理數百萬個動態的配送目的地。光是亞馬遜一家預計在2024年就將處理超過50億個小包裹,這凸顯了對能夠無縫整合庫存接近性、微型倉配中心位置和即時交通預測的演算法的需求。在人口密集的都市區進行配送需要機器學習引擎,以便根據歷史需求、天氣和駕駛行為數據預先最佳化路線。隨著零售商擴展全通路服務並承諾當日送達,無法在毫秒內重新計算路線的平台正逐漸被淘汰。
利用5G技術對零工經濟配送車隊進行即時最佳化
5G 和多存取邊緣運算 (MAEC) 可實現毫秒延遲,將基於批次的調度轉變為持續最佳化。外送平台可以利用本地網路邊緣,在訂單激增或交通堵塞時即時重新計算路線。邊緣節點將往返運算時間縮短至 1-10 毫秒,使駕駛者能夠在到達下一個紅綠燈前收到更新後的配送訂單。由於服務覆蓋範圍目前仍以城市為中心,農村地區的配送車隊要等到全國範圍的部署成熟後才能充分受益。
群眾外包駕駛資料集中的複雜資料權利
GDPR及類似法規限制了機器學習流程中可用的行為資料的數量和詳細程度。軟體供應商必須整合使用者許可管理、資料處理歷程追蹤和選擇性刪除工作流程,這增加了合規成本。沒有專門法務團隊的中小型供應商在跨國業務拓展方面面臨重重障礙,而隨著資金雄厚的企業承擔合規成本,市場集中度也日益提高。
細分市場分析
預計到2025年,軟體平台將維持62.15%的路線最佳化軟體市場佔有率,這反映了其作為自動化調度系統基礎的地位。諮詢和整合服務雖然絕對值較小,但隨著企業面臨多供應商IT環境和變更管理的挑戰,其複合年成長率(CAGR)正以14.08%的速度成長。實施者正在重新設計倉庫工作流程、運輸管理系統介面和客戶關係管理(CRM)通知,以實現軟體承諾的成本節約。由於意識到在不進行流程重新設計的情況下,僅靠平台實施很難實現兩位數的交付成本降低,供應商正擴大將諮詢服務打包出售。
此外,隨著配送車輛的服務範圍擴展到試點區域之外,企業依賴服務團隊進行持續的模型調整、基準測試和極端情況異常處理,這些工作變得至關重要。因此,持續的「最佳化即服務」合約正在蠶食永久授權的需求,並穩定供應商的收入來源。預計到2031年,路線最佳化軟體市場中的專業服務部分規模將超過47.2億美元,這表明市場正在轉向基於結果的協作模式。
儘管零售商和日常消費品(FMCG) 供應商佔據了大部分收入,但按需食品配送市場正以 15.03% 的複合年成長率 (CAGR) 迅速擴張,30 分鐘內送達已成為競爭標準。受動態配送車隊和需要即時重新計算的生鮮食品運輸的推動,預計到 2031 年,與食品配送車輛相關的路線最佳化軟體市場規模將超過 23.2 億美元。演算法必須每隔幾分鐘重新最佳化路線,在熱損耗限制和廚房容量之間取得平衡。
現場服務、醫療保健和叫車服務需要專門的約束庫、藥品溫度監控、技術人員技能匹配或司機重新部署模型,每個領域都有其特定的需求。這種日益成長的垂直整合迫使供應商發布插件而非「一體化」引擎,這導致平台市場結構碎片化,同時也提高了專業細分市場的總潛在價值 (TAV)。
區域分析
到2025年,北美將佔總收入的38.05%。在電子商務日趨成熟和司機嚴重短缺的背景下,透過演算法減少里程至關重要。亞馬遜的專有系統已樹立了行業標桿,這將對競爭對手產生影響。加拿大正在利用跨境模組來協調北美自由貿易協定(北美自由貿易組織(NAFTA)走廊的運作。墨西哥製造業的復甦正在推動進出口平衡演算法的發展,以最大限度地減少產業叢集的里程。各地區對數據共用的監管立場仍然相對寬鬆,這使得司機行為培訓和節油儀錶板得以快速實施。
亞太地區是成長最快的市場,年複合成長率高達14.82%,主要得益於主要城市的交通擁擠和政府主導的數位化物流措施。印度的ULIP已在500多家承運商之間建立了標準化的資料管道,使小規模承運商也能利用共用的最佳化引擎,而無需進行專有系統整合。在中國5G涵蓋的大都會圈,雜貨和小包裹配送車隊可以在不到一秒的時間內完成路線重新計算;而在日本,由於加班時間限制,為了在限制駕駛人工作時間的情況下維持貨運暢通,必須大幅提高生產率。東南亞的成長則得益於以智慧型手機為中心的商務、雲端運算的普及以及需要一體化港口物流的出口導向製造業園區的興起。
在歐洲,受環境法規的推動,人工智慧驅動的路線最佳化正穩步發展。覆蓋超過250個城市的低排放區對運輸時限和負載容量都有限制,而只有人工智慧驅動的路線最佳化才能經濟高效地滿足這些要求。歐盟數位運輸和物流論壇已發布標準化應用程式介面(API),以降低跨境貨運的合規成本。然而,GDPR下嚴格的同意規則限制了群眾外包遙測資料的使用,迫使供應商率先開發隱私權保護型學習技術,例如聯邦最佳化和差分遮罩。
其他好處:
- Excel格式的市場預測(ME)表
- 3個月的分析師支持
目錄
第1章:引言
- 研究假設和市場定義
- 調查範圍
第2章:調查方法
第3章執行摘要
第4章 市場狀況
- 市場概覽
- 市場促進因素
- 電子商務小包裹量的爆炸性成長
- 在都市區低排放氣體區強制引進駕駛輔助系統。
- 利用 5G 技術對零工經濟中的車隊進行即時最佳化。
- 融合了遠端資訊處理技術和人工智慧路線引擎。
- 降低採用者。
- 各國智慧物流計畫(例如歐盟的DTLF、印度的ULIP等)
- 市場限制因素
- 群眾外包駕駛資料集中的複雜資料權利
- 促進要素對過於擁擠的送貨時間表表示不滿
- 新興市場農村網路地圖精度的局限性
- 分散的「最後一公里」監管規定推高了合規成本。
- 產業價值鏈分析
- 宏觀經濟因素的影響
- 監理情勢
- 技術展望
- 波特五力分析
第5章 市場規模與成長預測
- 按解決方案組件
- 軟體平台
- 服務
- 按最終用戶行業分類
- 按需送餐服務
- 零售和快速消費品
- 現場服務
- 叫車和計程車服務
- 醫療和藥品
- 其他終端用戶產業
- 按組織規模
- 小型企業
- 大公司
- 部署模式
- 雲
- 現場
- 按地區
- 北美洲
- 美國
- 加拿大
- 墨西哥
- 南美洲
- 巴西
- 阿根廷
- 其他南美國家
- 歐洲
- 德國
- 英國
- 法國
- 義大利
- 西班牙
- 其他歐洲國家
- 亞太地區
- 中國
- 日本
- 韓國
- 印度
- 新加坡
- 澳洲
- 其他亞太國家
- 中東和非洲
- 中東
- 沙烏地阿拉伯
- 阿拉伯聯合大公國
- 土耳其
- 其他中東國家
- 非洲
- 南非
- 奈及利亞
- 埃及
- 其他非洲國家
- 中東
- 北美洲
第6章 競爭情勢
- 市場集中度
- 策略趨勢
- 市佔率分析
- 公司簡介
- Trimble Inc.
- Verizon Connect Solutions Inc.
- The Descartes Systems Group Inc.
- Omnitracs LLC
- ORTEC BV
- ESRI Global Inc.
- Caliper Corporation
- PTV Planung Transport Verkehr GmbH
- Paragon Software Systems PLC
- Microlise Group PLC
- Route4Me LLC
- Routific Solutions Inc.
- InsightGeeks Solutions Pvt. Ltd(TrackoBit)
- WorkWave LLC
- Wise Systems Inc.
- Bringg Delivery Technologies Ltd.
- FarEye Technologies Pvt. Ltd.
- Locus.sh(Marble Automation Pvt. Ltd.)
- OptimoRoute Inc.
- Mapbox Inc.
第7章 市場機會與未來展望
According to Mordor Intelligence, the route optimization software market size was valued at USD 7.92 billion in 2025 and estimated to grow from USD 8.98 billion in 2026 to reach USD 16.78 billion by 2031, at a CAGR of 13.32% during the forecast period (2026-2031).
This report is Segmented by Solution Component (Software Platforms and Services), End-User Vertical (On-Demand Food Delivery, Retail and FMCG, and More), Size of Organization (Small and Medium Enterprises and Large Enterprises), Deployment Mode (Cloud and On-Premise), and Geography. The Market Forecasts are Provided in Terms of Value (USD).
Global Route Optimization Software Market Trends and Insights
Explosive Growth in E-commerce Parcel Volume
E-commerce parcels soared to multibillion annual counts, collapsing legacy hub-and-spoke models and forcing software providers to handle millions of dynamic delivery points within tight windows. Amazon alone processed over five billion packages in 2024, underscoring the need for algorithms that juggle inventory proximity, micro-fulfillment center locations, and real-time traffic predictions. High-density urban drops now require machine-learning engines able to pre-optimize routes from historical demand, weather, and driver behavior data. Platforms unable to deliver millisecond-level recalculations lose relevance as retailers scale omnichannel services and same-day promises.
5G-enabled Real-time Optimization for Gig-Economy Fleets
Millisecond latency from 5G and Multi-Access Edge Computing turns batch scheduling into continuous optimization. Food-delivery platforms leverage local network edges to recompute routes instantly when orders surge or traffic bottlenecks emerge. Edge nodes cut round-trip computation times to 1-10 milliseconds, meaning a driver can receive an updated drop sequence before the next traffic light. Coverage is still city-centric, so rural fleets experience fewer gains until national roll-outs mature.
Complex Data Rights in Crowdsourced Driving Datasets
GDPR and similar statutes curtail the volume and granularity of behavioral data available for machine-learning pipelines. Software vendors must embed consent management, data lineage tracking, and selective deletion workflows that inflate compliance overhead. Smaller vendors lacking dedicated legal teams face barriers to cross-border expansion, nudging market concentration upward as well-capitalized players absorb compliance costs.
Other drivers and restraints analyzed in the detailed report include:
- Convergence of Telematics and AI-powered Route Engines
- Dynamic Pricing Models Lowering TCO for SMB Adopters
- Driver Push-back Against Hyper-dense Delivery Schedules
For complete list of drivers and restraints, kindly check the Table Of Contents.
Segment Analysis
Software platforms retained a 62.15% stake in the Route Optimization Software market share during 2025, reflecting their role as the backbone of automated dispatch systems. Consulting and integration services, though smaller in absolute value, are growing at 14.08% CAGR as enterprises grapple with multi-vendor IT landscapes and change-management hurdles. Implementers re-engineer warehouse workflows, transportation management system interfaces, and CRM notifications to unlock software-promised savings. Vendors increasingly bundle advisory engagements, recognizing that platform deployments without process redesign rarely achieve double-digit delivery-cost reductions.
Enterprises also lean on services teams for ongoing model-tuning, benchmarking, and edge-case exception handling, which are critical once fleets scale beyond pilot districts. As a result, recurring optimization-as-a-service contracts are cannibalizing perpetual licenses, smoothing revenue streams for providers. The Route Optimization Software market size allocated to professional services is expected to cross USD 4.72 billion by 2031, signaling a shift toward outcome-based collaboration models.
Retail and FMCG suppliers dominated revenue, yet on-demand food delivery is accelerating with a 15.03% CAGR as 30-minute promise windows become a competitive baseline. The Route Optimization Software market size tied to meal-delivery fleets will exceed USD 2.32 billion by 2031, fueled by dynamic rider pools and perishable payloads that demand real-time recalculations. Algorithms must re-optimize routes every few minutes, balancing heat-loss constraints and kitchen throughput.
Field services, healthcare, and ride-hailing each require tailored constraint libraries, temperature monitoring for pharmaceuticals, technician skill matching, or driver re-positioning models. Such verticalization spurs vendors to release plug-ins rather than one-size-fits-all engines, fragmenting the platform landscape but lifting total addressable value across specialized niches.
Complete Report Scope:
- By Solution Component
- Software Platforms
- Services
- By End-user Vertical
- On-Demand Food Delivery
- Retail and FMCG
- Field Services
- Ride Hailing and Taxi Services
- Healthcare and Pharmaceuticals
- Other End-user Verticals
- By Size of the Organization
- Small and Medium Enterprises
- Large Enterprises
- By Deployment Mode
- Cloud
- On-Premise
- By Geography
- North America
- United States
- Canada
- Mexico
- South America
- Brazil
- Argentina
- Rest of South America
- Europe
- Germany
- United Kingdom
- France
- Italy
- Spain
- Rest of Europe
- Asia-Pacific
- China
- Japan
- South Korea
- India
- Singapore
- Australia
- Rest of Asia-Pacific
- Middle East and Africa
- Middle East
- Saudi Arabia
- United Arab Emirates
- Turkey
- Rest of Middle East
- Africa
- South Africa
- Nigeria
- Egypt
- Rest of Africa
- Middle East
- North America
Geography Analysis
North America commanded 38.05% of 2025 revenue, buoyed by e-commerce maturity and acute driver shortages that make algorithmic mileage savings mission-critical. Amazon's proprietary systems set benchmarks that ripple through competitors, while Canada leverages cross-border modules to synchronize NAFTA corridors. Mexico's manufacturing upswing drives inbound-outbound balancing algorithms that minimize empty miles across industrial clusters. Regional regulatory stances toward data sharing remain comparatively lenient, enabling rapid roll-out of driver-behavior training and fuel-savings dashboards.
Asia-Pacific is the fastest-expanding theatre, clocking a 14.82% CAGR on the back of megacity congestion and state-sponsored digital logistics schemes. India's ULIP ushers standardized data pipes among 500-plus carriers, allowing small fleets to tap shared optimization engines without bespoke integrations. China's 5G-blanketed metros support sub-second recalculations for grocery and parcel delivery swarms, while Japan's "2024 Problem" overtime cap mandates productivity jumps to keep freight flowing despite constrained driver hours. Southeast Asian growth rides on smartphone-first commerce, cloud penetration, and rising export-oriented manufacturing zones requiring synchronized port logistics.
Europe exhibits steady uptake driven by environmental regulation. Low-emission zones across more than 250 cities impose time-window and payload constraints that only AI-enhanced routing can satisfy economically. The EU's Digital Transport and Logistics Forum releases harmonized APIs that trim compliance costs for cross-border consignments. Yet GDPR's stringent consent rules restrain crowdsourced telemetry usage, nudging vendors to pioneer privacy-preserving learning techniques such as federated optimization and differential masking.
- Trimble Inc.
- Verizon Connect Solutions Inc.
- The Descartes Systems Group Inc.
- Omnitracs LLC
- ORTEC B.V.
- ESRI Global Inc.
- Caliper Corporation
- PTV Planung Transport Verkehr GmbH
- Paragon Software Systems PLC
- Microlise Group PLC
- Route4Me LLC
- Routific Solutions Inc.
- InsightGeeks Solutions Pvt. Ltd (TrackoBit)
- WorkWave LLC
- Wise Systems Inc.
- Bringg Delivery Technologies Ltd.
- FarEye Technologies Pvt. Ltd.
- Locus.sh (Marble Automation Pvt. Ltd.)
- OptimoRoute Inc.
- Mapbox Inc.
Additional Benefits:
- The market estimate (ME) sheet in Excel format
- 3 months of analyst support
TABLE OF CONTENTS
1 INTRODUCTION
- 1.1 Study Assumptions and Market Definition
- 1.2 Scope of the Study
2 RESEARCH METHODOLOGY
3 EXECUTIVE SUMMARY
4 MARKET LANDSCAPE
- 4.1 Market Overview
- 4.2 Market Drivers
- 4.2.1 Explosive growth in e-commerce parcel volume
- 4.2.2 Driver-assistance mandates from urban low-emission zones
- 4.2.3 5G-enabled real-time optimization for gig economy fleets
- 4.2.4 Convergence of telematics and AI-powered route engines
- 4.2.5 Dynamic pricing models lowering TCO for SMB adopters
- 4.2.6 National smart-logistics programs (e.g., EU DTLF, India ULIP)
- 4.3 Market Restraints
- 4.3.1 Complex data rights in crowdsourced driving datasets
- 4.3.2 Driver push-back against hyper-dense delivery schedules
- 4.3.3 Limited map accuracy in emerging markets rural networks
- 4.3.4 Fragmented last-mile regulations raising compliance cost
- 4.4 Industry Value Chain Analysis
- 4.5 Impact of Macroeconomic Factors
- 4.6 Regulatory Landscape
- 4.7 Technological Outlook
- 4.8 Porter's Five Forces Analysis
- 4.8.1 Bargaining Power of Suppliers
- 4.8.2 Bargaining Power of Buyers
- 4.8.3 Threat of New Entrants
- 4.8.4 Threat of Substitutes
- 4.8.5 Degree of Competition
5 MARKET SIZE AND GROWTH FORECASTS (VALUES)
- 5.1 By Solution Component
- 5.1.1 Software Platforms
- 5.1.2 Services
- 5.2 By End-user Vertical
- 5.2.1 On-Demand Food Delivery
- 5.2.2 Retail and FMCG
- 5.2.3 Field Services
- 5.2.4 Ride Hailing and Taxi Services
- 5.2.5 Healthcare and Pharmaceuticals
- 5.2.6 Other End-user Verticals
- 5.3 By Size of the Organization
- 5.3.1 Small and Medium Enterprises
- 5.3.2 Large Enterprises
- 5.4 By Deployment Mode
- 5.4.1 Cloud
- 5.4.2 On-Premise
- 5.5 By Geography
- 5.5.1 North America
- 5.5.1.1 United States
- 5.5.1.2 Canada
- 5.5.1.3 Mexico
- 5.5.2 South America
- 5.5.2.1 Brazil
- 5.5.2.2 Argentina
- 5.5.2.3 Rest of South America
- 5.5.3 Europe
- 5.5.3.1 Germany
- 5.5.3.2 United Kingdom
- 5.5.3.3 France
- 5.5.3.4 Italy
- 5.5.3.5 Spain
- 5.5.3.6 Rest of Europe
- 5.5.4 Asia-Pacific
- 5.5.4.1 China
- 5.5.4.2 Japan
- 5.5.4.3 South Korea
- 5.5.4.4 India
- 5.5.4.5 Singapore
- 5.5.4.6 Australia
- 5.5.4.7 Rest of Asia-Pacific
- 5.5.5 Middle East and Africa
- 5.5.5.1 Middle East
- 5.5.5.1.1 Saudi Arabia
- 5.5.5.1.2 United Arab Emirates
- 5.5.5.1.3 Turkey
- 5.5.5.1.4 Rest of Middle East
- 5.5.5.2 Africa
- 5.5.5.2.1 South Africa
- 5.5.5.2.2 Nigeria
- 5.5.5.2.3 Egypt
- 5.5.5.2.4 Rest of Africa
- 5.5.5.1 Middle East
- 5.5.1 North America
6 COMPETITIVE LANDSCAPE
- 6.1 Market Concentration
- 6.2 Strategic Moves
- 6.3 Market Share Analysis
- 6.4 Company Profiles (includes Global level Overview, Market level overview, Core Segments, Financials as available, Strategic Information, Market Rank/Share for key companies, Products and Services, and Recent Developments)
- 6.4.1 Trimble Inc.
- 6.4.2 Verizon Connect Solutions Inc.
- 6.4.3 The Descartes Systems Group Inc.
- 6.4.4 Omnitracs LLC
- 6.4.5 ORTEC B.V.
- 6.4.6 ESRI Global Inc.
- 6.4.7 Caliper Corporation
- 6.4.8 PTV Planung Transport Verkehr GmbH
- 6.4.9 Paragon Software Systems PLC
- 6.4.10 Microlise Group PLC
- 6.4.11 Route4Me LLC
- 6.4.12 Routific Solutions Inc.
- 6.4.13 InsightGeeks Solutions Pvt. Ltd (TrackoBit)
- 6.4.14 WorkWave LLC
- 6.4.15 Wise Systems Inc.
- 6.4.16 Bringg Delivery Technologies Ltd.
- 6.4.17 FarEye Technologies Pvt. Ltd.
- 6.4.18 Locus.sh (Marble Automation Pvt. Ltd.)
- 6.4.19 OptimoRoute Inc.
- 6.4.20 Mapbox Inc.
7 MARKET OPPORTUNITIES AND FUTURE OUTLOOK
- 7.1 White-space and Unmet-need assessment

 基於人工智慧的路線最佳化市場預測至2034年-全球分析(按組件、部署模式、技術、路線類型、應用、最終用戶和地區分類)
 路線最佳化軟體市場規模、佔有率、趨勢和預測:按解決方案、部署類型、企業規模、行業和地區分類(2026-2034 年)
 2026年全球路線最佳化軟體市場報告2026年全球船舶航線最佳化人工智慧(AI)市場報告街道級路線最佳化市場預測至2034年-按組件、功能、企業規模、技術、應用、最終用戶和地區分類的全球分析
 引導帳戶匹配和路由軟體市場分析及至 2035 年的預測:按類型、產品類型、服務、技術、組件、應用、部署類型、最終用戶、功能和解決方案分類
 車輛路線最佳化軟體市場規模、佔有率、成長及全球產業分析:按類型、應用和地區分類的洞察,2026-2034 年預測
 路線最佳化軟體市場 - 全球產業規模、佔有率、趨勢、機會及預測(按解決方案、部署模式、公司規模、垂直產業、地區和競爭格局分類,2021-2031 年)
 2026-2030年全球路線最佳化軟體市場
 動態路線最佳化軟體市場機會、成長促進因素、產業趨勢分析及預測(2025-2034年)