


 |
市場調查報告書
商品編碼
2124270
低程式碼開發平台:市場佔有率分析、產業趨勢與統計及成長預測(2026-2031)Low-code Development Platform - Market Share Analysis, Industry Trends & Statistics, Growth Forecasts (2026 - 2031) |
||||||

※ 本網頁內容可能與最新版本有所差異。詳細情況請與我們聯繫。
據 Mordor Intelligence 稱,低程式碼開發平台的市場規模預計在 2026 年達到 315.9 億美元,高於 2025 年的 263 億美元,預計到 2031 年將達到 789.4 億美元。
預計從 2026 年到 2031 年,其複合年成長率將達到 20.12%。
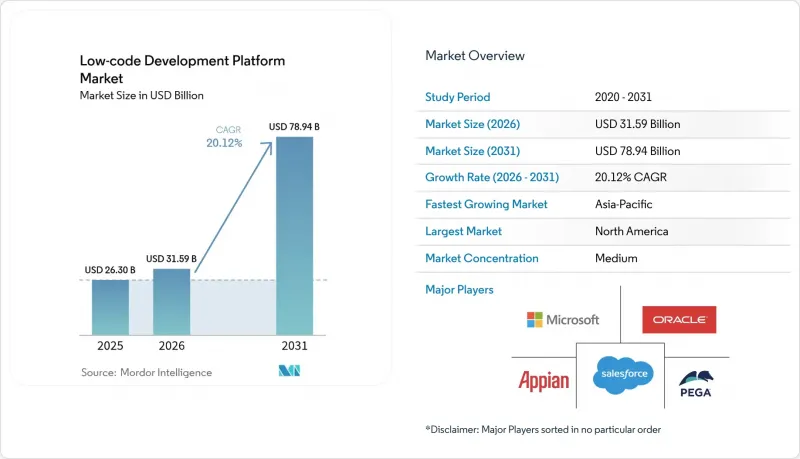
本報告按元件(平台、其他)、應用程式類型(基於 Web 的應用、基於行動裝置的應用程式、其他)、部署模式(本地部署、雲端部署)、組織規模(中小企業、大型企業)、產業(銀行、金融服務和保險 (BFSI)、零售和電子商務、其他)以及地區進行細分。市場預測以美元 (USD) 為單位。
全球低程式碼開發平台市場趨勢及洞察
美國聯邦政府機構透過低代碼採購強制對傳統 COBOL 系統進行現代化改造。
聯邦政府機構正在逐步淘汰使用了數十年的 COBOL 平台,並透過多供應商綜合採購契約,以低代碼系統取而代之,將合約成本降低 23%。國防合約管理署 (DCMA) 在其 2025 年現代化資訊徵詢書 (RFI) 中,將低代碼系統列為整合合約管理的首選工具。各州現在也紛紛效法這些聯邦模式,擴大支出規模,並將低程式碼平台鞏固為公共部門快速現代化的標準。能夠證明符合 FedRAMP 和 DoD IL5 標準的供應商將優先參與這一不斷擴大的採購趨勢,進一步推動低程式碼開發平台市場的成長。
歐盟的即時可組合銀行計畫正在加速低程式碼技術的普及。
金融資料存取法規要求歐洲銀行在2027年前透過API開放客戶資料。與之配套的是《數位營運韌性法案》,該法案加強了對資訊通訊技術風險的監管,並鼓勵金融機構轉向能夠適應每週規則更新的敏捷架構。低程式碼平台透過產生合規的API和自動化管理證據來滿足這兩項需求。歐洲中央銀行監管機構已正式製定了雲端外包要求,用於評估模組化服務部署。因此,傳統銀行正依靠低程式碼開發平台市場的低程式碼工具來跟上金融科技新興企業快速迭代的腳步。
由於專有運轉時環境導致的廠商鎖定推高了遷移成本。
2024 年一項經過同行評審的研究發布了雲端供應商鎖定預測框架,該框架量化了切換風險,並揭示了與專有運行時綁定的應用程式的高昂成本風險。許多低程式碼系統由於編譯後會進入封閉的執行引擎,因此可移植性有限。資訊長現在要求提供原始程式碼匯出和容器化部署選項,這導致採購週期延長,並抑制了部分低程式碼開發平台市場的發展。
細分市場分析
預計到2025年,平台細分市場將佔總收入的71.35%,成為低程式碼開發平台市場的基礎。企業傾向於選擇能夠整合視覺化建模、流程協作和整合資料庫的統一環境,從而抑制工具的過度氾濫。諸如Salesforce以80億美元收購Informatica等產業重組舉措,正在將資料管理和人工智慧整合到單一執行時間環境中,進一步加深了企業對供應商的依賴。隨著平台的普及,服務範圍也不斷擴展。聯邦政府機構對特定供應商的標準化需求,持續推動對整合諮詢、管治框架和人工智慧輔助設計的需求。
儘管服務領域規模較小,但隨著企業尋求合作夥伴來遷移 COBOL 工作負載、整合 ESG 分析以及培訓 GenAI 輔助駕駛員,該領域正以 23.45% 的複合年成長率成長。這種不斷成長的諮詢需求推高了高級支援和託管服務的合約價格,為業界帶來了持續的收入來源。在整個預測期內,除了許可證之外,提供培訓、資料架構調優和 AI 模型管治等服務的供應商將能夠使其生命週期價值翻番,並擴大市場佔有率。
即使到了2025年,儘管Web應用程式仍將佔總支出的54.40%,但隨著現場技術人員和遠端辦公人員對「離線優先」功能的需求日益成長,行動工作負載正以22.63%的複合年成長率持續成長。相機、生物識別和擴增實境(AR)的原生插件正使行動體驗更加豐富和情境化。面向行動應用場景的低程式碼開發平台市場規模預計將快速擴張,尤其是在保險檢驗和公共產業維護領域。
以 API 為中心的設計正在擴展 Web 和行動應用程式,並與可組合的銀行服務和開放資料政策相契合。微軟計劃將 Dynamics 365 的整體式介面轉向任務導向的 AI 代理,凸顯了介面與互動更加緊密結合的趨勢。提供響應式設計、一鍵式 PWA 產生和安全離線同步功能的供應商,預計將在尋求多通路統一性的組織中逐步提升市場佔有率。
區域分析
在聯邦政府現代化和成熟的創投生態系統的推動下,北美預計到2025年將佔全球收入的30.60%。美國政府逐步淘汰COBOL語言並嚴格遵守FedRAMP標準,為各省政府機構樹立了典範,並為司法、交通和醫療保健等行業的可複製部署奠定了基礎。在加拿大,低程式碼技術正被用於加速金融科技授權和數位身分專案的核准,並推動全部區域的成長動能。創業投資持續支持整合人工智慧的低程式碼新創公司,推動產品創新,從而支撐低程式碼開發平台市場的發展。
亞太地區以21.13%的複合年成長率領先。日本保險公司正在採用符合IFRS 17準則、可隨時用於審計的建構器,而新加坡金融管理局則鼓勵快速部署金融科技沙箱。中國正在為海灣國家的超大規模資料中心提供資金,並提供符合西方標準的自主雲端平台,用於託管運行時環境。印度IT服務巨頭正在將低代碼加速器整合到全球轉型項目中,在擴大出口收入的同時,也加快了國內公共部門的採用。這些努力共同推動了該地區對未來低程式碼開發平台市場成長的重大貢獻。
歐洲的監管影響力左右著全球產品藍圖。歐洲央行的雲端標準、開放銀行API的採用期限以及ESG資訊揭露義務,正迫使企業迅速實現合規自動化。北歐各國政府正透過低程式碼入口網站提供公民服務;德國汽車製造商不顧效能方面的擔憂,仍在開發現場應用程式原型;法國公共產業公司也在整合ESG報告流程。隨著這些舉措不斷推進並產生協同效應,歐洲將繼續成為蓬勃發展的低程式碼開發平台市場的基石。
其他好處
- Excel格式的市場預測(ME)表
- 3個月的分析師支持
目錄
第1章:引言
- 研究假設和市場定義
- 調查範圍
第2章:調查方法
第3章執行摘要
第4章 市場狀況
- 市場概覽
- 市場促進因素
- 美國聯邦政府機構透過低代碼採購強制對傳統 COBOL 系統進行現代化改造。
- 透過歐盟的即時可組合銀行計畫加速低程式碼技術的應用
- 亞太地區保險公司低代碼審計追蹤獲得監管部門批准。
- 平台內的 GenAI 協同駕駛功能可將開發週期縮短 40%。
- 歐盟的 ESG 報告截止日期正在推動應用程式使用需求的快速成長。
- 市場限制因素
- 由於專有運轉時環境導致的廠商鎖定推高了遷移成本。
- 運算密集型工業IoT應用中的效能限制
- 資料居住要求阻礙了中東地區「雲端優先」策略的採用。
- 監管和技術展望
- 新技術的發展趨勢
- 波特五力分析
- 供應商市場分析
- 投資分析
第5章 市場規模與成長預測
- 按組件
- 平台
- 服務
- 按應用程式類型
- 基於網路的
- 移動基地
- 基於桌面/伺服器
- 以 API 為中心和微服務
- 部署模式
- 雲
- 現場
- 按組織規模
- 小型企業
- 大公司
- 按行業
- 銀行業
- 金融和保險(BFSI)
- 零售與電子商務
- 政府/國防
- 資訊科技/通訊
- 醫療保健和生命科學
- 製造業
- 能源與公共產業
- 教育
- 媒體與娛樂
- 其他(交通運輸、房地產)
- 按地區
- 北美洲
- 美國
- 加拿大
- 墨西哥
- 南美洲
- 巴西
- 阿根廷
- 其他南美國家
- 歐洲
- 英國
- 德國
- 法國
- 義大利
- 西班牙
- 北歐的
- 其他歐洲國家
- 亞太地區
- 中國
- 印度
- 日本
- 韓國
- 澳洲
- 其他亞太國家
- 中東和非洲
- 南非
- 沙烏地阿拉伯
- 阿拉伯聯合大公國
- 奈及利亞
- 其他中東和非洲國家
- 北美洲
第6章 競爭情勢
- 市場集中度
- 策略趨勢
- 市佔率分析
- 公司簡介
- Microsoft Corporation
- Salesforce Inc.
- Appian Corporation
- Oracle Corporation
- Mendix(Business of Siemens)
- OutSystems Inc.
- ServiceNow Inc.
- Magic Software Enterprises Ltd.
- Quickbase Inc.
- Zoho Corporation
- Clear Software LLC
- Temenos(前身為 Kony 公司)
- AgilePoint Inc.
- Betty Blocks BV
- Creatio Global
- Kissflow Inc.
- Nintex Global Ltd.
- GeneXus International SA
- LANSA Inc.
- Newgen Software Technologies
- WaveMaker Inc.
第7章 市場機會與未來展望
According to Mordor Intelligence, low-code development platform market size in 2026 is estimated at USD 31.59 billion, growing from 2025 value of USD 26.30 billion with 2031 projections showing USD 78.94 billion, growing at 20.12% CAGR over 2026-2031.
This report is Segmented by Component (Platform and More), Application Type (Web-Based, Mobile-Based, and More), Deployment Type (On-Premises, Cloud), Organization Size (Small and Medium Enterprises, Large Enterprises), Industry Vertical (BFSI, Retail and E-Commerce, and More), and Geography. The Market Forecasts are Provided in Terms of Value (USD).
Global Low-code Development Platform Market Trends and Insights
Mandated modernization of legacy COBOL systems in U.S. federal agencies via low-code procurement
Federal departments are retiring decades-old COBOL platforms and replacing them with low-code systems through multi-award blanket purchase agreements that lower contract overhead by 23% . The Defense Contract Management Agency highlighted low-code in its 2025 modernization RFI as the preferred path for integrated contract management. States now replicate these federal templates, expanding addressable spend and cementing low-code platforms as the public-sector default for rapid modernization. Vendors able to verify FedRAMP and DoD IL5 compliance gain privileged access to this growing procurement wave, supporting further growth for the low-code development platform market.
Real-time composable banking initiatives in the EU accelerating low-code adoption
The Financial Data Access regulation obliges European banks to expose customer data via APIs by 2027. Complementary Digital Operational Resilience Act rules tighten ICT risk oversight and push institutions toward agile architectures that can adapt to weekly rule updates. Low-code platforms answer both needs by generating compliant APIs and automating control evidence. Supervisors at the European Central Bank have formalized cloud-outsourcing expectations that reward modular service deployment. Traditional banks therefore rely on low-code tooling to match the release velocity of fintech challengers across the low-code development platform market.
Proprietary runtime vendor lock-in elevating migration costs
A 2024 peer-reviewed study introduced a cloud vendor lock-in prediction framework that quantifies switching risk and reveals high cost exposures for applications bound to proprietary runtimes. Many low-code systems compile workflows into closed execution engines that limit portability. CIOs now require source-code export and containerized deployment options, slowing purchase cycles and suppressing a portion of the low-code development platform market.
Other drivers and restraints analyzed in the detailed report include:
- APAC insurers' regulatory approval of low-code audit trails
- GenAI copilots within platforms reducing build-cycle time by 40%
- Performance limitations for compute-intensive industrial IoT apps
For complete list of drivers and restraints, kindly check the Table Of Contents.
Segment Analysis
The platform segment represented 71.35% revenue in 2025 and anchors the low-code development platform market. Enterprises favor unified environments that combine visual modelling, process orchestration, and integrated databases, thereby reducing tool sprawl. Consolidation plays such as Salesforce's USD 8 billion acquisition of Informatica fold data management and AI into a single runtime to deepen enterprise lock-in. Service-line expansion follows platform rollout: federal agencies that standardize on one vendor generate continuous demand for integration consulting, governance frameworks, and AI-prompt design.
Services, while smaller, are growing at 23.45% CAGR as organizations look for partners to migrate COBOL workloads, embed ESG analytics, and train GenAI copilots. This advisory wave lifts attach rates for premium support and managed services, adding recurring revenue layers to the industry. Over the forecast, vendors that package training, data-fabric tuning, and AI-model governance alongside licences can double lifetime value and widen the market.
Web apps still controlled 54.40% spending in 2025, yet mobile workloads are rising at 22.63% CAGR as field technicians and remote employees demand offline-first capabilities. Native plug-ins for camera, biometrics, and augmented reality make mobile experiences richer and more contextual. The low-code development platform market size for mobile use cases is projected to grow rapidly, especially in insurance inspections and utility maintenance.
API-centric designs extend both web and mobile apps, aligning with composable-banking and open-data directives. Microsoft's planned shift from monolithic Dynamics 365 screens to task-oriented AI agents underlines how interfaces will dissolve into contextual micro-interactions. Vendors that ship responsive design, one-click PWA generation, and secure offline sync will capture incremental market share among organizations pursuing multi-channel parity.
Complete Report Scope:
- By Component
- Platform
- Services
- By Application Type
- Web-Based
- Mobile-Based
- Desktop / Server-Based
- API-Centric & Micro-Services
- By Deployment Mode
- Cloud
- On-Premise
- By Organization Size
- Small and Medium Enterprises
- Large Enterprises
- By Industry Vertical
- Banking
- Financial Services and Insurance (BFSI)
- Retail and E-commerce
- Government and Defense
- Information Technology and Telecom
- Healthcare and Life Sciences
- Manufacturing
- Energy and Utilities
- Education
- Media and Entertainment
- Others (Transportation, Real Estate)
- By Geography
- North America
- United States
- Canada
- Mexico
- South America
- Brazil
- Argentina
- Rest of South America
- Europe
- United Kingdom
- Germany
- France
- Italy
- Spain
- Nordics
- Rest of Europe
- Asia-Pacific
- China
- India
- Japan
- South Korea
- Australia
- Rest of Asia-Pacific
- Middle East and Africa
- South Africa
- Saudi Arabia
- United Arab Emirates
- Nigeria
- Rest of Middle East and Africa
- North America
Geography Analysis
North America held 30.60% revenue in 2025, driven by federal modernization and a mature venture ecosystem. The U.S. government's push to sunset COBOL and enforce FedRAMP compliance sets a template for state agencies, seeding repeatable rollouts across justice, transport, and health. Canada leverages low-code to expedite fintech licensing and digital-identity projects, broadening regional momentum. Venture capital continues to back AI-infused low-code startups, fuelling product innovation that sustains the low-code development platform market.
Asia-Pacific posts the fastest 21.13% CAGR. Japan's insurers adopted audit-ready builders for IFRS 17, while Singapore's Monetary Authority encourages rapid fintech sandboxing. China finances hyperscale data centers in Gulf states, offering sovereign clouds that host Western-compatible runtimes. India's IT-services leaders embed low-code accelerators within global transformation deals, amplifying export revenue while catalyzing local public-sector uptake. These initiatives collectively underpin the region's outsized contribution to future low-code development platform market growth.
Europe wields regulatory influence that shapes global product roadmaps. ECB cloud standards, open-banking API deadlines, and ESG disclosure mandates force enterprises to automate compliance fast. Nordic governments deliver citizen services via low-code Portals, Germany's auto OEMs prototype shop-floor apps despite performance caveats, and French utilities integrate ESG reporting pipelines. With policy momentum compounding, Europe remains a cornerstone of the expanding low-code development platform market.
- Microsoft Corporation
- Salesforce Inc.
- Appian Corporation
- Oracle Corporation
- Mendix (Business of Siemens)
- OutSystems Inc.
- ServiceNow Inc.
- Magic Software Enterprises Ltd.
- Quickbase Inc.
- Zoho Corporation
- Clear Software LLC
- Temenos (formerly Kony Inc.)
- AgilePoint Inc.
- Betty Blocks B.V.
- Creatio Global
- Kissflow Inc.
- Nintex Global Ltd.
- GeneXus International SA
- LANSA Inc.
- Newgen Software Technologies
- WaveMaker Inc.
Additional Benefits:
- The market estimate (ME) sheet in Excel format
- 3 months of analyst support
TABLE OF CONTENTS
1 INTRODUCTION
- 1.1 Study Assumptions & Market Definition
- 1.2 Scope of the Study
2 RESEARCH METHODOLOGY
3 EXECUTIVE SUMMARY
4 MARKET LANDSCAPE
- 4.1 Market Overview
- 4.2 Market Drivers
- 4.2.1 Mandated Modernization of Legacy COBOL Systems in U.S. Federal Agencies via Low-Code Procurement
- 4.2.2 Real-Time Composable Banking Initiatives in EU Accelerating Low-Code Adoption
- 4.2.3 APAC Insurers Regulatory Approval of Low-Code Audit Trails
- 4.2.4 GenAI Copilots Within Platforms Reducing Build-Cycle Time by 40%
- 4.2.5 EU ESG Reporting Deadlines Driving Rapid App Deployment Demand
- 4.3 Market Restraints
- 4.3.1 Proprietary Runtime Vendor Lock-In Elevating Migration Costs
- 4.3.2 Performance Limitations for Compute-Intensive Industrial IoT Apps
- 4.3.3 Data-Residency Barriers Hampering Cloud-First Deployments in Middle East
- 4.4 Regulatory or Technological Outlook
- 4.4.1 Emerging Technology Trends
- 4.5 Porter's Five Forces Analysis
- 4.5.1 Bargaining Power of Suppliers
- 4.5.2 Bargaining Power of Consumers
- 4.5.3 Threat of New Entrants
- 4.5.4 Threat of Substitute Products
- 4.5.5 Intensity of Competitive Rivalry
- 4.6 Vendor Market Positioning Analysis
- 4.7 Investment Analysis
5 MARKET SIZE AND GROWTH FORECASTS (VALUE)
- 5.1 By Component
- 5.1.1 Platform
- 5.1.2 Services
- 5.2 By Application Type
- 5.2.1 Web-Based
- 5.2.2 Mobile-Based
- 5.2.3 Desktop / Server-Based
- 5.2.4 API-Centric & Micro-Services
- 5.3 By Deployment Mode
- 5.3.1 Cloud
- 5.3.2 On-Premise
- 5.4 By Organization Size
- 5.4.1 Small and Medium Enterprises
- 5.4.2 Large Enterprises
- 5.5 By Industry Vertical
- 5.5.1 Banking
- 5.5.2 Financial Services and Insurance (BFSI)
- 5.5.3 Retail and E-commerce
- 5.5.4 Government and Defense
- 5.5.5 Information Technology and Telecom
- 5.5.6 Healthcare and Life Sciences
- 5.5.7 Manufacturing
- 5.5.8 Energy and Utilities
- 5.5.9 Education
- 5.5.10 Media and Entertainment
- 5.5.11 Others (Transportation, Real Estate)
- 5.6 By Geography
- 5.6.1 North America
- 5.6.1.1 United States
- 5.6.1.2 Canada
- 5.6.1.3 Mexico
- 5.6.2 South America
- 5.6.2.1 Brazil
- 5.6.2.2 Argentina
- 5.6.2.3 Rest of South America
- 5.6.3 Europe
- 5.6.3.1 United Kingdom
- 5.6.3.2 Germany
- 5.6.3.3 France
- 5.6.3.4 Italy
- 5.6.3.5 Spain
- 5.6.3.6 Nordics
- 5.6.3.7 Rest of Europe
- 5.6.4 Asia-Pacific
- 5.6.4.1 China
- 5.6.4.2 India
- 5.6.4.3 Japan
- 5.6.4.4 South Korea
- 5.6.4.5 Australia
- 5.6.4.6 Rest of Asia-Pacific
- 5.6.5 Middle East and Africa
- 5.6.5.1 South Africa
- 5.6.5.2 Saudi Arabia
- 5.6.5.3 United Arab Emirates
- 5.6.5.4 Nigeria
- 5.6.5.5 Rest of Middle East and Africa
- 5.6.1 North America
6 COMPETITIVE LANDSCAPE
- 6.1 Market Concentration
- 6.2 Strategic Moves
- 6.3 Market Share Analysis
- 6.4 Company Profiles (includes Global level Overview, Market level overview, Core Segments, Financials as available, Strategic Information, Market Rank/Share for key companies, Products and Services, and Recent Developments)
- 6.4.1 Microsoft Corporation
- 6.4.2 Salesforce Inc.
- 6.4.3 Appian Corporation
- 6.4.4 Oracle Corporation
- 6.4.5 Mendix (Business of Siemens)
- 6.4.6 OutSystems Inc.
- 6.4.7 ServiceNow Inc.
- 6.4.8 Magic Software Enterprises Ltd.
- 6.4.9 Quickbase Inc.
- 6.4.10 Zoho Corporation
- 6.4.11 Clear Software LLC
- 6.4.12 Temenos (formerly Kony Inc.)
- 6.4.13 AgilePoint Inc.
- 6.4.14 Betty Blocks B.V.
- 6.4.15 Creatio Global
- 6.4.16 Kissflow Inc.
- 6.4.17 Nintex Global Ltd.
- 6.4.18 GeneXus International SA
- 6.4.19 LANSA Inc.
- 6.4.20 Newgen Software Technologies
- 6.4.21 WaveMaker Inc.
7 MARKET OPPORTUNITIES AND FUTURE OUTLOOK
- 7.1 White-Space and Unmet-Need Assessment

 全球低程式應用開發平台市場規模、佔有率、趨勢和成長分析報告(2026-2034)
 低程式碼開發平台市場-2026-2032年全球市場預測
 低程式碼行動應用開發平台:市場佔有率分析、產業趨勢和統計數據以及成長預測(2026-2031 年)
 無程式碼開發平台市場預測至 2034 年—按組件、部署類型、企業規模、應用程式、最終用戶和地區分類的全球分析低程式碼應用開發平台市場:2026-2032年全球市場預測(按組件、開發方法、定價模式、用例、最終用戶產業、部署模式和組織規模分類)
 全球低程式碼人工智慧平台市場:按組件、人工智慧功能、部署、應用、企業規模和最終用戶產業分類-市場規模、產業動態、機會分析和預測(2026-2035 年)
 低程式碼應用開發平台市場規模、佔有率和成長分析:按組件、部署模式、應用、企業規模、最終用戶產業和地區分類-2026-2033年產業預測
 無程式碼人工智慧平台市場規模、佔有率和成長分析:按組件、部署類型、應用、產業和地區分類-2026-2033年產業預測低程式碼人工智慧開發平台市場預測至2034年:按組件、部署類型、企業規模、技術、應用、最終用戶和地區分類的全球分析
 2026-2030年全球低程式碼人工智慧平台市場