


 |
市場調查報告書
商品編碼
2124167
3D感測與影像:市場佔有率分析、產業趨勢與統計、成長預測(2026-2031年)3D Sensing And Imaging - Market Share Analysis, Industry Trends & Statistics, Growth Forecasts (2026 - 2031) |
||||||

※ 本網頁內容可能與最新版本有所差異。詳細情況請與我們聯繫。
根據 Mordor Intelligence 預測,3D 感測和成像市場將從 2025 年的 131.6 億美元成長到 2026 年的 149.8 億美元,然後在 2031 年達到 286.5 億美元,2026 年至 2031 年的複合年成長率為 13.84%。
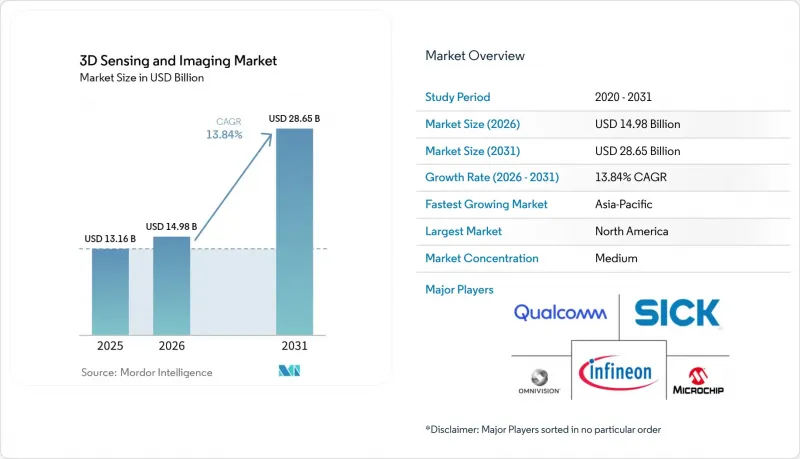
本報告按組件(硬體、軟體、服務)、技術(超音波、結構光等)、感測器類型(位置感測器、影像感測器等)、連接方式(有線網路連接、無線網路連接)、終端用戶產業(家用電子電器、汽車等)和地區進行細分。市場預測以美元計價。
全球3D感測與成像市場趨勢及洞察
結構光3D相機在智慧型手機中的普及
曾經僅限於高階旗艦機型的結構光深度模組,如今已在中階智慧型手機中普及,降低了部署成本,並提升了用戶對太空攝影、擴增實境遊戲和安全臉部認證的期望。蘋果在 iPhone 15 Pro 中搭載的LiDAR模組凸顯了消費者對空間運算的需求,而安卓手機廠商也迅速推出了經濟高效的結構光解決方案。 OmniVision 於 2025 年 4 月發布的駕駛員監控的 150 萬像素全局百葉窗感測器,展現了該技術從智慧型手機到汽車的輻射效應,進一步深化了規模經濟。產量的增加已將組件價格降至 1 美元以下,加速了其在工業掃描儀和攜帶式醫療設備中的應用。
汽車高級駕駛輔助系統對固態雷射雷達深度圖的需求日益成長。
汽車製造商正逐步淘汰旋轉式LiDAR頭,轉而採用固態調頻連續波(FMCW)雷射雷達,後者俱有抗振性、速度測量功能和更低的成本。戴姆勒卡車公司計劃於2024年採用Aeva公司的FMCW雷射雷達,凸顯了業界對用於L4級自動駕駛卡車車隊的晶片級深度感測器的信心。雖然車輛類型認證會延長研發週期,但隨著ADAS在價格更低的車型中日益普及,擁有良好無缺陷製造記錄的一級供應商預計將繼續獲得設計訂單。
高功率GaAs外延片供不應求
砷化鎵 (GaAs)基板的生產仍然集中在亞太地區的少數幾家製造商手中,導致用於遠程飛行時間 (ToF) 模組的高功率垂直腔面發射雷射 (VCSEL) 價格飆升,前置作業時間長達 20 週。感測器製造商正在重新設計光學元件以降低峰值電流消耗,並探索使用氮化矽光電作為風險對沖手段,但短期供應限制仍然限制汽車雷射雷達的部署進度。
細分市場分析
到2025年,硬體將佔3D感測和成像市場72.15%的佔有率,但隨著買家對承包部署和基於結果的定價的需求不斷成長,預計到2031年,服務業將以14.88%的複合年成長率成長。 Faro Technologies目前20.9%的季度收入來自軟體和持續的雲端分析服務,這表明校準、維護和AI模型更新正在產生持續的收入來源。供應商正在將部署和終身支援打包,以確保簽訂多年契約,收入結構正逐步向服務轉型。
對能夠將深度圖壓縮成可操作事件的邊緣人工智慧工具鏈的需求,進一步推動了軟體附加率的成長。這些純硬體業務利潤率的下降,迫使組件供應商與雲端和中間件供應商合作,從而確保生態系統的穩定性以及數據驅動的提升銷售潛力。
即使到了2025年,飛行時間(ToF)技術仍維持著43.25%的市佔率。這是因為其矽光電二極體和VCSEL驅動器的成本符合智慧型手機的預算,從而確保了每年數十億台設備的需求。同時,基於超音波的3D感測和成像系統的市場規模預計將以每年15.62%的速度成長,因為聲學換能器在強光和半透明材料環境中表現良好。在工業機器人領域,光學和超音波相結合的混合方法正被用於檢測光亮金屬中的缺陷;而在醫院,超音波深度探頭則因其無輻射特性而成為胎兒和心臟成像的首選。感測器設計人員正在利用3D堆疊CMOS技術創建感測叢集,將超音波接收電路和光學成像器置於同一位置,並根據環境切換檢測方法。
區域分析
到2025年,北美憑藉其在汽車和醫療設備製造領域的強大實力,將以37.85%的市佔率引領市場,而亞太地區則以15.74%的複合年成長率快速成長。中國行動電話和契約製造巨頭正透過減少物料清單(BOM)來推動深度攝影機的應用,而日本精密機械製造商則提高了品質檢測標準,要求實現微米級3D影像擷取。韓國顯示器製造商正在部署線上3D輪廓測量技術來檢驗下一代OLED堆疊。在印度,利用衛星3D土壤濕度測繪來最佳化作物產量的試點計畫正在進行中,這表明智慧農業正在被廣泛應用。歐洲在Euro NCAP法規和鼓勵投資機器視覺的工業自動化津貼的推動下,維持了穩健的市場表現。
其他好處:
- Excel格式的市場預測(ME)表
- 3個月的分析師支持
目錄
第1章:引言
- 研究假設和市場定義
- 調查範圍
第2章:調查方法
第3章執行摘要
第4章 市場狀況
- 市場概覽
- 市場促進因素
- 結構化光學3D相機已廣泛應用於智慧型手機。
- 汽車高級駕駛輔助系統對固態雷射雷達深度圖的需求日益成長。
- 工業4.0中3D機器視覺檢測系統的引進
- 向醫療領域微創、即時3D影像的過渡
- 用於深度感測器的VCSEL-on-CMOS晶片現在售價低於1美元。
- 利用衛星建構3D地球觀測衛星群進行氣候分析
- 市場限制因素
- 高功率GaAs外延片供應鏈供不應求。
- 多感測器相機模組校準的複雜性
- 身分驗證中深度圖欺騙引發的網路安全風險
- 關於在公共空間收集3D生物識別資料的監管不確定性
- 產業價值鏈分析
- 監理情勢
- 技術展望
- 宏觀經濟因素的影響
- 波特五力分析
第5章 市場規模與成長預測
- 按組件
- 硬體
- 軟體
- 服務
- 透過技術
- 超音波
- 結構光
- 飛行時間法
- 立體視覺
- 其他技術
- 依感測器類型
- 位置感測器
- 影像感測器
- 溫度感測器
- 加速計
- 接近感測器
- 其他感測器類型
- 連結性別
- 有線網路連接
- 無線網路連線
- 按最終用戶行業分類
- 家用電子產品
- 車
- 衛生保健
- 航太/國防
- 安全監控
- 媒體與娛樂
- 其他終端用戶產業
- 按地區
- 北美洲
- 美國
- 加拿大
- 墨西哥
- 南美洲
- 巴西
- 阿根廷
- 智利
- 其他南美國家
- 歐洲
- 德國
- 英國
- 法國
- 義大利
- 西班牙
- 其他歐洲國家
- 亞太地區
- 中國
- 日本
- 韓國
- 印度
- 新加坡
- 澳洲
- 其他亞太國家
- 中東和非洲
- 中東
- 沙烏地阿拉伯
- 阿拉伯聯合大公國
- 土耳其
- 其他中東國家
- 非洲
- 南非
- 奈及利亞
- 埃及
- 其他非洲國家
- 中東
- 北美洲
第6章 競爭情勢
- 市場集中度
- 策略趨勢
- 市佔率分析
- 公司簡介
- Infineon Technologies AG
- Microchip Technology Inc.
- OmniVision Technologies Inc.
- Qualcomm Inc.
- Sick AG
- Keyence Corporation
- Texas Instruments Incorporated
- GE Healthcare Technologies Inc.
- STMicroelectronics NV
- Alphabet Inc.(Google LLC)
- Adobe Inc.
- Autodesk Inc.
- Panasonic Holdings Corporation
- Trimble Inc.
- FARO Technologies Inc.
- Lockheed Martin Corporation
- Dassault Systemes SE
- Sony Group Corporation
- Lumentum Holdings Inc.
- ams-OSRAM AG
第7章 市場機會與未來展望
According to Mordor Intelligence, the 3D sensing and imaging market size is expected to grow from USD 13.16 billion in 2025 to USD 14.98 billion in 2026 and is forecast to reach USD 28.65 billion by 2031 at 13.84% CAGR over 2026-2031.
This report is Segmented by Component (Hardware, Software, and Services), Technology (Ultrasound, Structured Light, and More), Sensor Type (Position Sensors, Image Sensors, and More), Connectivity (Wired Network Connectivity and Wireless Network Connectivity), End-User Industry (Consumer Electronics, Automotive, and More), and Geography. The Market Forecasts are Provided in Terms of Value (USD).
Global 3D Sensing And Imaging Market Trends and Insights
Widespread Smartphone Integration of Structured-Light 3D Cameras
Structured-light depth modules once reserved for premium flagships are now commonplace in mid-range handsets, lowering entry costs and normalizing user expectations for spatial photography, AR gaming, and secure face authentication. Apple's iPhone 15 Pro LiDAR module validated consumer appetite for spatial computing, while Android OEMs rapidly released cost-reduced structured-light solutions. OmniVision's April 2025 unveiling of a 1.5-megapixel global-shutter sensor for driver monitoring illustrates technology spillover from phones to vehicles, deepening economies of scale. Volume ramp-ups push component pricing toward the sub-USD 1 threshold, unlocking adoption in industrial scanners and handheld medical devices.
Automotive ADAS Demand for Solid-State LiDAR Depth Maps
Vehicle makers are phasing out rotating LiDAR heads in favor of solid-state frequency-modulated continuous-wave (FMCW) units that offer vibration tolerance, velocity measurement, and lower cost. Daimler Truck's 2024 selection of Aeva FMCW LiDAR underscored industry confidence in chip-scale depth sensors for Level 4 trucking fleets. Although automotive homologation extends timelines, Tier-1 suppliers with zero-defect manufacturing credentials stand to gain recurring design wins as ADAS moves down the vehicle price curve.
Supply-Chain Scarcity of High-Power GaAs Epi-Wafers
Gallium arsenide substrate output remains concentrated among a handful of Asia-Pacific growers, creating price spikes and 20-week lead times for high-power VCSELs used in long-range time-of-flight modules. Sensor makers redesign optics for lower peak current draw and pursue silicon nitride photonics as a hedge, but near-term unit allocations still constrain automotive LiDAR rollout schedules.
Other drivers and restraints analyzed in the detailed report include:
- Industry 4.0 Adoption of 3D Machine-Vision Inspection Systems
- Healthcare Shift Toward Minimally Invasive, Real-Time 3D Imaging
- Calibration Complexity Across Multi-Sensor Camera Modules
For complete list of drivers and restraints, kindly check the Table Of Contents.
Segment Analysis
Hardware retained 72.15% of the 3D sensing and imaging market in 2025, yet services are growing 14.88% CAGR to 2031 as buyers seek turnkey deployments and outcome-based pricing. Faro Technologies now derives 20.9% of quarterly revenue from software and recurring cloud analytics, illustrating how calibration, maintenance, and AI model updates create annuity streams. Vendors package installation and lifetime support to secure multi-year deals, gradually tilting revenue mix toward services.
Demand for edge AI tool-chains that compress depth maps into actionable events further propels software attach rates. This erosion of pure-play hardware margins pressures component suppliers to form alliances with cloud and middleware providers, ensuring ecosystem stickiness and data-driven upsell potential.
Time-of-flight kept a 43.25% share in 2025 because its silicon photodiodes and VCSEL drivers align with smartphone cost envelopes, securing billions of annual units. The 3D sensing and imaging market size for ultrasound-based systems, however, is projected to expand 15.62% annually as acoustic transducers excel in bright-sunlight and translucent-material scenarios. Industrial robotics adopts hybrid optical-ultrasound stacks for defect detection on glossy metals, while hospitals favor ultrasound depth probes for radiation-free fetal and cardiac imaging. Sensor designers leverage 3D-stacked CMOS to co-locate ultrasound receive circuits and optical imagers, yielding sensing clusters that toggle modality based on the environment.
Complete Report Scope:
- By Component
- Hardware
- Software
- Services
- By Technology
- Ultrasound
- Structured Light
- Time-of-Flight
- Stereoscopic Vision
- Other Technologies
- By Sensor Type
- Position Sensors
- Image Sensors
- Temperature Sensors
- Accelerometer Sensors
- Proximity Sensors
- Other Sensor Types
- By Connectivity
- Wired Network Connectivity
- Wireless Network Connectivity
- By End-user Industry
- Consumer Electronics
- Automotive
- Healthcare
- Aerospace and Defense
- Security and Surveillance
- Media and Entertainment
- Other End-user Industries
- By Geography
- North America
- United States
- Canada
- Mexico
- South America
- Brazil
- Argentina
- Chile
- Rest of South America
- Europe
- Germany
- United Kingdom
- France
- Italy
- Spain
- Rest of Europe
- Asia-Pacific
- China
- Japan
- South Korea
- India
- Singapore
- Australia
- Rest of Asia-Pacific
- Middle East and Africa
- Middle East
- Saudi Arabia
- United Arab Emirates
- Turkey
- Rest of Middle East
- Africa
- South Africa
- Nigeria
- Egypt
- Rest of Africa
- Middle East
- North America
Geography Analysis
North America led with 37.85% revenue in 2025, owing to entrenched automotive and medical-device manufacturers, yet Asia-Pacific is climbing 15.74% CAGR. Chinese handset and contract-manufacturing giants compress bill-of-materials to democratize depth cameras, while Japanese precision-machinery firms elevate quality inspection standards that require micron-level 3D capture. Korean display producers deploy in-line 3D profilometers to validate next-gen OLED stacks. India pilots satellite-based 3D soil-moisture mapping to optimize crop yields, signaling broader smart-agriculture uptake. Europe remains steady, driven by Euro NCAP mandates and industrial automation subsidies that reward machine vision investments.
- Infineon Technologies AG
- Microchip Technology Inc.
- OmniVision Technologies Inc.
- Qualcomm Inc.
- Sick AG
- Keyence Corporation
- Texas Instruments Incorporated
- GE Healthcare Technologies Inc.
- STMicroelectronics N.V.
- Alphabet Inc. (Google LLC)
- Adobe Inc.
- Autodesk Inc.
- Panasonic Holdings Corporation
- Trimble Inc.
- FARO Technologies Inc.
- Lockheed Martin Corporation
- Dassault Systemes SE
- Sony Group Corporation
- Lumentum Holdings Inc.
- ams-OSRAM AG
Additional Benefits:
- The market estimate (ME) sheet in Excel format
- 3 months of analyst support
TABLE OF CONTENTS
1 INTRODUCTION
- 1.1 Study Assumptions and Market Definition
- 1.2 Scope of the Study
2 RESEARCH METHODOLOGY
3 EXECUTIVE SUMMARY
4 MARKET LANDSCAPE
- 4.1 Market Overview
- 4.2 Market Drivers
- 4.2.1 Widespread smartphone integration of structured-light 3D cameras
- 4.2.2 Automotive ADAS demand for solid-state LiDAR depth maps
- 4.2.3 Industry 4.0 adoption of 3D machine-vision inspection systems
- 4.2.4 Healthcare shift toward minimally-invasive, real-time 3D imaging
- 4.2.5 Emergence of VCSEL-on-CMOS chiplets for sub-USD 1 depth sensors
- 4.2.6 Satellite-based 3D Earth-observation constellations for climate analytics
- 4.3 Market Restraints
- 4.3.1 Supply-chain scarcity of high-power GaAs epi-wafers
- 4.3.2 Calibration complexity across multi-sensor camera modules
- 4.3.3 Cyber-security risks from depth-map spoofing in authentication
- 4.3.4 Regulatory uncertainty on public-space 3D biometric data capture
- 4.4 Industry Value Chain Analysis
- 4.5 Regulatory Landscape
- 4.6 Technological Outlook
- 4.7 Impact of Macroeconomic Factors
- 4.8 Porter's Five Forces Analysis
- 4.8.1 Bargaining Power of Suppliers
- 4.8.2 Bargaining Power of Consumers
- 4.8.3 Threat of New Entrants
- 4.8.4 Threat of Substitutes
- 4.8.5 Intensity of Competitive Rivalry
5 MARKET SIZE AND GROWTH FORECASTS (VALUES)
- 5.1 By Component
- 5.1.1 Hardware
- 5.1.2 Software
- 5.1.3 Services
- 5.2 By Technology
- 5.2.1 Ultrasound
- 5.2.2 Structured Light
- 5.2.3 Time-of-Flight
- 5.2.4 Stereoscopic Vision
- 5.2.5 Other Technologies
- 5.3 By Sensor Type
- 5.3.1 Position Sensors
- 5.3.2 Image Sensors
- 5.3.3 Temperature Sensors
- 5.3.4 Accelerometer Sensors
- 5.3.5 Proximity Sensors
- 5.3.6 Other Sensor Types
- 5.4 By Connectivity
- 5.4.1 Wired Network Connectivity
- 5.4.2 Wireless Network Connectivity
- 5.5 By End-user Industry
- 5.5.1 Consumer Electronics
- 5.5.2 Automotive
- 5.5.3 Healthcare
- 5.5.4 Aerospace and Defense
- 5.5.5 Security and Surveillance
- 5.5.6 Media and Entertainment
- 5.5.7 Other End-user Industries
- 5.6 By Geography
- 5.6.1 North America
- 5.6.1.1 United States
- 5.6.1.2 Canada
- 5.6.1.3 Mexico
- 5.6.2 South America
- 5.6.2.1 Brazil
- 5.6.2.2 Argentina
- 5.6.2.3 Chile
- 5.6.2.4 Rest of South America
- 5.6.3 Europe
- 5.6.3.1 Germany
- 5.6.3.2 United Kingdom
- 5.6.3.3 France
- 5.6.3.4 Italy
- 5.6.3.5 Spain
- 5.6.3.6 Rest of Europe
- 5.6.4 Asia-Pacific
- 5.6.4.1 China
- 5.6.4.2 Japan
- 5.6.4.3 South Korea
- 5.6.4.4 India
- 5.6.4.5 Singapore
- 5.6.4.6 Australia
- 5.6.4.7 Rest of Asia-Pacific
- 5.6.5 Middle East and Africa
- 5.6.5.1 Middle East
- 5.6.5.1.1 Saudi Arabia
- 5.6.5.1.2 United Arab Emirates
- 5.6.5.1.3 Turkey
- 5.6.5.1.4 Rest of Middle East
- 5.6.5.2 Africa
- 5.6.5.2.1 South Africa
- 5.6.5.2.2 Nigeria
- 5.6.5.2.3 Egypt
- 5.6.5.2.4 Rest of Africa
- 5.6.5.1 Middle East
- 5.6.1 North America
6 COMPETITIVE LANDSCAPE
- 6.1 Market Concentration
- 6.2 Strategic Moves
- 6.3 Market Share Analysis
- 6.4 Company Profiles (includes Global level Overview, Market level overview, Core Segments, Financials as available, Strategic Information, Market Rank/Share for key companies, Products and Services, and Recent Developments)
- 6.4.1 Infineon Technologies AG
- 6.4.2 Microchip Technology Inc.
- 6.4.3 OmniVision Technologies Inc.
- 6.4.4 Qualcomm Inc.
- 6.4.5 Sick AG
- 6.4.6 Keyence Corporation
- 6.4.7 Texas Instruments Incorporated
- 6.4.8 GE Healthcare Technologies Inc.
- 6.4.9 STMicroelectronics N.V.
- 6.4.10 Alphabet Inc. (Google LLC)
- 6.4.11 Adobe Inc.
- 6.4.12 Autodesk Inc.
- 6.4.13 Panasonic Holdings Corporation
- 6.4.14 Trimble Inc.
- 6.4.15 FARO Technologies Inc.
- 6.4.16 Lockheed Martin Corporation
- 6.4.17 Dassault Systemes SE
- 6.4.18 Sony Group Corporation
- 6.4.19 Lumentum Holdings Inc.
- 6.4.20 ams-OSRAM AG
7 MARKET OPPORTUNITIES AND FUTURE OUTLOOK
- 7.1 White-space and Unmet-need Assessment

 2034年3D感測器市場預測-按感測器類型、技術、應用、終端用戶產業和地區分類的全球分析
 3D感測器:市場佔有率分析、產業趨勢與統計、成長預測(2026-2031年)
 3D感測器市場-2026-2032年全球市場預測
 全球3D感測器市場:按類型、技術、應用、終端用戶產業和地區分類-預測至2032年
 全球3D感測技術市場規模、佔有率、趨勢和成長分析報告(2026-2034年)
 3D磁位置感測器IC市場報告:趨勢、預測與競爭分析(至2035年)非接觸式3D霍爾感測器市場報告:趨勢、預測及競爭分析(至2035年)非接觸式磁性位置感測器IC市場報告:趨勢、預測和競爭分析(至2035年)非接觸式磁性位置感測器市場報告:趨勢、預測和競爭分析(至2035年)ToF 3D感測器市場預測至2034年—按產品類型、技術、應用、最終用戶和地區分類的全球分析