


 |
市場調查報告書
商品編碼
2124129
歐洲風電:市場佔有率分析、產業趨勢與統計及成長預測(2026-2031 年)Europe Wind Power - Market Share Analysis, Industry Trends & Statistics, Growth Forecasts (2026 - 2031) |
||||||

※ 本網頁內容可能與最新版本有所差異。詳細情況請與我們聯繫。
根據 Mordor Intelligence 預測,歐洲風電市場(以裝置容量計算)預計將從 2026 年的 336.90 吉瓦成長到 2031 年的 479.25 吉瓦,在預測期(2026-2031 年)內複合年成長率為 7.30%。
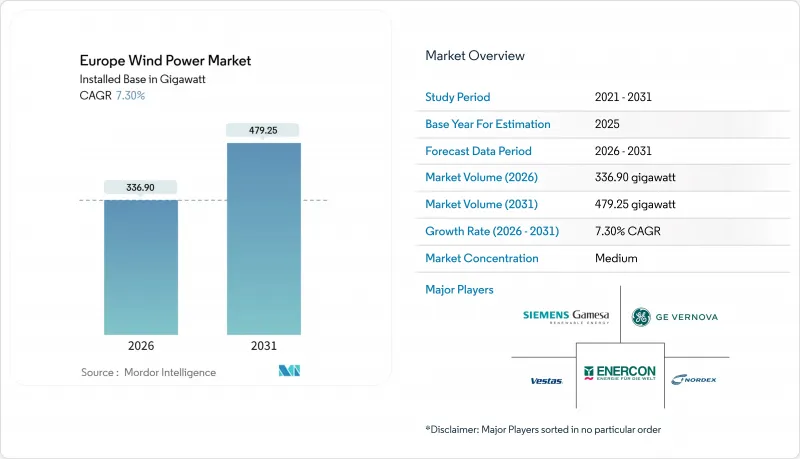
本報告按安裝地點(陸上和海上)、渦輪機輸出功率(3MW以下、3-6MW、6MW以上)、應用領域(公用事業規模、商業/工業、社區項目)以及地區(德國、英國、法國、西班牙、義大利、波蘭、瑞典、丹麥和其他歐洲國家)進行細分。市場規模和預測以裝置容量(GW)為單位。
歐洲風電市場趨勢與洞察
歐盟綠色交易和「適合55歲」目標
該立法方案要求成員國每兩年更新一次國家能源和氣候計劃,並將2030年可再生能源發電目標提高到45%。這意味著風電裝置容量將達到500吉瓦,比2025年的裝置容量高出63%。 2026年起對鋼鐵和水泥徵收碳邊境調節稅,將促使風塔和基礎的生產回歸歐洲大陸。德國決定在2025年撥款46億歐元用於電網強化,以便在2030年前將145吉瓦的風電併入電網。丹麥的「能源島」以10吉瓦的離岸風力發電為核心,並計畫出口剩餘電力,顯示跨境合作正在擴大各國的發電能力。因此,儘管面臨供應鏈方面的挑戰,這些政策的推進動能正使歐洲風電市場保持高速成長。
陸上和離岸風力發電機的平準化電成本快速下降
2024年,陸域風電的平準化度電成本(LCOE)降至0.043-0.092歐元/千瓦時,離岸風力發電的平準化度電成本降至0.055-0.103歐元/千瓦時,這主要得益於15兆瓦級平台降低了系統外成本。在英國2024年的差價合約(CfD)競標中,離岸風力發電的競標低於執行價格30%,顯示在需求強勁的地區,市場風險是可以接受的。波蘭陸上風電的競標價格首次低於燃煤發電的成本,加速了燃煤電廠的早期退役。維斯塔斯(Vestas)的V162-6.2兆瓦風力發電機組在2025年於德國內陸地區實現了48%的容量係數,證實了更大的轉子可以提高現有電站的發電效率。發電成本的下降為企業購電協議 (PPA) 提供了競爭性定價,凸顯了推動歐洲風電市場發展的成本優勢。
輸電網擁塞和互聯設施建設延誤。
德國2023年風電棄電量為8.2太瓦時,SuedLink和SuedOstLink輸電線路的完工時間延後至2028年,對納稅人造成了31億歐元的負擔。西班牙2023年棄電量為2.5太瓦時,英國電網備用容量達283吉瓦,但需等待七年才能投入使用。雖然1.4吉瓦的「NeuConnect」輸電線路運作了一些限制,但僅佔糾正歐洲大陸電力供需不平衡所需輸電容量的2%。儘管RWE在Cascaci的500兆瓦電池儲能專案已證明可以透過儲能恢復6個百分點的有效容量,但大規模輸電網的建設仍然是限制歐洲風電市場短期成長的關鍵瓶頸。
細分市場分析
浮體式平台的出現使得在水深超過60公尺的海域進行開發成為可能,推動離岸風電以17.2%的複合年成長率快速成長,是歐洲風電市場平均水準的兩倍。即使到了2025年,陸域風電資產仍將佔歐洲風電市場的85.5%,這主要得益於德國60吉瓦的裝置容量和西班牙30吉瓦的基礎設施。隨著蘇格蘭風能公司(ScotWind)10.5吉瓦的訂單以及波蘭在波羅的海地區8吉瓦的規劃項目,預計到2031年,離岸風電的比例將上升至22%。離岸風電專案可提供45-55%的裝置容量利用率和15年的差價合約(CfD),從而降低獲利風險,而待開發區風電的新建專案則面臨土地使用限制。透過 6MW 機組運作20 年前的風力發電機,固定聯網線路的發電量將增加兩倍,從而確保歐洲整體風電市場的平衡擴張,同時保持陸上風電的重要性。
第二代浮動式風力發電標準(IEC 61400-3-2)統一了相關要求,並將認證成本降低了15%。儘管離岸風力發電的前置作業時間仍比陸上風電長5-7年,但其高產能利用率彌補了這一不足,並吸引了大量資金。目前,陸域風電的成長主要集中在波蘭和瑞典,而丹麥和荷蘭則將重點轉向海上計畫。這種市場格局的變化為歐洲風電市場帶來了強勁的發展前景。
其他好處:
- Excel格式的市場預測(ME)表
- 3個月的分析師支持
目錄
第1章:引言
- 研究假設和市場定義
- 調查範圍
第2章:調查方法
第3章執行摘要
第4章 市場狀況
- 市場概覽
- 市場促進因素
- 歐盟綠色新政和「適合55歲」目標
- 陸上和離岸風力發電機的平準化電成本快速下降
- 企業對購電協議的需求激增
- 重新啟動已運作超過 15 年的陸上風力發電設施。
- 浮體式海上風電的商業化
- 新一代可回收刀片技術
- 市場限制因素
- 輸電網擁塞及網際網路絡建設延誤。
- 獲得許可的過程需要時間,而且會遭到當地居民的反對。
- 與生物多樣性(鳥類、海洋哺乳動物)相關的訴訟風險
- 稀土元素磁鐵供應鏈中的風險
- 供應鏈分析
- 監理情勢
- 技術展望
- 波特五力模型
第5章 市場規模與成長預測
- 按位置
- 陸上
- 離岸
- 按渦輪機容量
- 3兆瓦或以下
- 3~6 MW
- 6兆瓦或以上
- 透過使用
- 公用事業規模
- 商業和工業用途
- 社區計畫
- 按成分(定性分析)
- 機艙/渦輪機
- 刀刃
- 塔
- 發電機和齒輪箱
- Balance-of-System
- 按地區
- 德國
- 英國
- 法國
- 西班牙
- 義大利
- 波蘭
- 瑞典
- 丹麥
- 其他歐洲國家
第6章 競爭情勢
- 市場集中度
- 策略趨勢(併購、聯盟、購電協議)
- 市場佔有率分析(主要公司的市場排名和佔有率)
- 公司簡介
- Acciona Energia
- Orsted
- EDF Renewables
- E.ON
- Iberdrola Renovables
- RWE Renewables
- Vattenfall
- Statkraft
- EnBW
- General Electric
- Siemens Gamesa
- Vestas
- Nordex
- Enercon
- Goldwind Europe
- MingYang Europe
- LM Wind Power
- Prysmian Group
- Nexans
第7章 市場機會與未來展望
According to Mordor Intelligence, the Europe wind power market size in terms of installed base is expected to grow from 336.90 gigawatt in 2026 to 479.25 gigawatt by 2031, at a CAGR of 7.30% during the forecast period (2026-2031).
This report is Segmented by Location (Onshore and Offshore), Turbine Capacity (Up To 3 MW, 3 To 6 MW, and Above 6 MW), Application (Utility-Scale, Commercial and Industrial, and Community Projects), and Geography (Germany, United Kingdom, France, Spain, Italy, Poland, Sweden, Denmark, and Rest of Europe). The Market Sizes and Forecasts are Provided in Terms of Installed Capacity (GW).
Europe Wind Power Market Trends and Insights
EU Green Deal & Fit-for-55 Targets
The legislative package obliges member states to update national energy and climate plans every two years and lifts the 2030 renewable-electricity target to 45%, implying a 500 GW wind fleet, 63% above 2025 capacity. Carbon border adjustment on steel and cement from 2026 is steering tower and foundation production back into the continent. Germany earmarked EUR 4.6 billion in 2025 for grid reinforcement to integrate 145 GW of wind by 2030. Denmark's Energy Island will hub 10 GW of offshore wind and export surplus power, illustrating how transnational coordination multiplies national build-outs. Policy momentum, therefore, keeps the European wind power market on a high-growth trajectory despite supply-chain headwinds.
Rapid LCOE Decline of On- & Offshore Turbines
Onshore levelized costs slid to EUR 0.043-0.092 /kWh in 2024, while offshore costs fell to EUR 0.055-0.103 /kWh as 15 MW platforms trimmed balance-of-system expenses. The UK's 2024 CfD round cleared offshore bids 30% below the strike price, proving merchant risk tolerable in robust demand centers. Poland's onshore auction undercut coal generation for the first time, prompting accelerated plant retirements. Vestas' V162-6.2 MW turbine delivered a 48% capacity factor in inland Germany during 2025, underscoring how larger rotors boost yields on legacy sites. Declining generation costs underpin competitive pricing for corporate PPAs and confirm the cost advantage driving the European wind power market.
Grid Congestion & Weak Interconnection Build-Out
Germany curtailed 8.2 TWh of wind in 2023 at a taxpayer cost of EUR 3.1 billion as SuedLink and SuedOstLink slipped to 2028 completion. Spain faced 2.5 TWh in 2023 curtailments, and the UK's grid queue hit 283 GW with seven-year wait times. While the 1.4 GW NeuConnect link eased some constraints, only 2% of the transfer capacity needed to smooth continental imbalances is live. RWE's 500 MW battery at Kaskasi shows storage can claw back six percentage points of effective capacity, but large-scale transmission remains the critical bottleneck limiting near-term gains for the European wind power market.
Other drivers and restraints analyzed in the detailed report include:
- Surging Corporate PPA Demand
- Repowering of >15-Year Onshore Fleets
- Lengthy Permitting & Local Opposition
For complete list of drivers and restraints, kindly check the Table Of Contents.
Segment Analysis
Offshore wind is expanding at a 17.2% CAGR, double the European wind power market average, as floating platforms unlock water depths beyond 60 m. Onshore assets still represented 85.5% of the European wind power market size in 2025, grounded in Germany's 60 GW fleet and Spain's 30 GW base. ScotWind's 10.5 GW awards and Poland's 8 GW Baltic pipeline will lift offshore's share to 22% by 2031. Offshore projects carry 45-55% capacity factors and 15-year CfDs, de-risking revenues, whereas onshore greenfield builds battle land-use constraints. Repowering 20-year turbines with 6 MW machines triples output on fixed interconnections, preserving onshore relevance and ensuring a balanced expansion across the European wind power market.
Second-generation floating standards (IEC 61400-3-2) harmonize requirements, slicing certification costs by 15%. Offshore lead times of five to seven years remain longer than onshore, but capacity factors compensate, attracting capital. Onshore growth now clusters in Poland and Sweden, while Denmark and the Netherlands pivot toward sea-based projects. This evolving mix underpins a resilient deployment outlook for the Europe wind power market.
Complete Report Scope:
- By Location
- Onshore
- Offshore
- By Turbine Capacity
- Up to 3 MW
- 3 to 6 MW
- Above 6 MW
- By Application
- Utility-scale
- Commercial and Industrial
- Community Projects
- By Component (Qualitative Analysis)
- Nacelle/Turbine
- Blade
- Tower
- Generator and Gearbox
- Balance-of-System
- By Geography
- Germany
- United Kingdom
- France
- Spain
- Italy
- Poland
- Sweden
- Denmark
- Rest of Europe
List of Companies Covered in this Report:
- Acciona Energia
- Orsted
- EDF Renewables
- E.ON
- Iberdrola Renovables
- RWE Renewables
- Vattenfall
- Statkraft
- EnBW
- General Electric
- Siemens Gamesa
- Vestas
- Nordex
- Enercon
- Goldwind Europe
- MingYang Europe
- LM Wind Power
- Prysmian Group
- Nexans
Additional Benefits:
- The market estimate (ME) sheet in Excel format
- 3 months of analyst support
TABLE OF CONTENTS
1 Introduction
- 1.1 Study Assumptions & Market Definition
- 1.2 Scope of the Study
2 Research Methodology
3 Executive Summary
4 Market Landscape
- 4.1 Market Overview
- 4.2 Market Drivers
- 4.2.1 EU Green Deal & Fit-for-55 targets
- 4.2.2 Rapid LCOE decline of on- & offshore turbines
- 4.2.3 Surging corporate PPA demand
- 4.2.4 Repowering of >15-year onshore fleets
- 4.2.5 Commercialisation of floating offshore wind
- 4.2.6 Next-gen recyclable blade technology
- 4.3 Market Restraints
- 4.3.1 Grid congestion & weak interconnection build-out
- 4.3.2 Lengthy permitting & local opposition
- 4.3.3 Biodiversity litigation risk (birds, marine mammals)
- 4.3.4 Rare-earth magnet supply-chain exposure
- 4.4 Supply-Chain Analysis
- 4.5 Regulatory Landscape
- 4.6 Technological Outlook
- 4.7 Porter's Five Forces
- 4.7.1 Bargaining Power of Suppliers
- 4.7.2 Bargaining Power of Buyers
- 4.7.3 Threat of New Entrants
- 4.7.4 Threat of Substitutes
- 4.7.5 Competitive Rivalry
5 Market Size & Growth Forecasts
- 5.1 By Location
- 5.1.1 Onshore
- 5.1.2 Offshore
- 5.2 By Turbine Capacity
- 5.2.1 Up to 3 MW
- 5.2.2 3 to 6 MW
- 5.2.3 Above 6 MW
- 5.3 By Application
- 5.3.1 Utility-scale
- 5.3.2 Commercial and Industrial
- 5.3.3 Community Projects
- 5.4 By Component (Qualitative Analysis)
- 5.4.1 Nacelle/Turbine
- 5.4.2 Blade
- 5.4.3 Tower
- 5.4.4 Generator and Gearbox
- 5.4.5 Balance-of-System
- 5.5 By Geography
- 5.5.1 Germany
- 5.5.2 United Kingdom
- 5.5.3 France
- 5.5.4 Spain
- 5.5.5 Italy
- 5.5.6 Poland
- 5.5.7 Sweden
- 5.5.8 Denmark
- 5.5.9 Rest of Europe
6 Competitive Landscape
- 6.1 Market Concentration
- 6.2 Strategic Moves (M&A, Partnerships, PPAs)
- 6.3 Market Share Analysis (Market Rank/Share for key companies)
- 6.4 Company Profiles (includes Global level Overview, Market level overview, Core Segments, Financials as available, Strategic Information, Products & Services, and Recent Developments)
- 6.4.1 Acciona Energia
- 6.4.2 Orsted
- 6.4.3 EDF Renewables
- 6.4.4 E.ON
- 6.4.5 Iberdrola Renovables
- 6.4.6 RWE Renewables
- 6.4.7 Vattenfall
- 6.4.8 Statkraft
- 6.4.9 EnBW
- 6.4.10 General Electric
- 6.4.11 Siemens Gamesa
- 6.4.12 Vestas
- 6.4.13 Nordex
- 6.4.14 Enercon
- 6.4.15 Goldwind Europe
- 6.4.16 MingYang Europe
- 6.4.17 LM Wind Power
- 6.4.18 Prysmian Group
- 6.4.19 Nexans
7 Market Opportunities & Future Outlook
- 7.1 White-space & Unmet-need Assessment

 北美風力發電:市佔率分析、產業趨勢與統計及成長預測(2026-2031 年)
 船用風向標市場規模、佔有率和成長分析:按產品類型、顯示方式、應用、船舶類型、最終用戶和地區分類-2026-2033年產業預測
 風力渦輪機市場規模、佔有率和成長分析:按軸配置、主要運行應用、結構框架材質、最終用戶安裝類型和地區分類-2026-2033年產業預測
 風力發電市場:2026-2032年全球市場預測(按組件、技術類型、渦輪機類型、渦輪機尺寸、發電機類型、轉子轉速、軸設計和應用分類)
 風力發電市場規模、佔有率和趨勢分析報告:按安裝地點、應用、地區和細分市場預測(2026-2033 年)
 風力發電系統市場預測至2034年-按組件、類型、容量、安裝類型、應用、最終用戶和地區分類的全球分析風力發電:市場佔有率分析、產業趨勢與統計、成長預測(2026-2031 年)風力渦輪機控制器市場:控制器類型、產品、最終用戶、渦輪機類型、連接方式-2026-2032年全球市場預測
 2026年全球分散式風電市場報告2026年全球風力發電市場報告