


 |
市場調查報告書
商品編碼
2066520
風力發電:市場佔有率分析、產業趨勢與統計、成長預測(2026-2031 年)Wind Power - Market Share Analysis, Industry Trends & Statistics, Growth Forecasts (2026 - 2031) |
||||||

※ 本網頁內容可能與最新版本有所差異。詳細情況請與我們聯繫。
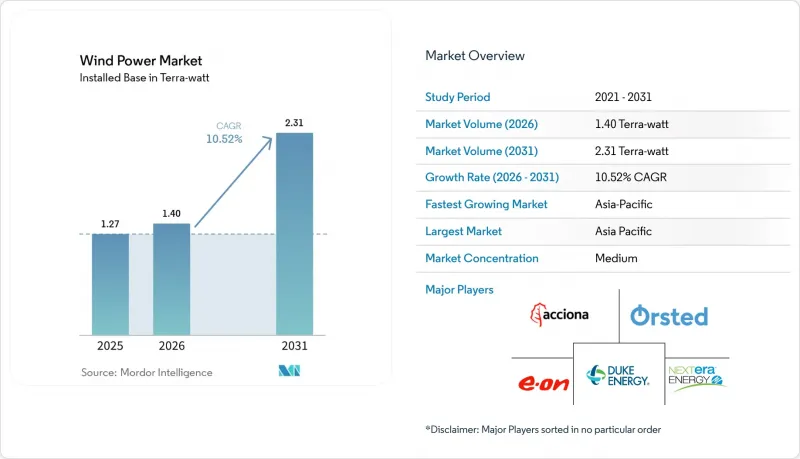
據 Mordor Intelligence 稱,2025 年風電市場價值為 1.27兆瓦,預計到 2031 年將達到 2.31兆瓦,而 2026 年為 1.4兆瓦,預測期(2026-2031 年)的複合年成長率為 10.52%。
本報告按安裝地點(陸上和海上)、渦輪機輸出功率(3MW以下、3-6MW、6MW以上)、應用領域(公用事業規模、商業/工業、社區項目)和地區(北美、歐洲、亞太、南美、中東和非洲)進行細分。市場規模和預測以裝置容量(GW)為單位。
全球風電市場趨勢及洞察
15兆瓦以上風力渦輪機的成本迅速下降
與小型風力發電機相比,大型風力發電機可將基礎、佈線和維護成本降低 15% 至 20%,從而在高輪轂高度下將容量利用率提高 8% 至 12%。 (1) 這些經濟優勢使開發商能夠開發先前商業性獲利能力受限的位置,並在許多離岸風位置實現市電平價上網。雖然葉片長度超過 100 公尺造成的運輸瓶頸仍然存在,但港口維修和重型裝運船隻的訂單表明,這種限制只是暫時的。由此帶來的資本效率提升使風電市場確保永續的成本競爭力。
資料中心營運商與企業簽訂的購電協議 (PPA) 數量激增。
大型雲端服務供應商正在簽訂為期 10 至 20 年的購電協議 (PPA),這些協議捆綁了電力、可再生能源證書 (REC) 和全天候清潔能源供應保障。這些協議可以降低新計畫的現金流風險,並鼓勵風電開發商擴大風電場規模,使其與資料中心的負載曲線相匹配,尤其是在北海電網互聯點和美國沿海電網附近。預計到 2040 年,人工智慧 (AI) 工作負載的電力需求將增加 35% 至 50%,屆時,採購可再生能源將成為企業營運的必需品,而不僅僅是企業社會責任 (CSR) 的一項舉措。
商品價格波動(鋼鐵、稀土元素)
鋼材約佔渦輪機品質的70%,現貨價格即使僅10%的波動,都可能導致專案資本支出變動高達3個百分點。由於70%的稀土元素磁鐵仍依賴中國市場,釹和鏑的供應衝擊將帶來更大的不確定性。一些原始設備製造商(OEM)正在考慮採用電勵磁發電機來避免使用這些金屬,但這種轉變可能會使效率降低約2%。 (2)
細分市場分析
到2025年,陸上風力發電機將佔裝置容量的92.45%,反映出其供應鏈的成熟和建造速度的加速。然而,受更強勁的風力、更少的土地使用糾紛以及浮體式基礎技術的進步的推動,預計到2031年,離岸風電資產的複合年成長率將達到15.62%。日本首個駁船式浮體式發電設施已證明其在颱風多發的深海域具有商業性可行性。目前,16兆瓦級風力渦輪機已成為離岸風電的標準配置,可以用更少的機組實現相同的發電量(兆瓦),從而縮短安裝時間並降低全生命週期成本。因此,風電市場正將重心轉向土地資源匱乏地區的離岸風電成長,而陸上風電改造則推動了成熟地區的成長。
新興國家的開發商由於資本投入較少且投資回報更快,更傾向於陸上建設,但浮體式基礎成本的下降正在改變這種現狀。隨著沿海電網的發展,海上發電可以平滑太陽能發電造成的白天高峰和夜間低谷,從而緩解併網難題。
區域分析
亞太地區預計將引領市場,到2025年將佔全球風電裝置容量的53.55%,並維持11.42%的複合年成長率直至2031年。光是中國一國在2024年就新增了76吉瓦的風電裝置容量,主要得益於陸上風電建設和南海離岸風電項目建設的雙雙創紀錄成長。印度的競標計畫目標是2030年達到140吉瓦的裝置容量,但各邦的電網升級改造速度未能跟上發電容量的成長。日本和韓國正著力發展浮體式電計畫以避免土地短缺,而越南則在探索將風電與綠色氨出口掛鉤的早期競標。因此,全部區域的風電市場正受益於一體化的供應鏈和政府的採購擔保。
歐洲在離岸風力發電創新領域處於領先地位。全球60%的離岸風力發電裝置容量集中在北海,丹麥和荷蘭正透過一站式機構縮短授權時間。 REPowerEU的本地採購規則正在重振西班牙、波蘭和法國的風力發電廠,而綠氫能先導工廠則正在開拓新的市場。在德國、丹麥和西班牙,透過在現有廠址安裝最先進的6兆瓦風力渦輪機,無需徵用新土地,即可對現有設施進行改造升級,從而提高發電容量。
在北美,發展勢頭並不均衡。雖然聯邦政府於2025年1月生效的海上新租賃禁令阻礙了新的土地收購,但並未影響正在進行的項目。來自18個州的檢察長已對此禁令提出質疑,最終的解決時間將由法院裁定。陸域風電在中西部電網中穩定成長,但PJM和MISO地區的申請延誤導致併網時間延長。 《通膨控制法案》雖然仍在等待立法澄清,但其對計畫的經濟可行性仍起到支持作用。
中東和非洲正崛起為風電市場新成長的前線。埃及10吉瓦的建設、擁有和營運合約以及摩洛哥的風氫混合能源中心,都體現了該地區的雄心壯志。奈米比亞和南非正計劃連接跨境電網,以充分利用其豐富的風能資源。拉丁美洲受惠於巴西南里奧格蘭德州和智利巴塔哥尼亞地區的豐富資源,但對長距離電網的投資仍需跟上,才能充分發揮其潛力。
其他好處:
- Excel格式的市場預測(ME)表
- 3個月的分析師支持
目錄
第1章:引言
- 研究假設和市場定義
- 調查範圍
第2章:調查方法
第3章執行摘要
第4章 市場狀況
- 市場概覽
- 市場促進因素
- 15兆瓦以上風力渦輪機的成本迅速下降
- 資料中心營運商與企業簽訂的購電協議 (PPA) 數量激增。
- 《通貨膨脹控制法案》和歐盟風能一攬子計劃
- 21世紀初陸上風力發電設施的重新激活
- 航運用綠色氫氣採購合約
- 人工智慧運維無人機的崛起
- 市場限制因素
- 商品價格波動(鋼鐵、稀土元素)
- 獲得許可證所需的時間很長(在歐盟平均超過 5 年)。
- 電網連接隊列擁塞
- 針對海上風力發電發電廠的反鯨魚訴訟案件日益增加。
- 供應鏈分析
- 監理情勢
- 技術展望(浮體式基礎,20兆瓦級)
- 波特五力模型
第5章 市場規模與成長預測
- 按安裝位置
- 土地
- 海上
- 按渦輪機輸出
- 3兆瓦或以下
- 3~6 MW
- 6兆瓦或以上
- 透過使用
- 公用事業規模
- 商業和工業用途
- 社區計畫
- 按成分(定性分析)
- 機艙/渦輪機
- 刀刃
- 塔
- 發電機和齒輪箱
- 系統周邊設備
- 按地區
- 北美洲
- 美國
- 加拿大
- 墨西哥
- 歐洲
- 德國
- 西班牙
- 英國
- 法國
- 挪威
- 土耳其
- 北歐(不包括挪威)
- 俄羅斯
- 其他歐洲國家
- 亞太地區
- 中國
- 印度
- 日本
- 越南
- 印尼
- 馬來西亞
- 泰國
- 其他亞太國家
- 南美洲
- 巴西
- 阿根廷
- 智利
- 哥倫比亞
- 其他南美國家
- 中東和非洲
- 沙烏地阿拉伯
- 阿拉伯聯合大公國
- 埃及
- 奈及利亞
- 卡達
- 其他中東和非洲國家
- 北美洲
第6章 競爭情勢
- 市場集中度
- 策略趨勢(併購、聯盟、購電協議)
- 市場佔有率分析(主要公司的市場排名和市場佔有率)
- 公司簡介
- Acciona Energia
- Duke Energy
- EDF
- Orsted
- NextEra Energy
- E.ON
- Iberdrola
- Enel Green Power
- Pattern Energy
- Invenergy
- General Electric Vernova
- Vestas
- Siemens Gamesa
- Goldwind
- Envision Energy
- MingYang Smart Energy
- Suzlon
- Nordex
- Enercon
- Dongfang Electric
- CSIC Haizhuang
第7章 市場機會與未來展望
According to Mordor Intelligence, the wind power market size was valued at 1.27 Terra-watt in 2025 and estimated to grow from 1.4 Terra-watt in 2026 to reach 2.31 Terra-watt by 2031, at a CAGR of 10.52% during the forecast period (2026-2031).
This report is Segmented by Location (Onshore and Offshore), Turbine Capacity (Up To 3 MW, 3 To 6 MW, and Above 6 MW), Application (Utility-Scale, Commercial and Industrial, and Community Projects), and Geography (North America, Europe, Asia-Pacific, South America, and Middle East and Africa). The Market Sizes and Forecasts are Provided in Terms of Installed Capacity (GW).
Global Wind Power Market Trends and Insights
Rapid cost declines in >=15 MW turbines
Larger turbines cut foundation, cabling, and maintenance costs by 15-20% compared with smaller units, thereby lifting capacity factors by 8-12% at taller hub heights.(1)These economics allow developers to pursue sites that once sat at the margin of commercial viability and, in many offshore locations, to reach grid parity. Transportation bottlenecks created by 100-meter-plus blades persist, but port upgrades and heavy-lift vessel orders are underway, suggesting a short-lived constraint. The resulting capital-efficiency gain positions the wind power market for sustained cost competitiveness.
Surge in corporate PPAs from data-center operators
Major cloud providers are signing 10- to 20-year PPAs that bundle electricity with renewable energy certificates and 24/7 clean-energy matching guarantees. These contracts de-risk cash flows for new projects and encourage developers in the wind power industry to size wind farms around data-center load profiles, particularly near North Sea interconnectors and U.S. coastal grids. Electricity demand from artificial-intelligence workloads is expected to climb 35-50% by 2040, turning renewable procurement into an operational necessity rather than a CSR initiative.
Commodity price volatility (steel, rare-earths)
Steel makes up roughly 70% of turbine mass, and a 10% spot-price swing can nudge project capital expenditure by up to 3 percentage points Rare-earth magnets remain 70% sourced from China, so supply shocks in neodymium and dysprosium add further unpredictability. Some OEMs explore electrically excited generators to sidestep these metals, though the switch can trim efficiency by around 2%.(2)
Other drivers and restraints analyzed in the detailed report include:
- Inflation Reduction Act & EU wind power package
- Repowering of early-2000s onshore fleets
- Lengthy permitting timelines (>=5 yrs EU avg.)
For complete list of drivers and restraints, kindly check the Table Of Contents.
Segment Analysis
Onshore turbines held 92.45% of installed capacity in 2025, reflecting entrenched supply chains and quicker builds. Nevertheless, offshore assets post a 15.62% CAGR through 2031, due to stronger winds, fewer land-use conflicts, and the readiness of floating foundations. Japan's first barge-type floater proves commercial viability for typhoon-prone deep-water zones. With 16 MW machines now standard offshore, fewer turbines deliver the same megawatts, compressing installation timelines and lowering lifecycle costs. The wind power market thus tilts toward sea-based growth in land-scarce economies while onshore repowering drives gains in mature regions.
Emerging-economy developers favor onshore builds for lower capex and faster returns, but falling floating-foundation prices begin to level the field. As coastal grids upgrade, offshore output can smooth solar-driven daytime peaks and night-time dips, easing integration challenges.
Geography Analysis
Asia-Pacific dominated with 53.55% wind power market share of global capacity in 2025 and maintains an 11.42% CAGR to 2031. China alone added 76 GW in 2024, blending record onshore builds with a South China Sea offshore push. India's auction pipeline targets 140 GW by 2030, though state-level grid upgrades lag capacity growth. Japan and South Korea lean toward floating projects to sidestep land scarcity, and Vietnam eyes early-stage tenders that link wind to green-ammonia exports. The wind power market, therefore, benefits from integrated supply chains and government purchase guarantees across the region.
Europe anchors offshore innovation. The North Sea hosts 60% of installed offshore capacity, with Denmark and the Netherlands trimming permitting times via one-stop agencies. REPowerEU's local-content rules spur turbine factories in Spain, Poland, and France, while green-hydrogen pilot plants secure new offtake channels. Repowering across Germany, Denmark, and Spain adds capacity without new land, relying on upgraded 6 MW machines on existing pads.
North America sees mixed momentum. The January 2025 moratorium on new federal offshore leases stalls fresh acreage but does not affect active projects. Eighteen state attorneys general contest the ban, leaving a court-driven timeline for resolution. Onshore growth stays healthy in Midwestern grids, yet queue congestion in PJM and MISO regions stretches interconnection timelines. The Inflation Reduction Act still underpins project economics pending legislative clarity.
Middle East and Africa emerge as growth frontiers in the wind power market. Egypt's 10 GW build-own-operate deal and Morocco's hybrid wind-hydrogen hubs exemplify regional ambition. Namibia and South Africa plan cross-border grid links to tap their formidable wind corridors. Latin America benefits from Brazil's Rio Grande do Sul and Chile's Patagonia resources, yet long-haul transmission investment must catch up to exploit full potential.
- Acciona Energia
- Duke Energy
- EDF
- Orsted
- NextEra Energy
- E.ON
- Iberdrola
- Enel Green Power
- Pattern Energy
- Invenergy
- General Electric Vernova
- Vestas
- Siemens Gamesa
- Goldwind
- Envision Energy
- MingYang Smart Energy
- Suzlon
- Nordex
- Enercon
- Dongfang Electric
- CSIC Haizhuang
Additional Benefits:
- The market estimate (ME) sheet in Excel format
- 3 months of analyst support
TABLE OF CONTENTS
1 Introduction
- 1.1 Study Assumptions & Market Definition
- 1.2 Scope of the Study
2 Research Methodology
3 Executive Summary
4 Market Landscape
- 4.1 Market Overview
- 4.2 Market Drivers
- 4.2.1 Rapid cost declines in over 15 MW turbines
- 4.2.2 Surge in corporate PPAs from data-center operators
- 4.2.3 Inflation Reduction Act & EU Wind Power Package
- 4.2.4 Repowering of early 2000s onshore fleets
- 4.2.5 Maritime green-hydrogen off-take agreements
- 4.2.6 Rise of AI-enabled O&M drones
- 4.3 Market Restraints
- 4.3.1 Commodity price volatility (steel, rare-earths)
- 4.3.2 Lengthy permitting timelines (above 5 yrs EU avg.)
- 4.3.3 Grid interconnection queue congestion
- 4.3.4 Rising anti-whale litigation vs. offshore farms
- 4.4 Supply-Chain Analysis
- 4.5 Regulatory Landscape
- 4.6 Technological Outlook (floating foundations, 20 MW class)
- 4.7 Porters Five Forces
- 4.7.1 Bargaining Power of Suppliers
- 4.7.2 Bargaining Power of Buyers
- 4.7.3 Threat of New Entrants
- 4.7.4 Threat of Substitutes
- 4.7.5 Intensity of Competitive Rivalry
5 Market Size & Growth Forecasts
- 5.1 By Location
- 5.1.1 Onshore
- 5.1.2 Offshore
- 5.2 By Turbine Capacity
- 5.2.1 Up to 3 MW
- 5.2.2 3 to 6 MW
- 5.2.3 Above 6 MW
- 5.3 By Application
- 5.3.1 Utility-scale
- 5.3.2 Commercial and Industrial
- 5.3.3 Community Projects
- 5.4 By Component (Qualitative Analysis)
- 5.4.1 Nacelle/Turbine
- 5.4.2 Blade
- 5.4.3 Tower
- 5.4.4 Generator and Gearbox
- 5.4.5 Balance-of-System
- 5.5 By Geography
- 5.5.1 North America
- 5.5.1.1 United States
- 5.5.1.2 Canada
- 5.5.1.3 Mexico
- 5.5.2 Europe
- 5.5.2.1 Germany
- 5.5.2.2 Spain
- 5.5.2.3 United Kingdom
- 5.5.2.4 France
- 5.5.2.5 Norway
- 5.5.2.6 Turkey
- 5.5.2.7 Nordic (ex-Norway)
- 5.5.2.8 Russia
- 5.5.2.9 Rest of Europe
- 5.5.3 Asia Pacific
- 5.5.3.1 China
- 5.5.3.2 India
- 5.5.3.3 Japan
- 5.5.3.4 Vietnam
- 5.5.3.5 Indonesia
- 5.5.3.6 Malaysia
- 5.5.3.7 Thailand
- 5.5.3.8 Rest of Asia Pacific
- 5.5.4 South America
- 5.5.4.1 Brazil
- 5.5.4.2 Argentina
- 5.5.4.3 Chile
- 5.5.4.4 Colombia
- 5.5.4.5 Rest of South America
- 5.5.5 Middle East and Africa
- 5.5.5.1 Saudi Arabia
- 5.5.5.2 United Arab Emirates
- 5.5.5.3 Egypt
- 5.5.5.4 Nigeria
- 5.5.5.5 Qatar
- 5.5.5.6 Rest of Middle East & Africa
- 5.5.1 North America
6 Competitive Landscape
- 6.1 Market Concentration
- 6.2 Strategic Moves (M&A, Partnerships, PPAs)
- 6.3 Market Share Analysis (Market Rank/Share for key companies)
- 6.4 Company Profiles (includes Global level Overview, Market level overview, Core Segments, Financials as available, Strategic Information, Products & Services, and Recent Developments)
- 6.4.1 Acciona Energia
- 6.4.2 Duke Energy
- 6.4.3 EDF
- 6.4.4 Orsted
- 6.4.5 NextEra Energy
- 6.4.6 E.ON
- 6.4.7 Iberdrola
- 6.4.8 Enel Green Power
- 6.4.9 Pattern Energy
- 6.4.10 Invenergy
- 6.4.11 General Electric Vernova
- 6.4.12 Vestas
- 6.4.13 Siemens Gamesa
- 6.4.14 Goldwind
- 6.4.15 Envision Energy
- 6.4.16 MingYang Smart Energy
- 6.4.17 Suzlon
- 6.4.18 Nordex
- 6.4.19 Enercon
- 6.4.20 Dongfang Electric
- 6.4.21 CSIC Haizhuang
7 Market Opportunities & Future Outlook
- 7.1 White-space & Unmet-need Assessment

 北美風力發電:市佔率分析、產業趨勢與統計及成長預測(2026-2031 年)歐洲風電:市場佔有率分析、產業趨勢與統計及成長預測(2026-2031 年)
 船用風向標市場規模、佔有率和成長分析:按產品類型、顯示方式、應用、船舶類型、最終用戶和地區分類-2026-2033年產業預測
 風力渦輪機市場規模、佔有率和成長分析:按軸配置、主要運行應用、結構框架材質、最終用戶安裝類型和地區分類-2026-2033年產業預測
 風力發電市場:2026-2032年全球市場預測(按組件、技術類型、渦輪機類型、渦輪機尺寸、發電機類型、轉子轉速、軸設計和應用分類)
 風力發電市場規模、佔有率和趨勢分析報告:按安裝地點、應用、地區和細分市場預測(2026-2033 年)
 風力發電系統市場預測至2034年-按組件、類型、容量、安裝類型、應用、最終用戶和地區分類的全球分析風力渦輪機控制器市場:控制器類型、產品、最終用戶、渦輪機類型、連接方式-2026-2032年全球市場預測
 2026年全球分散式風電市場報告2026年全球風力發電市場報告