


 |
市場調查報告書
商品編碼
2124096
基礎設施監測:市場佔有率分析、產業趨勢與統計、成長預測(2026-2031)Infrastructure Monitoring - Market Share Analysis, Industry Trends & Statistics, Growth Forecasts (2026 - 2031) |
||||||

※ 本網頁內容可能與最新版本有所差異。詳細情況請與我們聯繫。
據 Mordor Intelligence 稱,基礎設施監控市場預計到 2026 年價值 87.4 億美元,高於 2025 年的 79.5 億美元,預計到 2031 年將達到 140.5 億美元。
預計 2026 年至 2031 年的複合年成長率為 9.96%。
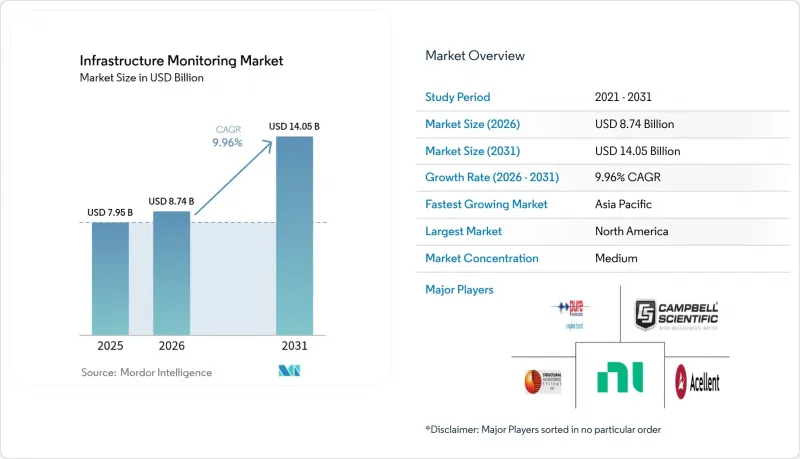
本報告按技術(有線、無線)、交付方式(硬體、軟體、服務)、部署模式(本地部署、雲端部署)、應用(腐蝕監測、裂縫和應變檢測等)、最終用戶產業(民用基礎設施、能源、航太和國防等)以及地區進行細分。市場預測以價值(美元)表示。
全球基礎設施監測市場趨勢及洞察
加快在老舊橋樑上部署無線感測網路(北美和歐盟)
鑑於橋樑老化問題日益嚴重(45%的橋樑橋齡超過50年),業主們正在安裝無線節點,持續傳輸應變和振動資料。無線感測網路的線性設計降低了功耗,並簡化了在大跨距結構上的安裝。一個典型的例子是在金門大橋上部署了64個節點,這些節點能夠以1 kHz的頻率擷取數據,且不會干擾交通。基於雲端的控制面板使工程師能夠遠端檢驗感測器的效能,從而最大限度地減少現場勘察和鷹架搭建的成本,並縮短專案工期。
智慧城市的大型企劃正在推動對即時智慧人力資源 (SHM) 的需求。
聯合國人居住署預測,到2050年,亞太地區的城市人口將達到35億,這將迫使地方政府在交通走廊、隧道和公共建築中實施結構健康監測(SHM)。東協正在推動108個智慧城市項目,結構感測器資料的交換也日益標準化。同時,澳門和香港的5G聯合邊緣平台能夠在不到50毫秒的時間內傳輸千兆位元組級的動態荷載資料。採購框架現已強制要求開放API,這鼓勵新創公司授權開發用於裂紋檢測、腐蝕測繪和異常優先排序的微服務。
在偏遠地區建造無線鏈路需要大量資金投入
偏遠地區回程傳輸基礎設施不足,導致部署成本增加高達 45%,儘管都市區已證明其投資回報率,但仍阻礙了相關技術的普及。低地球軌道 (LE ) 衛星星系有望解決這一問題,但終端成本對許多市政當局而言仍然難以承受,從而延緩了在農村橋樑和管道上部署感測器的進程。
細分市場分析
預計到2025年,無線平台將創造48.8億美元的收入,佔基礎設施監控市場61.35%的佔有率。由於網狀路由、Sub-GHz頻段無線技術和能源採集等技術的進步,無線網路如今可提供長達五年的電池續航時間,在運作方面可與有線網路媲美,同時避免了管道和溝槽鋪設等相關成本。受北美和歐洲公共橋樑維修的推動,無線系統基礎設施監控市場預計將以11.45%的複合年成長率成長。相較之下,有線系統在核能發電廠和長跨度隧道等對確定性延遲要求極高的場所仍然發揮著至關重要的作用。
隨著雲端供應商採用數位訊號處理服務,資產管理公司無需維護本機伺服器即可部署振動和聲學演算法。嵌入無線閘道器的邊緣最佳化型人工智慧晶片,透過在本地執行模式分析並傳輸壓縮特徵而非原始波形,可將頻寬成本降低 70%。這種轉變為新興經濟體開闢了新的商機,這些經濟體的 3G/4G 網路覆蓋範圍雖然仍不足但不斷擴大。
儘管硬體在2025年仍將佔總收入的54.30%,但服務業預計將以12.44%的複合年成長率超越所有其他類別。隨著業主將資料工程、人工智慧模型訓練和儀錶板客製化等工作外包給兼具土木工程專業知識和雲端原生技能的公司,基礎設施監控市場的服務領域將不斷擴張。拉丁美洲和東南亞的需求尤其旺盛,因為這些地區工程師短缺,阻礙了企業內部程序的開發。
軟體平台佔剩餘的18.35%支出,但整合挑戰依然存在。儘管開放原始碼中間件舉措正在標準化訊息仲介和語義模型,但供應商鎖定現象仍然普遍存在。網路安全增強功能(零信任存取、安全啟動、OTA修補程式)如今已成為企業採購的基本要求。
區域分析
到2025年,北美將佔全球收入的29.40%,這得益於IIJA資助的數位孿生試點計畫以及旨在促進50年以上橋樑維修的政策。基於智慧感測器的維修已被證明可降低20%的維護成本,各省機構目前已將感測器部署預算納入路面合約。加拿大各省正在利用聯邦綠色基礎設施津貼,在偏遠地區的木橋上試點基於邊緣人工智慧的裂縫檢測技術;而墨西哥則正在加快收費公路特許特許經營協議的簽訂,這些協議要求從一開始就進行狀況監測。
亞太地區正處於最快的成長軌道上,預計到2031年將維持11.86%的複合年成長率。中國的「十四五」規劃將高速鐵路高架橋的結構狀況監測(SHM)列為優先事項,而日本的「社會5.0」目標包括引入機器人技術進行隧道維護。印度的智慧城市計畫正在資助建造一個綜合指揮中心,該中心整合了水位計和交通感測器的數據,為東協中等規模城市樹立了典範。澳洲資產管理委員會正在沿海防波堤上部署光纖應變感測器,以預測風暴潮造成的破壞,這項舉措目前正在紐西蘭和太平洋島嶼地區推廣。
嚴格的歐洲法規促使強制性預測性維護的早期實施。在北歐國家,基礎設施即服務(IaaS)特許經營模式已率先應用,承包商透過持續監控來確保運作。在荷蘭,即時撓度檢測技術正被應用於海堤,以應對海平面上升;而在德國,量子重力檢測法正被測試用於檢測高速公路路基下方的地層下陷。在南歐,疫情後的復甦資金正被用於抗震加固,加速計的安裝也與節能改造計畫結合。
其他好處:
- Excel格式的市場預測(ME)表
- 3個月的分析師支持
目錄
第1章:引言
- 研究假設和市場定義
- 調查範圍
第2章:調查方法
第3章執行摘要
第4章 市場狀況
- 市場概覽
- 市場促進因素
- 在老舊橋樑上引入無線感測網路的進程正在加速。
- 智慧城市的大型企劃正在推動對即時智慧家庭管理 (SHM) 的需求。
- 歐盟和日本對水壩和隧道進行強制性預測性維護
- 美國實施由國際聯合情報機構(IIJA)資助的數位孿生項目
- 海灣合作理事會領先的EPC公司正在採用「雲端優先」的監控方法。
- MEMS感測器成本的降低使得在地方道路上引入測量設備成為可能。
- 市場限制因素
- 偏遠地區無線網路基礎設施投資成本高昂
- 歐盟公共資產資料管治與網路安全面臨的障礙
- 新興市場結構資料科學家短缺
- 傳統有線感測器與物聯網感測器之間存在互通性差距。
- 價值供應鏈分析
- 監理展望
- 波特五力模型
- 新冠疫情對市場的影響
第5章 市場規模與成長預測
- 透過技術
- 有線
- 無線的
- 報價
- 硬體
- 軟體
- 服務
- 按部署模式
- 現場
- 雲/邊緣
- 透過使用
- 腐蝕監測
- 裂紋/應變檢測
- 振動和動態載荷監測
- 遠端結構健康監測(SHM)
- 環境與地震監測
- 按最終用戶行業分類
- 民用基礎設施(橋樑、道路、隧道、水壩)
- 能源公用事業
- 航太/國防
- 採礦和金屬
- 石油天然氣/石油化工
- 交通運輸(港口、鐵路、機場)
- 按地區
- 北美洲
- 美國
- 加拿大
- 墨西哥
- 南美洲
- 巴西
- 阿根廷
- 其他南美國家
- 亞太地區
- 中國
- 日本
- 印度
- 韓國
- ASEAN
- 其他亞太國家
- 歐洲
- 德國
- 英國
- 法國
- 義大利
- 北歐的
- 其他歐洲國家
- 中東和非洲
- GCC
- 土耳其
- 其他中東和非洲國家
- 北美洲
第6章 競爭情勢
- 市場集中度
- 策略趨勢
- 市佔率分析
- 公司簡介
- Schneider Electric SE
- Pure Technologies Ltd. Company(Xylem Inc.)
- Structural Monitoring Systems plc
- Acellent Technologies Inc.
- National Instruments Corp.
- Campbell Scientific, Inc.
- Siemens AG
- Trimble Inc.
- HBM(Hottinger Bruel & Kjaer)
- Geocomp Corporation
- Geokon Inc.
- SISGEO SRL
- RST Instruments Ltd.
- Bridge Diagnostics Inc.
- Sixense Group
- Digitexx Data Systems Inc.
- AVT Reliability(AES Engineering)
- Honeywell International Inc.
- Civionics
- Topcon Positioning Systems
- Nova Metrix LLC
- Worldsensing
第7章 市場機會與未來展望
According to Mordor Intelligence, infrastructure monitoring market size in 2026 is estimated at USD 8.74 billion, growing from 2025 value of USD 7.95 billion with 2031 projections showing USD 14.05 billion, growing at 9.96% CAGR over 2026-2031.
This report is Segmented by Technology (Wired, Wireless), Offering (Hardware, Software, and Services), Deployment Model (On-Premise, Cloud), Application (corrosion Monitoring, Crack/Strain Detection, and More), End-User Industry (Civil Infrastructure, Energy, Aerospace and Defense, and More), and by Geography. The Market Forecasts are Provided in Terms of Value (USD).
Global Infrastructure Monitoring Market Trends and Insights
Accelerating Deployment of Wireless Sensor Networks in Aging Bridges (NA & EU)
Aging bridges-45% are more than 50 years old-are prompting asset owners to install wireless nodes that stream strain and vibration data continuously. Linear wireless sensor network designs have cut power consumption and eased installation on long-span structures, evidenced by the 64-node Golden Gate Bridge deployment collecting 1 kHz data without traffic disruption. Project timelines are shortening because cloud-based dashboards allow engineers to validate sensor performance remotely, minimizing field revisits and scaffolding costs.
Smart-City Megaprojects Fuel Real-Time SHM Demand
UN-Habitat forecasts APAC's urban population to reach 3.5 billion by 2050, pushing municipal authorities to embed SHM into transit corridors, tunnels, and public buildings. ASEAN's 108 active smart-city programs are standardizing data exchanges for structural sensors, while 5G federated edge platforms in Macau and Hong Kong stream gigabyte-scale dynamic-load data in under 50 milliseconds. Procurement frameworks now require open APIs, encouraging start-ups to license micro-services for crack detection, corrosion mapping, and anomaly triage.
High Capex for Remote-Area Wireless Links
Sparse backhaul in remote regions raises deployment costs by up to 45%, deterring adoption despite proven ROI in urban settings. While low-earth-orbit satellite constellations promise relief, terminals remain price-prohibitive for many municipalities, postponing sensor roll-outs on rural bridges and pipelines.
Other drivers and restraints analyzed in the detailed report include:
- EU & Japan Predictive-Maintenance Mandates for Dams/Tunnels
- US IIJA-Funded Digital-Twin Roll-outs
- Data-Governance & Cyber-Security Barriers in EU Public Assets
For complete list of drivers and restraints, kindly check the Table Of Contents.
Segment Analysis
Wireless platforms underpin USD 4.88 billion of 2025 revenue, equivalent to 61.35% of the infrastructure monitoring market. Supported by improvements in mesh routing, sub-GHz radios, and energy harvesting, wireless networks now achieve five-year battery life, matching wired uptime benchmarks while avoiding conduit and trenching expenses. The infrastructure monitoring market size for wireless systems is forecast to expand at 11.45% CAGR, driven by public bridge retrofits in North America and Europe. In contrast, the wired cohort retains relevance for nuclear plants and long-span tunnels where deterministic latency is non-negotiable.
As cloud vendors introduce digital-signal-processing services, asset managers can deploy vibration and acoustic algorithms without maintaining on-premise servers. Edge-optimized AI chips embedded in wireless gateways now execute modal analysis locally, transmitting compressed features rather than raw waveforms-cutting bandwidth costs by 70%. This shift unlocks green-field opportunities in emerging economies where 3G/4G coverage is patchy yet growing.
Hardware still represents 54.30% of 2025 revenue, but services are set to outpace all other categories with a 12.44% CAGR. The infrastructure monitoring market size for services will rise as owners outsource data engineering, AI model training, and dashboard customization to firms that blend civil-engineering know-how with cloud-native skills. Demand is especially acute in Latin America and Southeast Asia, where engineer shortages hamper in-house program development.
Software platforms account for the remaining 18.35% of spending, yet face persistent integration challenges. Open-source middleware initiatives seek to standardize message brokers and semantic models, but vendor lock-in remains common. Cyber-security hardening features-zero-trust access, secure boot, over-the-air patching-are now baseline requirements for enterprise procurement.
Complete Report Scope:
- By Technology
- Wired
- Wireless
- By Offering
- Hardware
- Software
- Services
- By Deployment Model
- On-premise
- Cloud / Edge
- By Application
- Corrosion Monitoring
- Crack / Strain Detection
- Vibration and Dynamic Load Monitoring
- Remote Structural-Health Monitoring (SHM)
- Environmental and Seismic Monitoring
- By End-user Industry
- Civil Infrastructure (Bridges, Roads, Tunnels, Dams)
- Energy and Utilities
- Aerospace and Defense
- Mining and Metals
- Oil and Gas / Petro-chemicals
- Transportation (Harbors, Rail, Airports)
- By Geography
- North America
- United States
- Canada
- Mexico
- South America
- Brazil
- Argentina
- Rest of South America
- APAC
- China
- Japan
- India
- South Korea
- ASEAN
- Rest of APAC
- Europe
- Germany
- United Kingdom
- France
- Italy
- Nordics
- Rest of Europe
- Middle East and Africa
- GCC
- Turkey
- Rest of Middle East and Africa
- North America
Geography Analysis
North America anchors 29.40% of 2025 revenue, supported by IIJA-funded digital-twin pilots and a policy push to rehabilitate bridges older than 50 years. Smart-sensor retrofits demonstrate 20% maintenance cost savings, prompting state agencies to incorporate sensing budgets into resurfacing contracts. Canadian provinces leverage federal green-infrastructure grants to trial edge-AI crack detection on remote timber bridges, while Mexico accelerates toll-road concessions that stipulate condition-based monitoring from day one.
Asia-Pacific delivers the steepest trajectory with a 11.86% CAGR through 2031. China's 14th Five-Year Plan prioritizes SHM on high-speed rail viaducts, and Japan's Society 5.0 target embeds robotics in tunnel maintenance. India's Smart Cities Mission funds integrated command centers that ingest flood gauges and traffic sensors, offering a blueprint for mid-tier cities across ASEAN. Australia's asset-management councils adopt fiber-optic strain lines on coastal seawalls to anticipate storm-surge damage, a practice now spreading to New Zealand and Pacific Island states.
Europe's regulatory rigor fosters early adoption of predictive-maintenance mandates. Nordic countries pioneer infrastructure-as-a-service concessions where contractors guarantee uptime using continuous monitoring. The Netherlands applies real-time deflection sensing on dykes to counter sea-level rise, while Germany pilots quantum gravimetry to detect subsidence beneath Autobahn foundations. Southern Europe channels pandemic-recovery funds into seismic retrofits, bundling accelerometers with energy-efficiency upgrades.
- Schneider Electric SE
- Pure Technologies Ltd. Company (Xylem Inc.)
- Structural Monitoring Systems plc
- Acellent Technologies Inc.
- National Instruments Corp.
- Campbell Scientific, Inc.
- Siemens AG
- Trimble Inc.
- HBM (Hottinger Bruel & Kjaer)
- Geocomp Corporation
- Geokon Inc.
- SISGEO SRL
- RST Instruments Ltd.
- Bridge Diagnostics Inc.
- Sixense Group
- Digitexx Data Systems Inc.
- AVT Reliability (AES Engineering)
- Honeywell International Inc.
- Civionics
- Topcon Positioning Systems
- Nova Metrix LLC
- Worldsensing
Additional Benefits:
- The market estimate (ME) sheet in Excel format
- 3 months of analyst support
TABLE OF CONTENTS
1 INTRODUCTION
- 1.1 Study Assumptions and Market Definition
- 1.2 Scope of the Study
2 RESEARCH METHODOLOGY
3 EXECUTIVE SUMMARY
4 MARKET LANDSCAPE
- 4.1 Market Overview
- 4.2 Market Drivers
- 4.2.1 Accelerating Deployment of Wireless Sensor Networks in Aging Bridges
- 4.2.2 Smart-City Megaprojects Fuel Real-Time SHM Demand
- 4.2.3 EU and Japan Predictive-Maintenance Mandates for Dams / Tunnels
- 4.2.4 US IIJA-Funded Digital-Twin Roll-outs
- 4.2.5 Cloud-First Monitoring Adoption by GCC EPC Majors
- 4.2.6 Falling MEMS Sensor Cost Enabling Secondary-Road Instrumentation
- 4.3 Market Restraints
- 4.3.1 High Capex for Remote-area Wireless Links
- 4.3.2 Data-Governance and Cyber-Security Barriers in EU Public Assets
- 4.3.3 Shortage of Structural-Data Scientists in Emerging Markets
- 4.3.4 Interoperability Gaps between Legacy Wired and IoT Sensors
- 4.4 Value / Supply-Chain Analysis
- 4.5 Regulatory Outlook
- 4.6 Porter's Five Forces
- 4.6.1 Threat of New Entrants
- 4.6.2 Bargaining Power of Buyers
- 4.6.3 Bargaining Power of Suppliers
- 4.6.4 Threat of Substitutes
- 4.6.5 Intensity of Competitive Rivalry
- 4.7 Impact of Covid-19 on the Market
5 MARKET SIZE AND GROWTH FORECASTS (VALUE)
- 5.1 By Technology
- 5.1.1 Wired
- 5.1.2 Wireless
- 5.2 By Offering
- 5.2.1 Hardware
- 5.2.2 Software
- 5.2.3 Services
- 5.3 By Deployment Model
- 5.3.1 On-premise
- 5.3.2 Cloud / Edge
- 5.4 By Application
- 5.4.1 Corrosion Monitoring
- 5.4.2 Crack / Strain Detection
- 5.4.3 Vibration and Dynamic Load Monitoring
- 5.4.4 Remote Structural-Health Monitoring (SHM)
- 5.4.5 Environmental and Seismic Monitoring
- 5.5 By End-user Industry
- 5.5.1 Civil Infrastructure (Bridges, Roads, Tunnels, Dams)
- 5.5.2 Energy and Utilities
- 5.5.3 Aerospace and Defense
- 5.5.4 Mining and Metals
- 5.5.5 Oil and Gas / Petro-chemicals
- 5.5.6 Transportation (Harbors, Rail, Airports)
- 5.6 By Geography
- 5.6.1 North America
- 5.6.1.1 United States
- 5.6.1.2 Canada
- 5.6.1.3 Mexico
- 5.6.2 South America
- 5.6.2.1 Brazil
- 5.6.2.2 Argentina
- 5.6.2.3 Rest of South America
- 5.6.3 APAC
- 5.6.3.1 China
- 5.6.3.2 Japan
- 5.6.3.3 India
- 5.6.3.4 South Korea
- 5.6.3.5 ASEAN
- 5.6.3.6 Rest of APAC
- 5.6.4 Europe
- 5.6.4.1 Germany
- 5.6.4.2 United Kingdom
- 5.6.4.3 France
- 5.6.4.4 Italy
- 5.6.4.5 Nordics
- 5.6.4.6 Rest of Europe
- 5.6.5 Middle East and Africa
- 5.6.5.1 GCC
- 5.6.5.2 Turkey
- 5.6.5.3 Rest of Middle East and Africa
- 5.6.1 North America
6 COMPETITIVE LANDSCAPE
- 6.1 Market Concentration
- 6.2 Strategic Moves
- 6.3 Market Share Analysis
- 6.4 Company Profiles (includes Global Level Overview, Market Level Overview, Core Segments, Financials as available, Strategic Information, Market Rank/Share, Products and Services, Recent Developments)
- 6.4.1 Schneider Electric SE
- 6.4.2 Pure Technologies Ltd. Company (Xylem Inc.)
- 6.4.3 Structural Monitoring Systems plc
- 6.4.4 Acellent Technologies Inc.
- 6.4.5 National Instruments Corp.
- 6.4.6 Campbell Scientific, Inc.
- 6.4.7 Siemens AG
- 6.4.8 Trimble Inc.
- 6.4.9 HBM (Hottinger Bruel & Kjaer)
- 6.4.10 Geocomp Corporation
- 6.4.11 Geokon Inc.
- 6.4.12 SISGEO SRL
- 6.4.13 RST Instruments Ltd.
- 6.4.14 Bridge Diagnostics Inc.
- 6.4.15 Sixense Group
- 6.4.16 Digitexx Data Systems Inc.
- 6.4.17 AVT Reliability (AES Engineering)
- 6.4.18 Honeywell International Inc.
- 6.4.19 Civionics
- 6.4.20 Topcon Positioning Systems
- 6.4.21 Nova Metrix LLC
- 6.4.22 Worldsensing
7 MARKET OPPORTUNITIES AND FUTURE OUTLOOK
- 7.1 White-space and Unmet-Need Assessment

 無線基礎設施監測:市場佔有率分析、產業趨勢與統計、成長預測(2026-2031)
 基礎設施監測市場-2026-2032年全球市場預測
 2026年全球基礎設施監測市場報告無線起重機監控系統市場:按組件、部署類型、設備類型、連接技術、監控類型、計劃規模、應用、最終用戶分類,全球預測,2026-2032年
 基礎設施監控市場分析及預測(至2035年):依類型、產品類型、服務、技術、組件、應用、部署類型、最終用戶及解決方案分類
 基礎設施監控市場-全球產業規模、佔有率、趨勢、機會及預測(按組件、技術、應用、垂直產業、地區和競爭格局分類,2021-2031年)
 基礎設施監測市場-2026-2031年預測
 基礎設施監控市場規模、佔有率和成長分析(按組件、技術、應用、垂直產業和地區分類)-2026-2033年產業預測
 無線狀態監測系統市場規模、佔有率和趨勢分析報告:按組件、監測技術、連接類型、部署方式、最終用途、地區和細分市場預測(2025-2033 年)
 中國無線基礎設施(2025 年 7 月):中國憑藉其經濟和 5G 超級大國的地位,正在部署 5G-A(5G-Advanced),為新的國家重點發展項目 6G 奠定基礎。