


 |
市場調查報告書
商品編碼
2116011
無線基礎設施監測:市場佔有率分析、產業趨勢與統計、成長預測(2026-2031)Wireless Infrastructure Monitoring - Market Share Analysis, Industry Trends & Statistics, Growth Forecasts (2026 - 2031) |
||||||

※ 本網頁內容可能與最新版本有所差異。詳細情況請與我們聯繫。
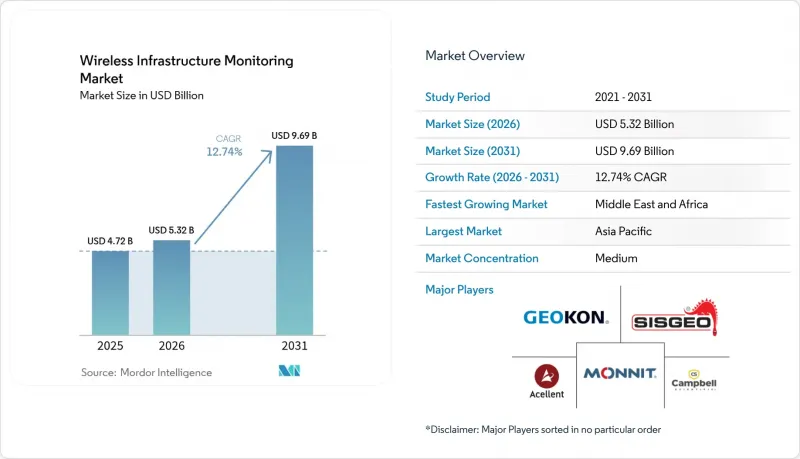
預計無線基礎設施監控市場將從 2025 年的 47.2 億美元成長到 2026 年的 53.2 億美元,然後在 2031 年達到 96.9 億美元,2026 年至 2031 年的複合年成長率為 12.74%。
本報告按組件(硬體、軟體等)、連接技術(Wi-Fi等)、應用(結構監測等)、基礎設施類型(橋樑、隧道等)、感測器類型(應變/應力感測器等)、最終用戶(土木基礎設施的所有者和營運商等)以及地區進行細分。市場預測以美元計價。
全球無線基礎設施監控市場趨勢與洞察
隨著 5G 的部署,需要對通訊塔的完整性檢驗。
5G網路密度的不斷提高為現有通訊塔帶來了更大的風荷載和振動荷載。電信業者目前正在實施持續的結構健康監測,以便及早發現疲勞、最佳化維護計畫並確保符合監管要求。即時分析透過動態功率調整,使通訊塔的能耗降低了20%。
美國和歐盟強制要求對老舊橋樑實施數位孿生技術。
監管機構日益呼籲採用基於即時感測器資料的數位模型,這可以將橋樑的使用壽命延長多達20%,同時也能將維護預算重新分配給真正承受結構應力的資產。目前,「地平線2020」計畫中有66個專案專注於無線偵測技術。
鋼筋混凝土內部的訊號衰減
由於鋼筋會形成法拉第籠,系統整合商不得不添加閘道器和高功率發送器,導致資本投資和維護成本增加。而諸如 VaiNet 等新型亞GHz協定則提高了滲透性並減少了中繼器的數量。
細分市場分析
到2025年,硬體將佔無線基礎設施監控市場60.85%的佔有率,這主要得益於橋樑、水壩和能源相關資產的大規模感測器部署。然而,隨著業主將數據洞察置於設備採購之上,服務領域正以13.92%的複合年成長率快速成長。目前,將硬體、閘道器和預測儀錶板捆綁在一起的託管分析契約,其利潤率高於產品銷售。閘道器可以將多種協定轉換為統一的資料流,是硬體領域成長最快的細分市場,能夠實現對整個網路的全面監控。 Packet Power指出,預測性維護可以將停機時間減少一半,並將維護成本降低30%。
軟體層雖然規模不大,卻是長期價值的基礎。供應商正在整合人工智慧演算法,將原始時間序列資料轉化為可操作的警報和自動產生的工單。隨著系統日趨成熟,差異化的重點正從感測器規格轉向基於結果的服務等級協定 (SLA),供應商將收入押注於保證運作。這種以服務為中心的模式透過確保持續的現金流量和增加轉換成本,推動了無線基礎設施監控市場的整合。
預計到2025年,低功耗廣域網路(LPWAN)將佔總收入的37.22%,它兼具多年的電池續航力和公里級的覆蓋範圍。這為大多數長週期民用基礎設施部署提供了支持,這些部署的資料封包雖小但傳輸頻繁。同時,5G/蜂窩網路收入正以13.54%的複合年成長率成長,為關鍵任務資產的即時影像傳輸和邊緣人工智慧分析提供支援。一種混合部署模式正成為全國無線基礎設施監控系統的標準架構,該模式利用LPWAN進行基準遙測,並在資料流量高峰期疊加5G網路。這種整合方法在最佳化營運成本的同時,最大限度地提高了頻寬可用性,以滿足高階分析和事件驅動型應用的需求。
雖然藍牙和Wi-Fi在利用現有區域網路覆蓋的短距離建築和工業廠房中仍然十分重要,但衛星鏈路能夠實現在偏遠地區和離網環境中的部署。 IEEE的研究證實,低功耗廣域網路(LPWAN)和5G的融合將在擴展數十億個物聯網節點方面發揮核心作用。
區域分析
到2025年,亞太地區將佔全球收入的28.34%,主要驅動力來自中國、日本和韓國。在這些國家,物聯網的普及應用正在協助國家智慧城市計畫的實施。印度的智慧城市計畫以及東南亞國協的基礎設施建設進一步鞏固了該地區的智慧城市基礎。中東地區預計將成為成長最快的地區,到2031年複合年成長率將達到14.06%,這主要得益於海灣合作理事會(GCC)的大型企劃以及為確保應對乾旱氣候而實施的強制性監測標準。然而,區域資料主權法規正在推動物聯網向本地雲端遷移,這也正在改變無線基礎設施監測市場中供應商的市場進入模式。
北美市場雖然成熟,但依然舉足輕重,聯邦政府正投入資金用於橋樑和道路完整性計畫。保險義務的實施正在加速高風險資產(例如尾礦壩)的數位轉型。在歐洲,嚴格的安全指令和「地平線2020」計畫的資金支持正推動著延長20世紀中期建造的基礎設施使用壽命的努力,從而帶動了數位孿生先導計畫的激增。在南美洲,重點在於監測崎嶇地形中的採礦和水力發電設施。同時,非洲雖然仍處於發展階段,但已做好準備迎接新一輪的基礎設施投資浪潮,蘊藏著充滿希望的待開發區商業機會。
其他好處:
- Excel格式的市場預測(ME)表
- 3個月的分析師支持
目錄
第1章:引言
- 研究假設和市場定義
- 調查範圍
第2章:調查方法
第3章執行摘要
第4章 市場狀況
- 市場概覽
- 市場促進因素
- 隨著 5G 的部署,需要對通訊塔的完整性檢驗。
- 美國和歐盟強制實施老舊橋樑的數位孿生技術
- LPWAN感測器成本的降低使得建構高密度監控網路成為可能。
- 拉丁美洲尾礦壩的保險關聯監測
- 在惡劣海洋環境下對離岸風力發電進行腐蝕監測
- 市場限制因素
- 鋼筋混凝土內部的訊號衰減
- 中東雲端分析中資料主權面臨的障礙
- 小規模地方政府基礎設施所有者面臨資金短缺問題
- 產業價值鏈分析
- 監理展望
- 波特五力分析
第5章 市場規模與成長預測
- 按組件
- 硬體
- 感應器
- 數據採集系統
- 閘道器和通訊設備
- 軟體
- 服務
- 硬體
- 透過連接技術
- Wi-Fi
- Bluetooth
- Zigbee
- 蜂窩網路(3G/4G/5G)
- LPWAN(LoRa、Sigfox、NB-IoT)
- 衛星和其他連接技術
- 透過使用
- 結構監測
- 地面監測
- 環境監測
- 地震和振動監測
- 腐蝕監測
- 其他特殊用途
- 依基礎設施類型
- 橋樑和隧道
- 建築物和商業設施
- 水壩和水利基礎設施
- 石油和天然氣管道及煉油廠
- 發電廠和能源設施
- 交通基礎設施(鐵路、公路、機場)
- 礦
- 可再生能源資產(風能、太陽能)
- 依感測器類型
- 應變和應力感測器
- 位移和撓度感測器
- 加速計和振動感測器
- 溫濕度感測器
- 傾斜感測器
- 其他感測器類型
- 最終用戶
- 民用基礎設施的所有者和運營者
- 石油和天然氣公司
- 公共產業和能源公司
- 運輸
- 礦業公司
- 政府/國防
- 其他最終用戶
- 按地區
- 北美洲
- 美國
- 加拿大
- 墨西哥
- 南美洲
- 巴西
- 阿根廷
- 其他南美國家
- 歐洲
- 英國
- 德國
- 法國
- 義大利
- 西班牙
- 北歐的
- 其他歐洲國家
- 亞太地區
- 中國
- 印度
- 日本
- 韓國
- ASEAN
- 澳洲
- 紐西蘭
- 其他亞太國家
- 中東和非洲
- GCC
- 土耳其
- 以色列
- 南非
- 奈及利亞
- 其他中東和非洲國家
- 北美洲
第6章 競爭情勢
- 市場集中度
- 策略趨勢
- 市佔率分析
- 公司簡介
- Acellent Technologies, Inc.
- Monnit Corporation
- Sisgeo Srl
- Campbell Scientific, Inc.
- Geokon, Inc.
- RST Instruments Ltd.
- Nova Metrix LLC
- Worldsensing SL
- Ackcio Pte Ltd.
- Xylem Inc.
- Honeywell International Inc.
- Cisco Systems, Inc.
- Schneider Electric SE
- Trimble Inc.
- HBM(HBK)
- National Instruments Corp.
- Fugro NV
- James Fisher & Sons plc
- Smart Structures Inc.
- Sixense Group
- Move Solutions Srl
- Sonicu
- Sensemetrics Inc.
- Vaisala
第7章 市場機會與未來展望
According to Mordor Intelligence, the wireless infrastructure monitoring market size is expected to grow from USD 4.72 billion in 2025 to USD 5.32 billion in 2026 and is forecast to reach USD 9.69 billion by 2031 at 12.74% CAGR over 2026-2031.
This report is Segmented by Component (Hardware, Software and More), Connectivity Technology (Wi-Fi, and More), Application (Structural Monitoring, and More), Infrastructure Type (Bridges and Tunnels, and More), Sensor Type (Strain and Stress Sensors, and More), End-User (Civil Infrastructure Owners and Operators, and More), and Geography. The Market Forecasts are Provided in Terms of Value (USD).
Global Wireless Infrastructure Monitoring Market Trends and Insights
5G roll-outs demanding tower integrity verification
The densification of 5G networks places heavier wind and vibrational loads on existing towers. Operators now embed continuous structural health monitoring to detect early fatigue, optimize maintenance scheduling, and ensure regulatory compliance. Real-time analytics have trimmed tower energy consumption by 20% through dynamic power adjustment.
Digital-twin mandates for aging bridges in the US & EU
Regulators increasingly require digital replicas supported by live sensor data, extending bridge lifespans by up to 20% while reallocating maintenance budgets toward assets exhibiting real structural stress. Sixty-six Horizon 2020 projects now target wireless inspection technologies.
Signal attenuation inside reinforced concrete
Steel rebar forms a Faraday cage, forcing integrators to add gateways or higher-power transmitters, raising capex and maintenance. New sub-GHz protocols such as VaiNet improve penetration, reducing repeater count.
Other drivers and restraints analyzed in the detailed report include:
- LPWAN sensor cost decline enabling dense monitoring grids
- Insurance-linked monitoring for tailings dams in LatAm
- Data-sovereignty barriers for cloud analytics in the Middle East
For complete list of drivers and restraints, kindly check the Table Of Contents.
Segment Analysis
Hardware captured 60.85% of the wireless infrastructure monitoring market in 2025, owing to large-scale sensor roll-outs across bridges, dams, and energy assets. Yet, services are scaling at a 13.92% CAGR as owners prioritize insight extraction over device procurement. Managed analytics contracts now bundle hardware, gateways, and predictive dashboards, generating higher margins than product sales. Gateways that translate multiple protocols into unified data streams are the fastest-growing hardware sub-segment, enabling fleet-wide visibility. Packet Power notes that predictive maintenance can halve downtime and cut maintenance costs by 30%.
The software layer, though smaller, anchors long-term value. Vendors embed AI algorithms that transform raw time-series data into actionable alerts and automated work orders. As systems mature, differentiation shifts from sensor specs to outcome-based service level agreements, with vendors staking revenue on uptime guarantees. This service-centric model locks in recurring cash flows and raises switching costs, underpinning consolidation moves across the wireless infrastructure monitoring market.
LPWAN delivered 37.22% revenue in 2025, balancing multi-year battery life with kilometer-scale range. It underpins the majority of long-cycle civil-infrastructure deployments where data packets are small but frequent. Conversely, 5G/cellular revenues advance at 13.54% CAGR, powering real-time video feeds and edge-AI analytics for mission-critical assets. A hybrid deployment model leveraging LPWAN for baseline telemetry and 5G overlays for peak-data events is emerging as the reference architecture for nationwide wireless infrastructure monitoring systems. This integrated approach optimizes operating costs while maximizing bandwidth availability for advanced analytics and event-driven applications.
Bluetooth and Wi-Fi retain relevance for short-range building and industrial plants leveraging existing LAN coverage, while satellite links unlock remote, off-grid deployments. IEEE studies confirm the LPWAN-5G integration path as central to scaling billions of IoT nodes.
Complete Report Scope:
- By Component
- Hardware
- Sensors
- Data Acquisition Systems
- Gateways and Comms Devices
- Software
- Services
- Hardware
- By Connectivity Technology
- Wi-Fi
- Bluetooth
- Zigbee
- Cellular (3G/4G/5G)
- LPWAN (LoRa, Sigfox, NB-IoT)
- Satellite and Other Connectivity Technologies
- By Application
- Structural Monitoring
- Geotechnical Monitoring
- Environmental Monitoring
- Seismic and Vibration Monitoring
- Corrosion Monitoring
- Other Specialized Applications
- By Infrastructure Type
- Bridges and Tunnels
- Buildings and Commercial Structures
- Dams and Water Infrastructure
- Oil and Gas Pipelines and Refineries
- Power Plants and Energy Facilities
- Transportation Infrastructure (Rail, Roads, Airports)
- Mining Sites
- Renewable Energy Assets (Wind, Solar)
- By Sensor Type
- Strain and Stress Sensors
- Displacement and Deflection Sensors
- Accelerometers and Vibration Sensors
- Temperature and Humidity Sensors
- Inclination and Tilt Sensors
- Other Sensor Types
- By End-user
- Civil Infrastructure Owners and Operators
- Oil and Gas Companies
- Utilities and Energy Companies
- Transportation Authorities
- Mining Companies
- Government and Defense
- Other End-users
- By Geography
- North America
- United States
- Canada
- Mexico
- South America
- Brazil
- Argentina
- Rest of South America
- Europe
- United Kingdom
- Germany
- France
- Italy
- Spain
- Nordics
- Rest of Europe
- Asia-Pacific
- China
- India
- Japan
- South Korea
- ASEAN
- Australia
- New Zealand
- Rest of Asia-Pacific
- Middle East and Africa
- GCC
- Turkey
- Israel
- South Africa
- Nigeria
- Rest of Middle East and Africa
- North America
Geography Analysis
Asia Pacific retained 28.34% of global revenue in 2025, led by China, Japan, and South Korea, where IoT adoption supports national smart-city agendas. India's smart-city mission and ASEAN infrastructure upgrades further widen the regional base. The Middle East is forecast to clock the fastest 14.06% CAGR through 2031, propelled by GCC megaprojects and mandatory monitoring standards for arid-climate resilience. Regional data-sovereignty rules, however, steer deployments toward localized clouds, shaping vendor go-to-market models across the wireless infrastructure monitoring market.
North America remains a mature but significant arena, channeling federal funds into bridge and roadway integrity programs. Insurance mandates expedite adoption for high-risk assets such as tailings dams. Europe leverages stringent safety directives and Horizon 2020 funding to extend the lifespans of mid-20th-century infrastructure, with digital twin pilots multiplying. South America focuses on mining and hydroelectric monitoring amid challenging topographies, whereas Africa, though nascent, offers greenfield opportunities aligning with new infrastructure investment waves.
- Acellent Technologies, Inc.
- Monnit Corporation
- Sisgeo S.r.l.
- Campbell Scientific, Inc.
- Geokon, Inc.
- RST Instruments Ltd.
- Nova Metrix LLC
- Worldsensing SL
- Ackcio Pte Ltd.
- Xylem Inc.
- Honeywell International Inc.
- Cisco Systems, Inc.
- Schneider Electric SE
- Trimble Inc.
- HBM (HBK)
- National Instruments Corp.
- Fugro N.V.
- James Fisher & Sons plc
- Smart Structures Inc.
- Sixense Group
- Move Solutions Srl
- Sonicu
- Sensemetrics Inc.
- Vaisala
Additional Benefits:
- The market estimate (ME) sheet in Excel format
- 3 months of analyst support
TABLE OF CONTENTS
1 INTRODUCTION
- 1.1 Study Assumptions and Market Definition
- 1.2 Scope of the Study
2 RESEARCH METHODOLOGY
3 EXECUTIVE SUMMARY
4 MARKET LANDSCAPE
- 4.1 Market Overview
- 4.2 Market Drivers
- 4.2.1 5G Roll-outs Demanding Tower Integrity Verification
- 4.2.2 Digital-Twin Mandates for Aging Bridges in US and EU
- 4.2.3 LPWAN Sensor Cost Decline Enabling Dense Monitoring Grids
- 4.2.4 Insurance-Linked Monitoring for Tailings Dams in Latam
- 4.2.5 Offshore-Wind Corrosion Monitoring in Harsh Marine Zones
- 4.3 Market Restraints
- 4.3.1 Signal Attenuation inside Reinforced Concrete
- 4.3.2 Data-Sovereignty Barriers for Cloud Analytics in ME
- 4.3.3 Funding Gaps for Small Municipal Infrastructure Owners
- 4.4 Industry Value Chain Analysis
- 4.5 Regulatory Outlook
- 4.6 Porter's Five Forces Analysis
- 4.6.1 Threat of New Entrants
- 4.6.2 Bargaining Power of Buyers
- 4.6.3 Bargaining Power of Suppliers
- 4.6.4 Threat of Substitutes
- 4.6.5 Competitive Rivalry
5 MARKET SIZE AND GROWTH FORECASTS (VALUE)
- 5.1 By Component
- 5.1.1 Hardware
- 5.1.1.1 Sensors
- 5.1.1.2 Data Acquisition Systems
- 5.1.1.3 Gateways and Comms Devices
- 5.1.2 Software
- 5.1.3 Services
- 5.1.1 Hardware
- 5.2 By Connectivity Technology
- 5.2.1 Wi-Fi
- 5.2.2 Bluetooth
- 5.2.3 Zigbee
- 5.2.4 Cellular (3G/4G/5G)
- 5.2.5 LPWAN (LoRa, Sigfox, NB-IoT)
- 5.2.6 Satellite and Other Connectivity Technologies
- 5.3 By Application
- 5.3.1 Structural Monitoring
- 5.3.2 Geotechnical Monitoring
- 5.3.3 Environmental Monitoring
- 5.3.4 Seismic and Vibration Monitoring
- 5.3.5 Corrosion Monitoring
- 5.3.6 Other Specialized Applications
- 5.4 By Infrastructure Type
- 5.4.1 Bridges and Tunnels
- 5.4.2 Buildings and Commercial Structures
- 5.4.3 Dams and Water Infrastructure
- 5.4.4 Oil and Gas Pipelines and Refineries
- 5.4.5 Power Plants and Energy Facilities
- 5.4.6 Transportation Infrastructure (Rail, Roads, Airports)
- 5.4.7 Mining Sites
- 5.4.8 Renewable Energy Assets (Wind, Solar)
- 5.5 By Sensor Type
- 5.5.1 Strain and Stress Sensors
- 5.5.2 Displacement and Deflection Sensors
- 5.5.3 Accelerometers and Vibration Sensors
- 5.5.4 Temperature and Humidity Sensors
- 5.5.5 Inclination and Tilt Sensors
- 5.5.6 Other Sensor Types
- 5.6 By End-user
- 5.6.1 Civil Infrastructure Owners and Operators
- 5.6.2 Oil and Gas Companies
- 5.6.3 Utilities and Energy Companies
- 5.6.4 Transportation Authorities
- 5.6.5 Mining Companies
- 5.6.6 Government and Defense
- 5.6.7 Other End-users
- 5.7 By Geography
- 5.7.1 North America
- 5.7.1.1 United States
- 5.7.1.2 Canada
- 5.7.1.3 Mexico
- 5.7.2 South America
- 5.7.2.1 Brazil
- 5.7.2.2 Argentina
- 5.7.2.3 Rest of South America
- 5.7.3 Europe
- 5.7.3.1 United Kingdom
- 5.7.3.2 Germany
- 5.7.3.3 France
- 5.7.3.4 Italy
- 5.7.3.5 Spain
- 5.7.3.6 Nordics
- 5.7.3.7 Rest of Europe
- 5.7.4 Asia-Pacific
- 5.7.4.1 China
- 5.7.4.2 India
- 5.7.4.3 Japan
- 5.7.4.4 South Korea
- 5.7.4.5 ASEAN
- 5.7.4.6 Australia
- 5.7.4.7 New Zealand
- 5.7.4.8 Rest of Asia-Pacific
- 5.7.5 Middle East and Africa
- 5.7.5.1 GCC
- 5.7.5.2 Turkey
- 5.7.5.3 Israel
- 5.7.5.4 South Africa
- 5.7.5.5 Nigeria
- 5.7.5.6 Rest of Middle East and Africa
- 5.7.1 North America
6 COMPETITIVE LANDSCAPE
- 6.1 Market Concentration
- 6.2 Strategic Moves
- 6.3 Market Share Analysis
- 6.4 Company Profiles (includes Global Level Overview, Market Level Overview, Core Segments, Financials as available, Strategic Information, Market Rank/Share, Products and Services, Recent Developments)
- 6.4.1 Acellent Technologies, Inc.
- 6.4.2 Monnit Corporation
- 6.4.3 Sisgeo S.r.l.
- 6.4.4 Campbell Scientific, Inc.
- 6.4.5 Geokon, Inc.
- 6.4.6 RST Instruments Ltd.
- 6.4.7 Nova Metrix LLC
- 6.4.8 Worldsensing SL
- 6.4.9 Ackcio Pte Ltd.
- 6.4.10 Xylem Inc.
- 6.4.11 Honeywell International Inc.
- 6.4.12 Cisco Systems, Inc.
- 6.4.13 Schneider Electric SE
- 6.4.14 Trimble Inc.
- 6.4.15 HBM (HBK)
- 6.4.16 National Instruments Corp.
- 6.4.17 Fugro N.V.
- 6.4.18 James Fisher & Sons plc
- 6.4.19 Smart Structures Inc.
- 6.4.20 Sixense Group
- 6.4.21 Move Solutions Srl
- 6.4.22 Sonicu
- 6.4.23 Sensemetrics Inc.
- 6.4.24 Vaisala
7 MARKET OPPORTUNITIES AND FUTURE OUTLOOK
- 7.1 White-space and Unmet-Need Assessment

 基礎設施監測:市場佔有率分析、產業趨勢與統計、成長預測(2026-2031)
 基礎設施監測市場-2026-2032年全球市場預測
 2026年全球基礎設施監測市場報告無線起重機監控系統市場:按組件、部署類型、設備類型、連接技術、監控類型、計劃規模、應用、最終用戶分類,全球預測,2026-2032年
 基礎設施監控市場分析及預測(至2035年):依類型、產品類型、服務、技術、組件、應用、部署類型、最終用戶及解決方案分類
 基礎設施監控市場-全球產業規模、佔有率、趨勢、機會及預測(按組件、技術、應用、垂直產業、地區和競爭格局分類,2021-2031年)
 基礎設施監測市場-2026-2031年預測
 基礎設施監控市場規模、佔有率和成長分析(按組件、技術、應用、垂直產業和地區分類)-2026-2033年產業預測
 無線狀態監測系統市場規模、佔有率和趨勢分析報告:按組件、監測技術、連接類型、部署方式、最終用途、地區和細分市場預測(2025-2033 年)
 中國無線基礎設施(2025 年 7 月):中國憑藉其經濟和 5G 超級大國的地位,正在部署 5G-A(5G-Advanced),為新的國家重點發展項目 6G 奠定基礎。