


 |
市場調查報告書
商品編碼
2124045
智慧溫室:市場佔有率分析、產業趨勢與統計、成長預測(2026-2031)Smart Greenhouse - Market Share Analysis, Industry Trends & Statistics, Growth Forecasts (2026 - 2031) |
||||||

※ 本網頁內容可能與最新版本有所差異。詳細情況請與我們聯繫。
據 Mordor Intelligence 稱,2025 年智慧溫室市場價值 20.4 億美元,預計到 2031 年將從 2026 年的 22.3 億美元成長至 33.8 億美元,預測期(2026-2031 年)複合年成長率為 8.67%。
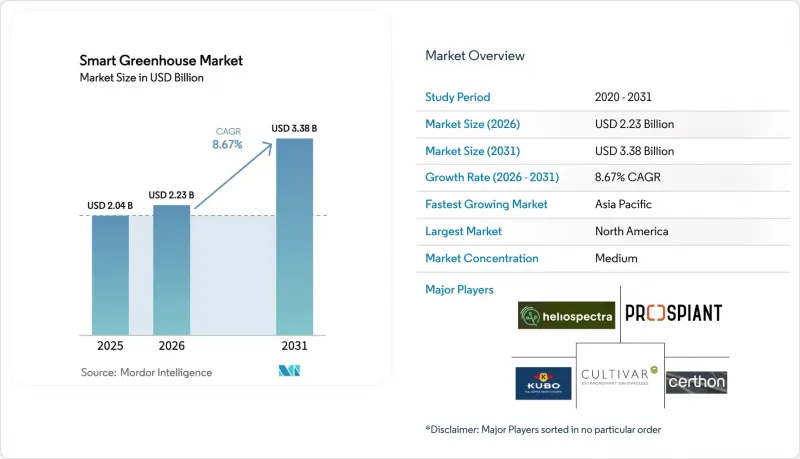
本報告按類型(水耕、非水耕)、技術(LED植物生長燈、暖通空調和氣候控制、物料輸送和機器人、控制系統和分析平台、其他)、產品/服務(硬體、軟體、服務)、最終用戶(商業種植者、研究和學術機構、其他)以及地區進行細分。市場預測以美元計價。
全球智慧溫室市場趨勢及洞察
物聯網和人工智慧在受控環境農業中的快速整合
邊緣處理的感測器數據可在不到一分鐘的時間內完成氣候調整,顯著降低作物壓力和勞動力投入。 Argus Control Systems 的 Axia 平台自 2025 年開始營運以來,已證明本地分析如何降低網路延遲和尖峰負載。 Priva 的「互聯」部署計劃在 2025 年底覆蓋超過 500 家商業設施,將基於天氣的預測與施肥和灌溉演算法相結合,從而減少 30% 的用水量。國際能源總署 (IEA) 在 2025 年評估報告中估計,人工智慧驅動的最佳化可以將溫室氣體排放量減少 15% 至 25%。在這些成就逐步實現的同時,人們對網路安全的意識也不斷增強。 IEEE 2025 年的一項研究強調,未加密的感測器閘道器是一個日益成長的風險因素。生產商目前正在對其操作技術(OT) 網路進行分段,並實施基於 ISO 27001 的控制措施,這進一步增強了以資料為中心的平台的長期吸引力。
對有機農產品的需求不斷成長
隨著農藥殘留檢測的普及,美國、德國和法國的零售商也越來越重視無農藥認證。可控環境農業幾乎可以消除土壤傳播的病原體,符合歐盟到2030年化學農藥使用量減半的指令。聯合國糧食及農業組織(糧農組織)在2024年的技術報告中證實,水耕生菜、番茄和草莓的農藥殘留量接近零。超級市場透過將溫室蔬菜定位為高階產品,提高了該品類的利潤率,其價格比露天種植的同類產品高出20%至40%。在農夫市集稀少的都市區,這一趨勢正在加速發展,儘管面臨普遍的通膨壓力,高階定價依然保持穩定。
智慧設施的初始投資成本高
包括暖通空調(暖氣、通風和冷氣)、LED照明、施肥、灌溉和分析系統在內,一座全自動智慧溫室的建造成本可高達每平方公尺1500美元。在新興市場,由於投資回收期超過七年,傳統金融機構不願放款。國際金融公司(IFC)曾提出租賃協議和利潤分成模式作為替代方案,但指出相關法律體制仍不足。能源消耗也帶來了更大的不確定性,當一些溫帶地區的溫室每年每公頃耗電高達300兆瓦時,這使得生產者極易受到收費系統波動的影響。
細分市場分析
到2025年,水耕系統將佔據智慧溫室市場57.23%的佔有率。這反映了其在沙漠和地中海氣候地區能夠循環利用高達90%的灌溉用水。在中東和南歐補貼計畫的推動下,預計到2031年,採用水耕系統的智慧溫室市場將以9.79%的複合年成長率成長。根據Netafim的一份報告,到2025年底,全球水耕種植面積將達到12,000公頃,其中阿拉伯聯合大公國的普及速度尤為迅猛,因為該國的水價超過每立方公尺2美元。同時,有機認證農場和研究土壤微生物組的研究機構仍在使用土壤耕作和混合種植方法,但由於需要人工除草和病蟲害防治,這些方法成本較高。氣耕將植物根系懸浮在營養液霧中,預計可額外節約 25% 的水,但由於設備複雜且電力消耗量仍屬於小眾產品。
水耕技術的廣泛應用也得益於監管負擔的減輕。根據歐盟《農藥永續使用指令》,與土壤種植相比,封閉回路型營養系統的報告要求更為簡便,降低了合規成本。同時,預計到2025年,創業投資對氣耕和魚菜共生新創企業的投資將超過2億美元,顯示投資人對水耕方法將支持下一波高密度城市生產浪潮充滿信心。
到2025年,LED植物生長燈將佔技術銷售額的38.56%,但預計到2031年,成長最強勁的將是控制系統和分析平台,複合年成長率將達到10.31%。隨著種植者將病蟲害監測、天氣預報和能源管理數位化,與決策支援軟體相關的智慧溫室市場正在不斷擴大。 Priva公司的「Blue ID」控制器將氣候感測器、肥料泵和智慧電錶整合到一個控制面板中,在荷蘭的試驗中,該產品將作物病害造成的損失減少了18%。同時,Signify公司的可調光LED燈在瓦赫寧根大學的試驗中將番茄產量提高了12%,這表明硬體具有持續且漸進的影響。用於種植和收穫的機器人技術仍處於概念驗證階段,但一旦每台機器人的成本降至4.5萬美元以下,預計將減少勞動成本。
此外,採用MQTT和OPC-UA等標準化通訊協定已成為一種趨勢。這使得不同類型的感測器、暖通空調驅動器和照明陣列能夠即插即用地整合。隨著互通性的提高,競爭優勢正從單一元件轉向整個資料迴路的整合,這進一步凸顯了強大分析套件的重要性。
區域分析
預計到2031年,亞太地區將以10.53%的複合年成長率推動全球擴張,主要得益於中國為郊區智慧溫室建設提供的100億元人民幣補貼計畫。在日本,位於大都會圈周邊的植物加工廠滿足了該國15%的生菜需求,而印度則透過其國家園藝使命計畫鼓勵對塑膠溫室維修。
北美地區預計到2025年將佔全球銷售額的34.79%,這得益於大麻合法化以及消費者對本地種植農產品的日益成長的需求。美國農業部報告稱,2022年至2025年間,受控田間種植面積增加了18%。加拿大設立了5,000萬加元(約3,700萬美元)的溫室創新基金,用於支持熱回收系統的維修,目標是到2030年將天然氣使用量減少25%。
歐洲成熟的供應鏈以荷蘭為中心,該國2024年溫室種植農產品出口達92億歐元(101億美元)。自2025年起,能源價格波動加速了地熱井和熱帶水產養殖水庫的普及應用。南美洲的成長速度較慢,主要受巴西和阿根廷業者的影響,這兩個國家的降雨量難以預測。中東和非洲的規模仍然較小,但具有重要的戰略意義。沙烏地阿拉伯國家農業技術中心正在試驗建造配備太陽能海水淡化系統的溫室,以將每公斤農產品的用水量降低到5公升以下。
其他好處:
- Excel格式的市場預測(ME)表
- 3個月的分析師支持
目錄
第1章:引言
- 研究假設和市場定義
- 調查範圍
第2章:調查方法
第3章執行摘要
第4章 市場狀況
- 市場概覽
- 市場促進因素
- 物聯網和人工智慧在受控環境農業中的快速整合
- 對不含農藥農產品的需求日益成長
- 人口成長導致糧食供應缺口
- 以城市為中心的垂直農業的投資
- 利用太陽能的溫室微電網可大幅降低營運成本。
- 排碳權計畫用於評估成本效益分析的效率
- 市場限制因素
- 智慧設施需要大量的初始資本投入。
- 溫室自動化領域熟練人員短缺
- 離網系統中電池供電的波動性
- 邊緣設備中的網路安全漏洞
- 產業價值鏈分析
- 監理情勢
- 技術展望
- 波特五力分析
- 宏觀經濟因素對市場的影響
第5章 市場規模與成長預測
- 按類型
- 水耕法
- 非水耕栽培(土壤栽培等)
- 透過技術
- LED植物生長燈
- 暖通空調和空調控制
- 物料輸送和機器人
- 控制系統和分析平台
- 其他技術
- 報價
- 硬體
- 軟體
- 服務(整合、維護、培訓)
- 最終用戶
- 商業種植者
- 研究和學術機構
- 零售/社區花園
- 城市/垂直農場
- 按地區
- 北美洲
- 美國
- 加拿大
- 墨西哥
- 南美洲
- 巴西
- 阿根廷
- 其他南美國家
- 歐洲
- 英國
- 德國
- 法國
- 義大利
- 西班牙
- 其他歐洲國家
- 亞太地區
- 中國
- 日本
- 印度
- 韓國
- 澳洲
- 其他亞太國家
- 中東和非洲
- 中東
- 沙烏地阿拉伯
- 阿拉伯聯合大公國
- 土耳其
- 其他中東國家
- 非洲
- 南非
- 埃及
- 奈及利亞
- 其他非洲國家
- 中東
- 北美洲
第6章 競爭情勢
- 市場集中度
- 策略趨勢
- 市佔率分析
- 公司簡介
- Heliospectra AB
- Prospiant Inc.
- Cultivar Greenhouse Ltd
- Kubo Greenhouse Projects BV
- Certhon Group
- Argus Control Systems Ltd
- Netafim Ltd
- Sensaphone Inc.
- Luiten Greenhouses
- Agra Tech Inc.
- Greenhouse Megastore(BFG Supply)
- Logiqs BV
- Priva Holding BV
- Nexus Corporation
- Greentech Agro LLC
- Ridder Group
- Motorleaf
- Autogrow Systems Ltd
- Signify NV
- LumiGrow Inc.
第7章 市場機會與未來展望
According to Mordor Intelligence, the smart greenhouse market size was valued at USD 2.04 billion in 2025 and is estimated to grow from USD 2.23 billion in 2026 to reach USD 3.38 billion by 2031, at a CAGR of 8.67% during the forecast period (2026-2031).
This report is Segmented by Type (Hydroponic, and Non-Hydroponic), Technology (LED Grow Lights, HVAC and Climate Control, Material Handling and Robotics, Control Systems and Analytics Platforms, and Others), Offering (Hardware, Software, and Services), End-User (Commercial Growers, Research and Academic Institutes, and More), and Geography. The Market Forecasts are Provided in Terms of Value (USD).
Global Smart Greenhouse Market Trends and Insights
Rapid IoT and AI Integration in Controlled-Environment Agriculture
Edge-processed sensor data now enables sub-minute climate adjustments, materially lowering crop-stress episodes and labour inputs. Argus Control Systems' Axia platform, operational since 2025, demonstrates how on-premises analytics reduce network latency and energy peaks. Priva's Connected installations surpassed 500 commercial sites by late 2025, combining weather-based forecasting with fertigation algorithms that cut water use by 30%. The International Energy Agency quantified a 15-25% greenhouse gas energy saving from AI-driven optimization in its 2025 assessment. These gains arrive alongside rising cybersecurity awareness; an IEEE study in 2025 highlighted unencrypted sensor gateways as a growing risk vector. Growers now segment operational-technology networks and adopt ISO 27001 controls, strengthening the long-term attractiveness of data-centric platforms.
Escalating Demand for Pesticide-Free Produce
Retail buyers in the United States, Germany, and France are prioritizing pesticide-free certification as residue-testing coverage widens. Controlled-environment agriculture can virtually eliminate soil-borne pathogens, aligning with the European Union mandate to halve chemical pesticide application by 2030. The Food and Agriculture Organization confirmed near-zero pesticide profiles for hydroponic lettuce, tomato, and strawberry crops in its 2024 technical note. Supermarkets refine category margins by positioning greenhouse vegetables as premium, gaining 20-40% price uplift versus field-grown equivalents. Urban centers where farmers' markets are scarce further accelerate this trend, sustaining premium elasticity despite broader inflationary pressure.
High Upfront Capital Expenditure for Smart Facilities
Fully automated smart greenhouses cost as much as USD 1,500 per square meter once HVAC, LEDs, fertigation, and analytics are included. Traditional lenders hesitate in emerging markets where payback periods stretch beyond seven years. The International Finance Corporation highlighted lease-to-own contracts and revenue-sharing structures as alternate pathways but noted that supportive legal frameworks remain patchy. Energy intensity adds further uncertainty; a temperate-zone hectare may draw 300 MWh annually, exposing growers to volatile tariff regimes.
Other drivers and restraints analyzed in the detailed report include:
- Population-Driven Food-Supply Gap
- Urban-Centric Vertical-Farming Investments
- Scarcity Of Greenhouse-Automation Talent
For complete list of drivers and restraints, kindly check the Table Of Contents.
Segment Analysis
Hydroponic configurations accounted for 57.23% of the smart greenhouse market share in 2025, reflecting their ability to recycle up to 90% of irrigation water in desert and Mediterranean climates. The smart greenhouse market size for hydroponic systems is projected to widen at a 9.79% CAGR through 2031 on the back of subsidies in the Middle East and Southern Europe. Netafim reported 12,000 hectares of hydroponic deployments worldwide by the end of 2025, with particularly swift uptake in the United Arab Emirates where water costs exceed USD 2 per m3. Soil-based and hybrid models persist in organic-certified farms and research institutes analyzing soil microbiomes, yet they incur higher hand-weeding and pest-management bills. Aeroponics, which suspends roots in nutrient mist, promises an incremental 25% water saving but remains niche due to equipment complexity and elevated power draw.
Hydroponic adoption also benefits from reduced regulatory burden. Under the European Union Sustainable Use of Pesticides Directive, closed-loop nutrient systems enjoy simplified reporting obligations compared with soil cultivation, trimming compliance costs. In parallel, venture capital directed toward aeroponic and aquaponic start-ups exceeded USD 200 million in 2025, signalling investor confidence that water-centric formats will underpin the next wave of high-density urban production.
LED grow lights captured 38.56% of technology revenue in 2025, yet the strongest growth to 2031 will stem from control systems and analytics platforms, projected at 10.31% CAGR. The smart greenhouse market size attached to decision-support software has expanded as growers digitize pest-scouting, weather forecasting, and energy management. Priva's Blue ID controller links climate sensors, fertigation pumps, and smart meters under a single dashboard and trimmed disease-related crop loss by 18% in Dutch trials. Meanwhile, Signify's tuneable-spectrum LEDs lifted tomato yields by 12% in Wageningen University tests, illustrating hardware's continual but incremental impact. Robotics for transplanting and harvesting remain at pilot stage yet promise labour savings once unit costs fall below USD 45,000 per robot.
A convergent trend sees growers embracing standardized communication protocols such as MQTT and OPC-UA, which allow plug-and-play integration of disparate sensors, HVAC drives, and lighting arrays. As interoperability grows, the competitive edge shifts from individual components to the cohesiveness of the full data loop, reinforcing the premium placed on robust analytics suites.
Complete Report Scope:
- By Type
- Hydroponic
- Non-Hydroponic (Soil-Based and Others)
- By Technology
- LED Grow Lights
- HVAC and Climate Control
- Material Handling and Robotics
- Control Systems and Analytics Platforms
- Other Technologies
- By Offering
- Hardware
- Software
- Services (Integration, Maintenance, Training)
- By End-User
- Commercial Growers
- Research and Academic Institutes
- Retail/Community Gardens
- Urban/Vertical Farms
- By Geography
- North America
- United States
- Canada
- Mexico
- South America
- Brazil
- Argentina
- Rest of South America
- Europe
- United Kingdom
- Germany
- France
- Italy
- Spain
- Rest of Europe
- Asia Pacific
- China
- Japan
- India
- South Korea
- Australia
- Rest of Asia Pacific
- Middle East and Africa
- Middle East
- Saudi Arabia
- United Arab Emirates
- Turkey
- Rest of Middle East
- Africa
- South Africa
- Egypt
- Nigeria
- Rest of Africa
- Middle East
- North America
Geography Analysis
Asia Pacific will pace global expansion with a 10.53% CAGR to 2031, propelled by China's CNY 10 billion subsidy program for peri-urban smart greenhouses. Japan supplies 15% of domestic lettuce demand via plant factories situated within metropolitan rings, while India incentivizes polyhouse upgrades through the National Horticulture Mission.
North America, holding 34.79% revenue in 2025, benefits from cannabis legalization and consumer preference for locally grown vegetables. The United States Department of Agriculture documented an 18% uptick in controlled-environment acreage from 2022-2025. Canada's CAD 50 million (USD 37 million) Greenhouse Innovation Fund supports heat-recovery retrofits aimed at cutting natural-gas use by 25% by 2030.
Europe's mature supply chains center on the Netherlands, which exported EUR 9.2 billion (USD 10.1 billion) in greenhouse produce during 2024. Energy-price volatility after 2025 accelerated the adoption of geothermal wells and heat-storage aquifers. South America's growth is moderate, led by Brazilian and Argentine operators battling erratic rainfall. The Middle East and Africa remain smaller yet strategically vital: Saudi Arabia's National Center for Agriculture Technologies is piloting solar-desalination greenhouses to cut water usage below 5 L kg-1 of produce.
- Heliospectra AB
- Prospiant Inc.
- Cultivar Greenhouse Ltd
- Kubo Greenhouse Projects BV
- Certhon Group
- Argus Control Systems Ltd
- Netafim Ltd
- Sensaphone Inc.
- Luiten Greenhouses
- Agra Tech Inc.
- Greenhouse Megastore (BFG Supply)
- Logiqs B.V.
- Priva Holding BV
- Nexus Corporation
- Greentech Agro LLC
- Ridder Group
- Motorleaf
- Autogrow Systems Ltd
- Signify N.V.
- LumiGrow Inc.
Additional Benefits:
- The market estimate (ME) sheet in Excel format
- 3 months of analyst support
TABLE OF CONTENTS
1 INTRODUCTION
- 1.1 Study Assumptions and Market Definition
- 1.2 Scope of the Study
2 RESEARCH METHODOLOGY
3 EXECUTIVE SUMMARY
4 MARKET LANDSCAPE
- 4.1 Market Overview
- 4.2 Market Drivers
- 4.2.1 Rapid IoT and AI Integration in Controlled-Environment Agriculture
- 4.2.2 Escalating Demand for Pesticide-Free Produce
- 4.2.3 Population-Driven Food-Supply Gap
- 4.2.4 Urban-Centric Vertical-Farming Investments
- 4.2.5 Solar-Powered Greenhouse Micro-Grids Slash Operating Costs
- 4.2.6 Carbon-Credit Programmes Rewarding CEA Efficiency
- 4.3 Market Restraints
- 4.3.1 High Upfront Capital Expenditure for Smart Facilities
- 4.3.2 Scarcity of Greenhouse-Automation Talent
- 4.3.3 Battery-Supply Volatility for Off-Grid Systems
- 4.3.4 Edge-Device Cybersecurity Vulnerabilities
- 4.4 Industry Value-Chain Analysis
- 4.5 Regulatory Landscape
- 4.6 Technological Outlook
- 4.7 Porter's Five Forces Analysis
- 4.7.1 Bargaining Power of Suppliers
- 4.7.2 Bargaining Power of Buyers
- 4.7.3 Threat of New Entrants
- 4.7.4 Threat of Substitutes
- 4.7.5 Intensity of Competitive Rivalry
- 4.8 Impact of Macroeconomic Factors on the Market
5 MARKET SIZE AND GROWTH FORECASTS (VALUE)
- 5.1 By Type
- 5.1.1 Hydroponic
- 5.1.2 Non-Hydroponic (Soil-Based and Others)
- 5.2 By Technology
- 5.2.1 LED Grow Lights
- 5.2.2 HVAC and Climate Control
- 5.2.3 Material Handling and Robotics
- 5.2.4 Control Systems and Analytics Platforms
- 5.2.5 Other Technologies
- 5.3 By Offering
- 5.3.1 Hardware
- 5.3.2 Software
- 5.3.3 Services (Integration, Maintenance, Training)
- 5.4 By End-User
- 5.4.1 Commercial Growers
- 5.4.2 Research and Academic Institutes
- 5.4.3 Retail/Community Gardens
- 5.4.4 Urban/Vertical Farms
- 5.5 By Geography
- 5.5.1 North America
- 5.5.1.1 United States
- 5.5.1.2 Canada
- 5.5.1.3 Mexico
- 5.5.2 South America
- 5.5.2.1 Brazil
- 5.5.2.2 Argentina
- 5.5.2.3 Rest of South America
- 5.5.3 Europe
- 5.5.3.1 United Kingdom
- 5.5.3.2 Germany
- 5.5.3.3 France
- 5.5.3.4 Italy
- 5.5.3.5 Spain
- 5.5.3.6 Rest of Europe
- 5.5.4 Asia Pacific
- 5.5.4.1 China
- 5.5.4.2 Japan
- 5.5.4.3 India
- 5.5.4.4 South Korea
- 5.5.4.5 Australia
- 5.5.4.6 Rest of Asia Pacific
- 5.5.5 Middle East and Africa
- 5.5.5.1 Middle East
- 5.5.5.1.1 Saudi Arabia
- 5.5.5.1.2 United Arab Emirates
- 5.5.5.1.3 Turkey
- 5.5.5.1.4 Rest of Middle East
- 5.5.5.2 Africa
- 5.5.5.2.1 South Africa
- 5.5.5.2.2 Egypt
- 5.5.5.2.3 Nigeria
- 5.5.5.2.4 Rest of Africa
- 5.5.5.1 Middle East
- 5.5.1 North America
6 COMPETITIVE LANDSCAPE
- 6.1 Market Concentration
- 6.2 Strategic Moves
- 6.3 Market Share Analysis
- 6.4 Company Profiles (includes Global level Overview, Market level overview, Core Segments, Financials as available, Strategic Information, Market Rank/Share for key companies, Products and Services, and Recent Developments)
- 6.4.1 Heliospectra AB
- 6.4.2 Prospiant Inc.
- 6.4.3 Cultivar Greenhouse Ltd
- 6.4.4 Kubo Greenhouse Projects BV
- 6.4.5 Certhon Group
- 6.4.6 Argus Control Systems Ltd
- 6.4.7 Netafim Ltd
- 6.4.8 Sensaphone Inc.
- 6.4.9 Luiten Greenhouses
- 6.4.10 Agra Tech Inc.
- 6.4.11 Greenhouse Megastore (BFG Supply)
- 6.4.12 Logiqs B.V.
- 6.4.13 Priva Holding BV
- 6.4.14 Nexus Corporation
- 6.4.15 Greentech Agro LLC
- 6.4.16 Ridder Group
- 6.4.17 Motorleaf
- 6.4.18 Autogrow Systems Ltd
- 6.4.19 Signify N.V.
- 6.4.20 LumiGrow Inc.
7 MARKET OPPORTUNITIES AND FUTURE OUTLOOK
- 7.1 White-Space and Unmet-Need Assessment

 高階溫室市場:全球產業分析、市場規模、市場佔有率及按作物類型、覆蓋材料、應用、組件、國家和地區分類的預測-2026年至2033年
 智慧溫室市場-2026-2032年全球市場預測高科技溫室市場:2026-2032年全球市場預測(依產品、作物類型、栽培系統、技術、結構類型、安裝類型、能源來源、最終用途和銷售管道)
 2026-2030年全球智慧溫室市場
 高階溫室市場:按材料、產品類型、組件、應用和地區分類
 智慧溫室市場規模、佔有率和趨勢分析報告:按組件、類型、栽培方法、作物、應用、地區和細分市場預測(2026-2033 年)
 全球智慧溫室市場規模、佔有率、趨勢和成長分析報告(2026-2034)
 智慧溫室市場規模、佔有率、趨勢及預測(按類型、產品、最終用戶及地區分類),2026-2034年
 高階溫室市場-全球產業規模、佔有率、趨勢、機會和預測:按材料、產品類型、組件類型、應用、地區和競爭格局分類,2021-2031年
 智慧溫室市場規模、佔有率和成長分析(按類型、材質、組件、最終用戶和地區分類)-2026-2033年產業預測